Category Archives: Climate Change; a Geological Perspective

Beneath the ice; Greenland’s bedrock

Facebooktwitterlinkedininstagram

Greenland is giving up its secrets, one at a time

Greenlands bedrock revealed by radar

Greenland’s ice-sheet is a significant component of the global ice-ocean volume budget. Ice-sheet waxing and waning has figured prominently in sea level change over the last 3 million years – not quite as long as its Antipodean counterpart. It is front and center of current estimates of sea level change and cold, freshwater through-flow to the North Atlantic Ocean. In focusing on ice budgets and sea level we tend to overlook the fact that the ice-sheet is underlain by bedrock. Melting can take place at the base of an ice-sheet as well as the top. Ingress of warmer seawater at the base of an ice-sheet (where it meets the coast) exacerbates melting. Coastal ice acts as a kind of buttress to the interior regions of ice sheets, which means that changes in melting and calving at the coast will affect ice-sheet dynamics in the interior.  Thus, knowing the depth and topography of the buried bedrock surface will permit more accurate estimates of ice volumes, and the kind of data needed to rank ice-sheet – coast intersections at risk of increased melting and calving.

We catch glimpses of Greenland’s bedrock along its coast. The foundations are metamorphosed Precambrian sedimentary and igneous rocks as old as 3.9 billion years. Zircon crystals in some of the rocks are even older, indicating the presence of solid crust more than 4 billion years ago).

The most widely used measure of ice thickness uses radar signals beamed from planes and satellites. Radar signals travel through the ice until they are reflected from boundaries like the top of the bedrock. Radar signal reflection is based on the different electrical properties of ice and bedrock (the process is analogous to reflection of seismic signals from different rock layers in the earth, but in the case of radar the signals respond to changes in electrical properties rather than changes in density). It’s a bit like lifting a veil; you never know what you might find.

The radar data is collected along intersecting flight paths, presenting a grid that extends over most of Greenland. Several programs have gathered data over large swaths of the island, the most extensive being NASA’s Operation Icebridge  which has produced ice thickness measurements over flight paths totaling more than 580,000 km. A comprehensive analysis of all this data (involving an international consortium of 32 institutions) was published in a 2018 issue of Geophysical Research Letters (lead author M. Morlighem).

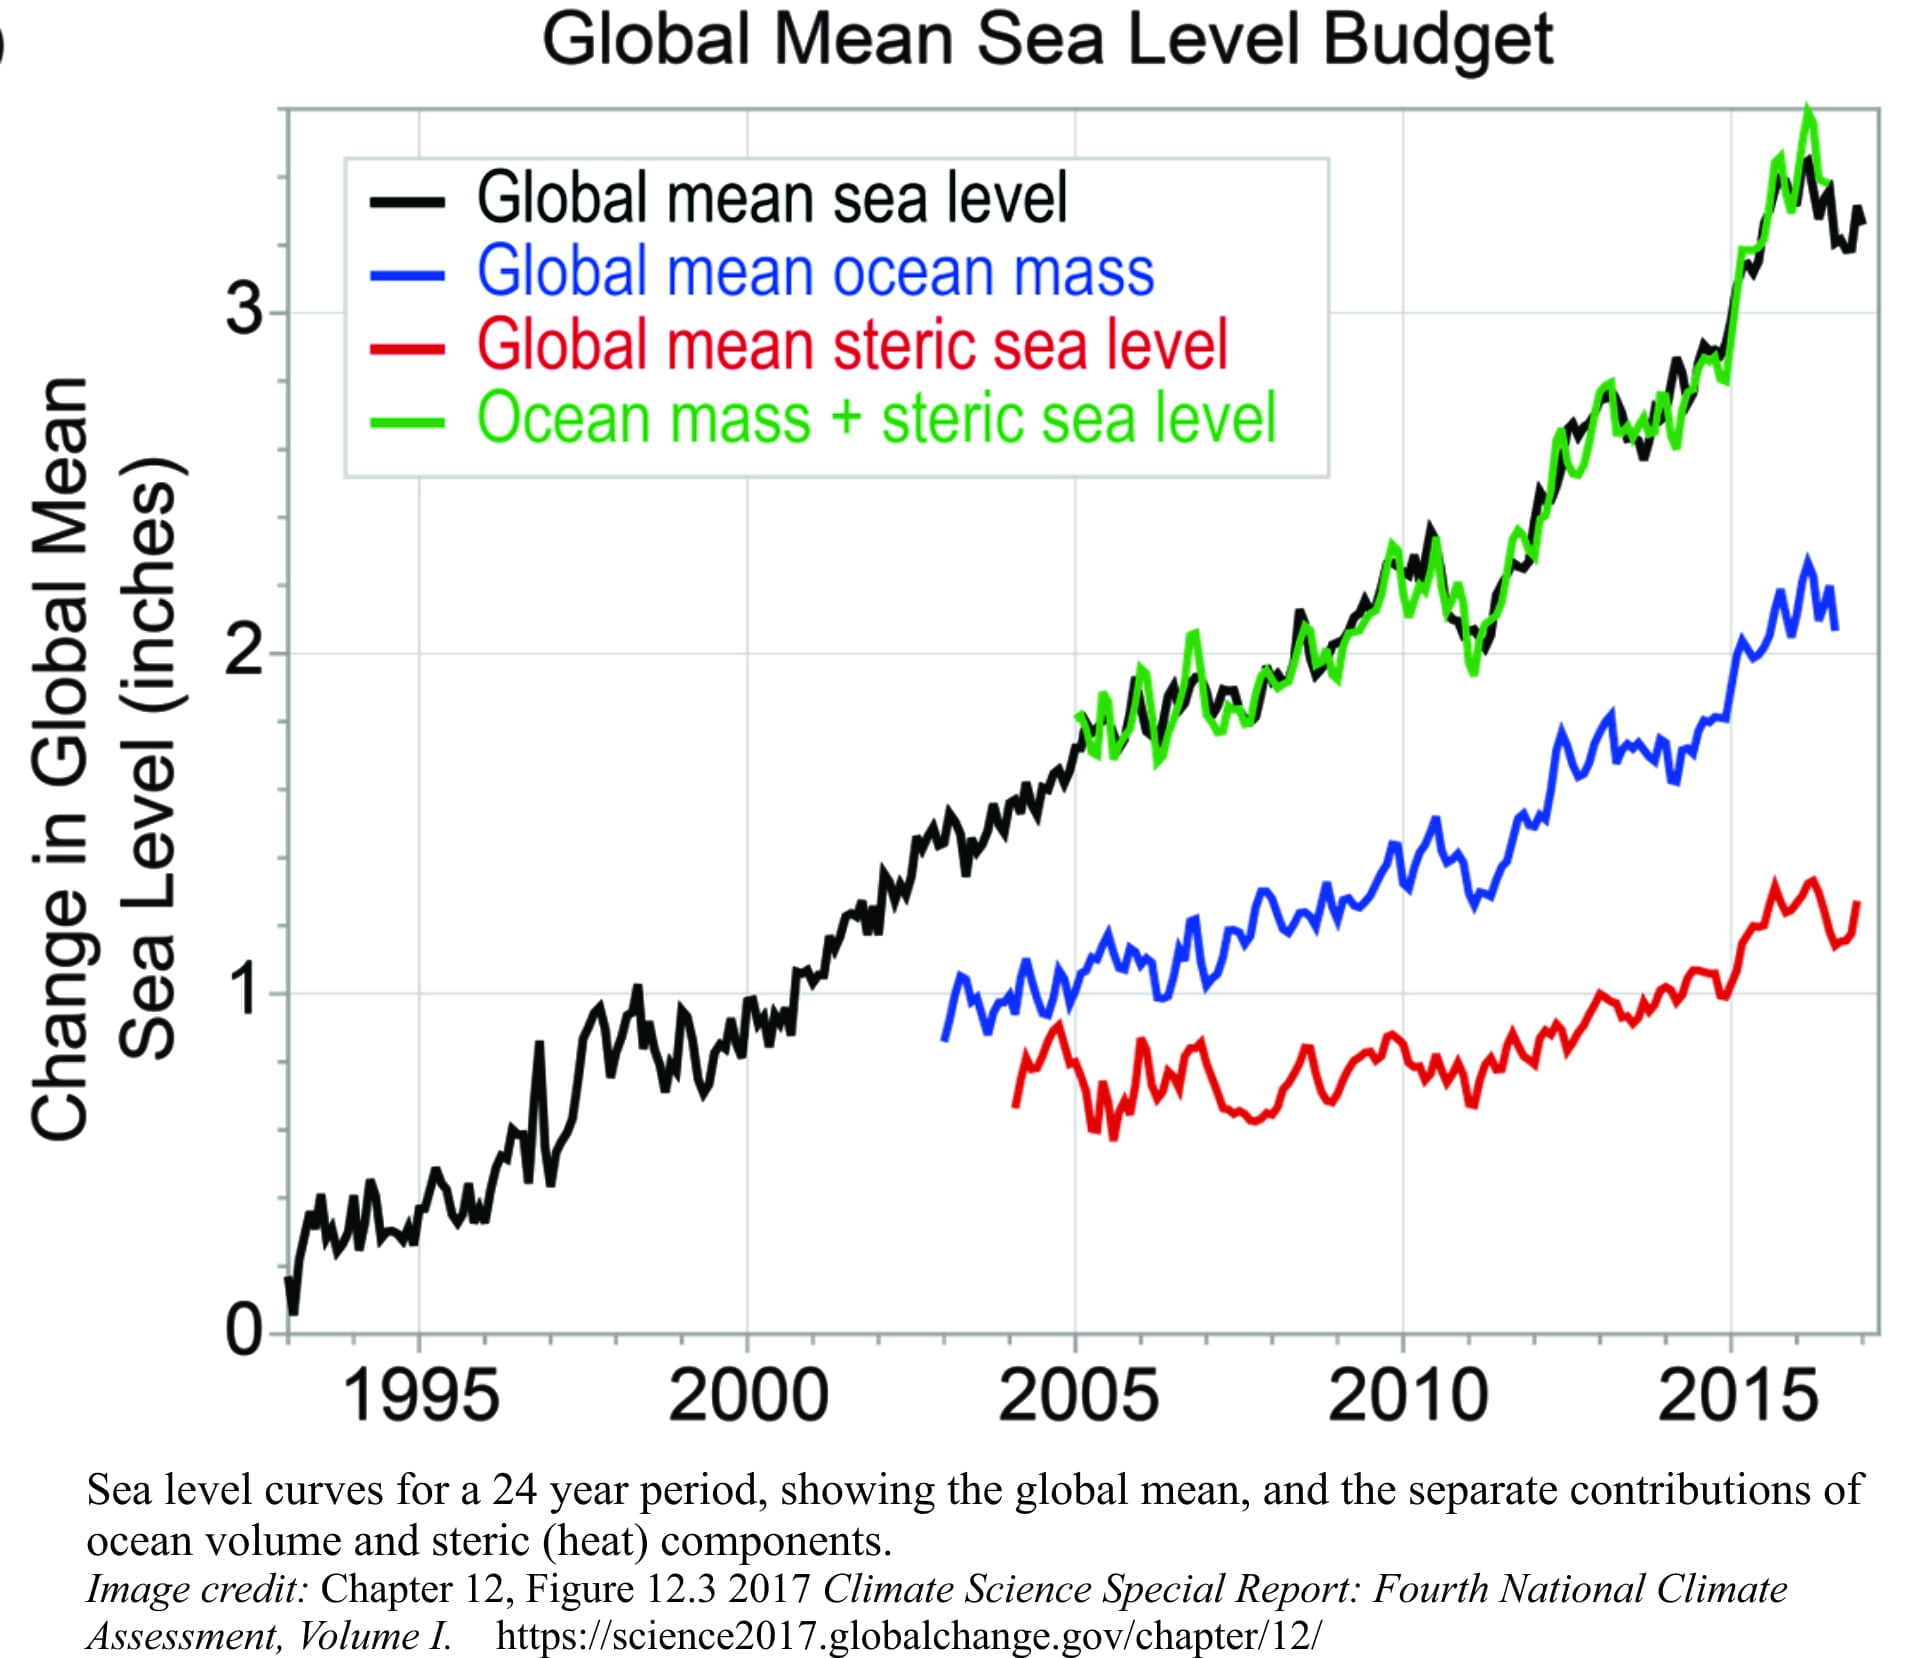
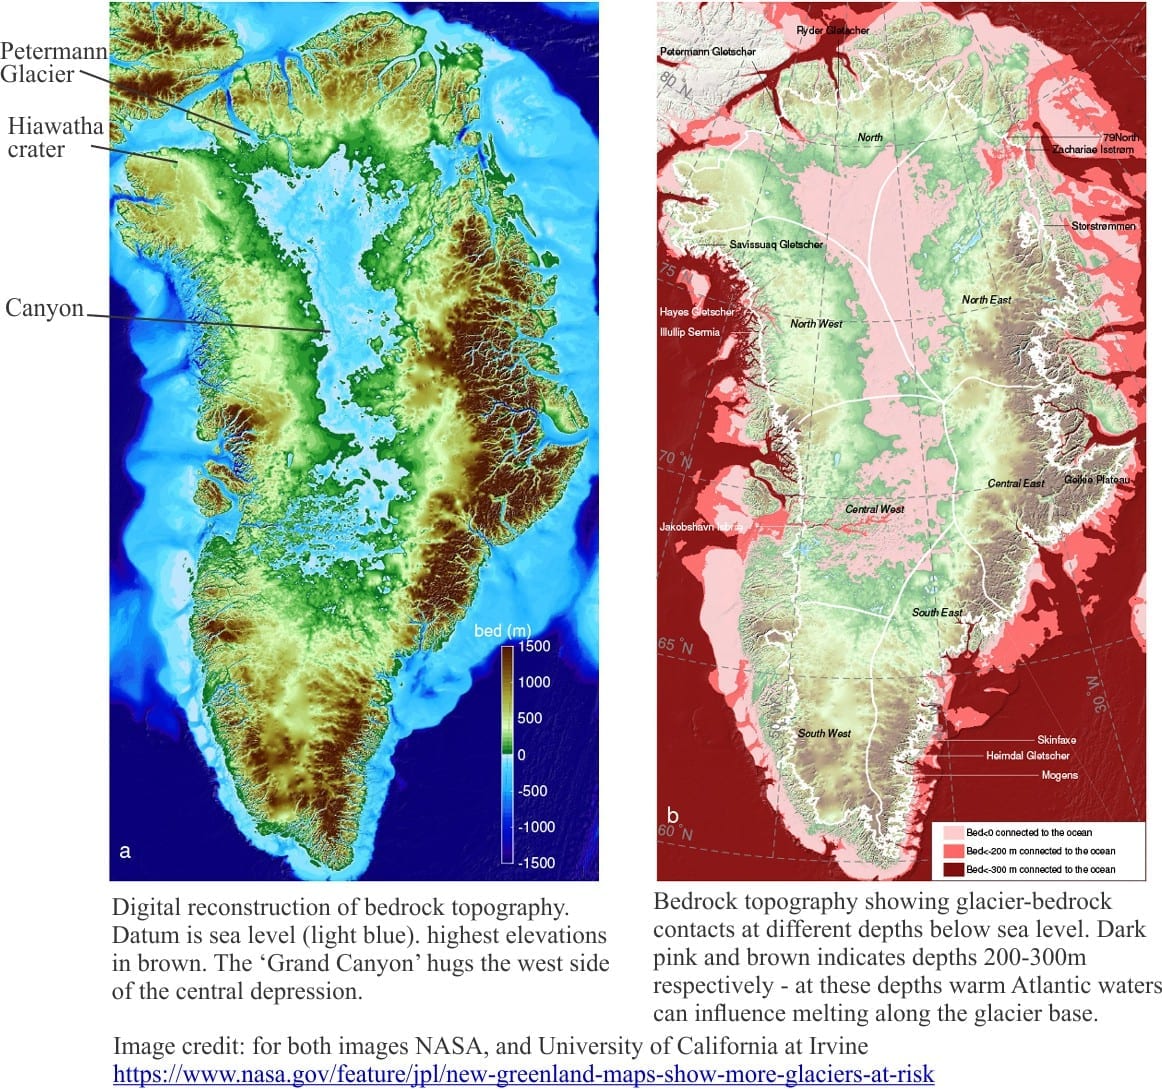
Ice thickness, and therefore depth to bedrock data is used to refine digital reconstructions of bedrock topography, provide more accurate calculation of ice volumes and, in the event that the ice melts, the potential rise in sea level based on the increase in ocean volume (currently estimated at 7.42m, notwithstanding other effects such as rebound of the landmass and surrounding ocean floor; i.e. isostatic rebound).

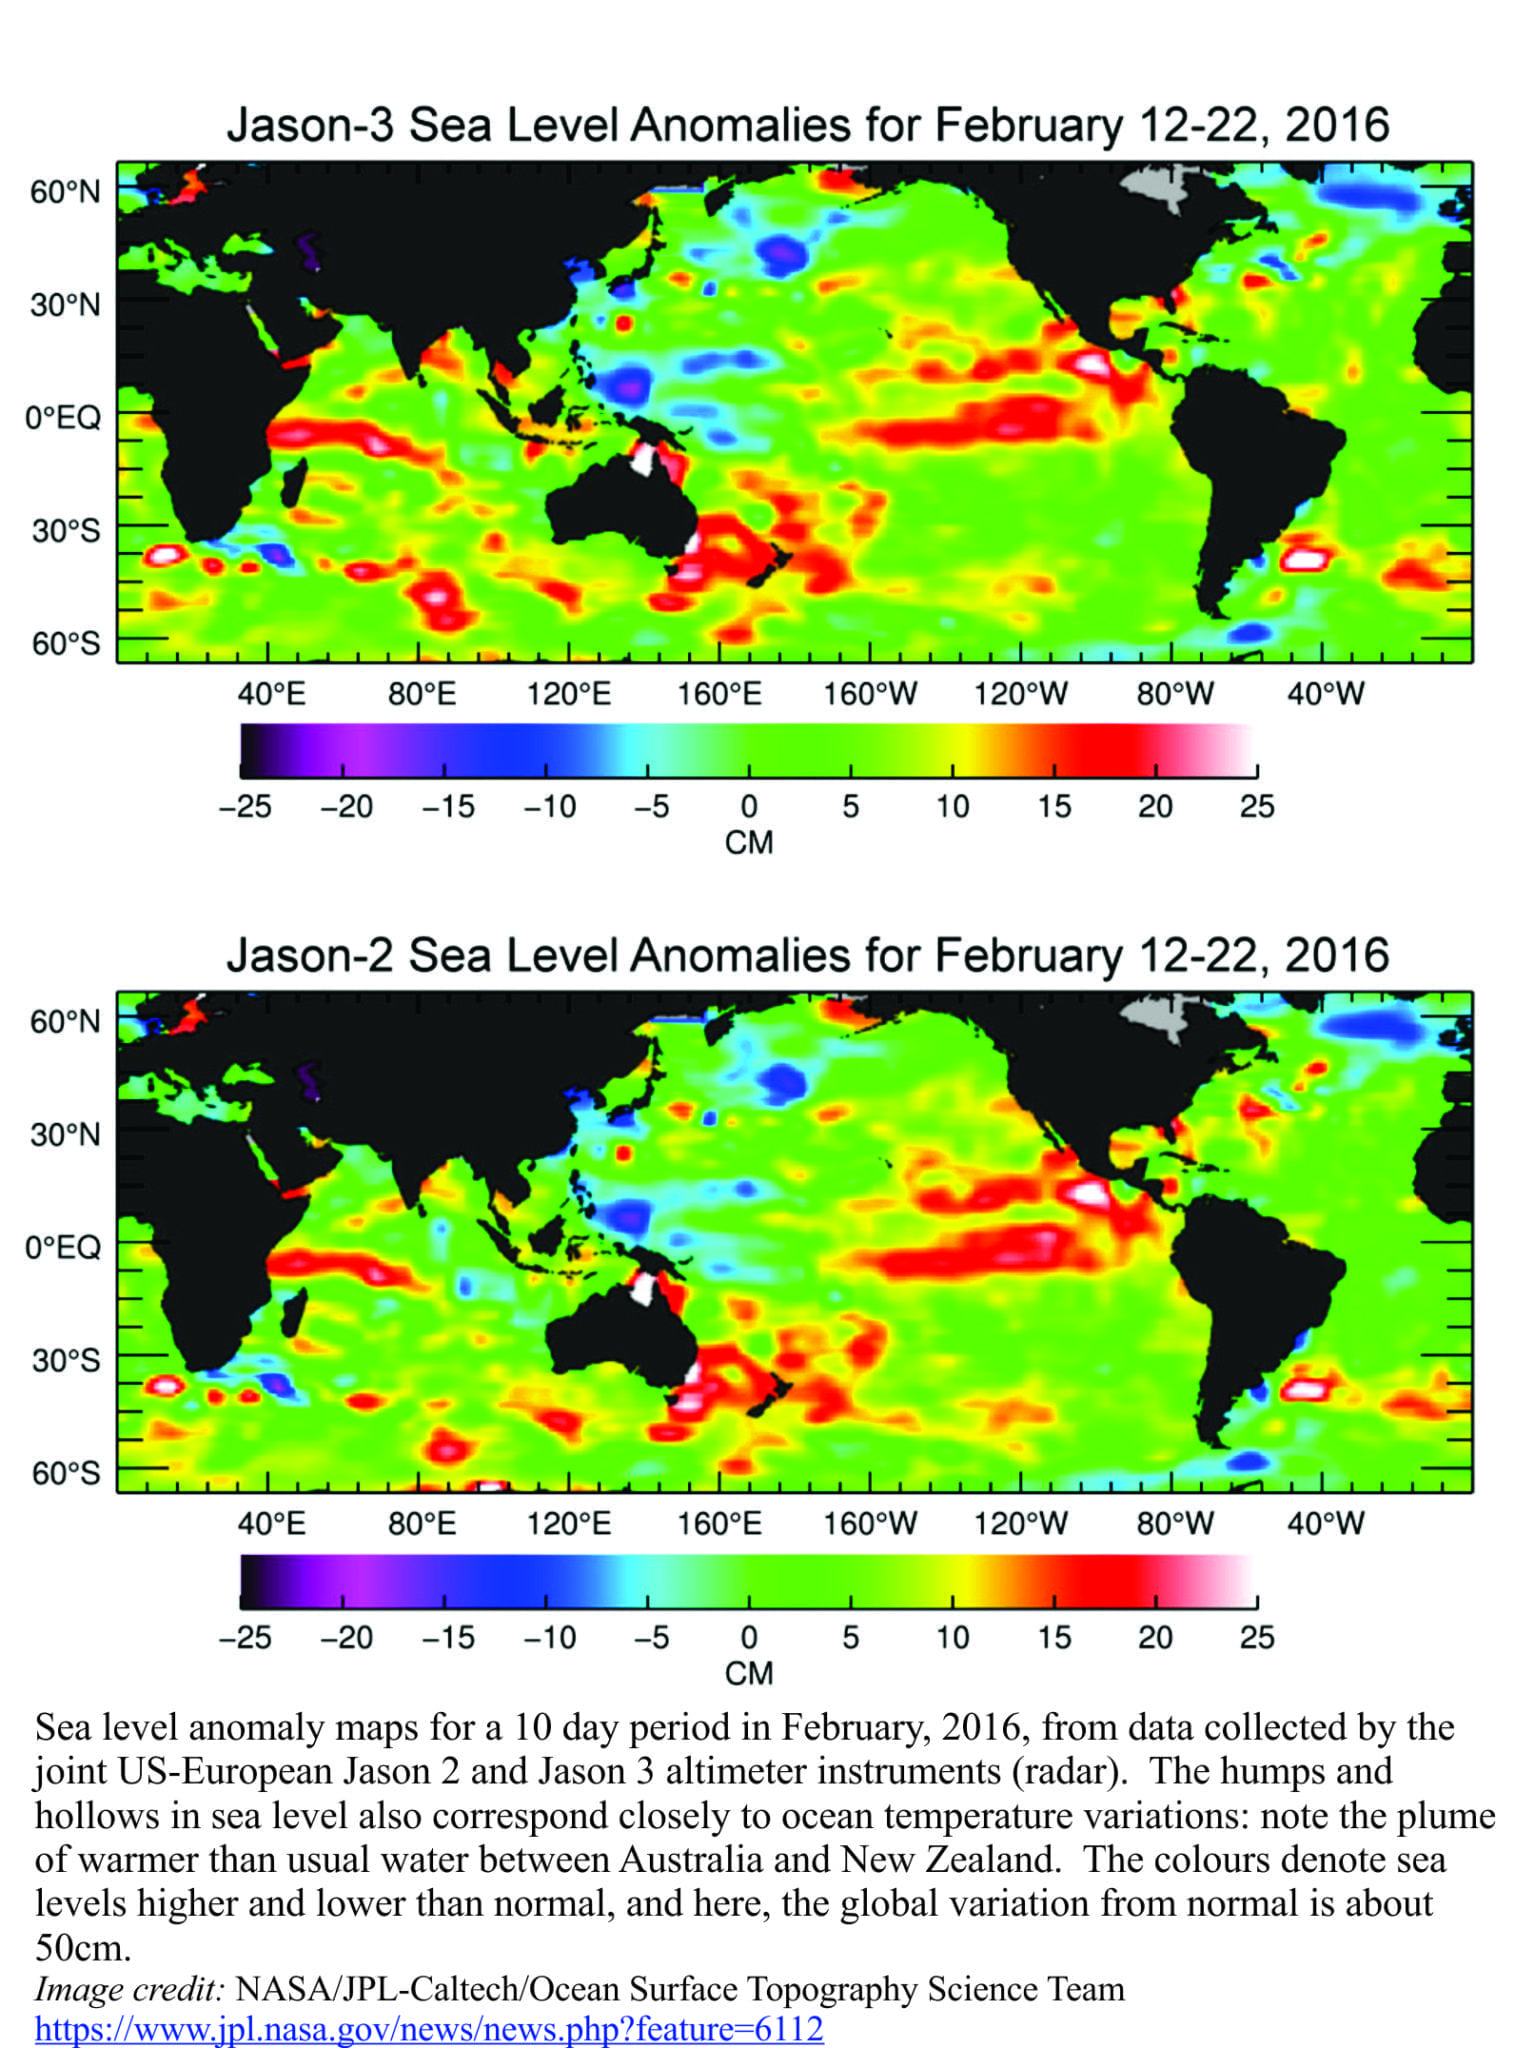
New coastal bathymetry data was also used to map the depth below sea level at the point where glaciers enter the sea. These depth measures are important at depths greater than 200-300m because the exposure of ice to warmer ocean waters exacerbates subglacial ice melting, calving, and ice-front retreat at the contact between bedrock and ice. Identifying glaciers that are susceptible to ocean-forced melting is an important part of ice-budget monitoring (see maps at top of page).

The subglacial bedrock topography presented in these maps was reconstructed using present sea level as the datum. The central region (blue colours) is below sea level and corresponds to a region of thick ice. Overall, about 22% of Greenland’s ice is below sea level. Reconstructions like these represent Greenland with all ice instantly removed. This kind of portrayal is useful to see what presently lies beneath the ice, but in reality if substantial melting did occur the landmass and adjacent continental shelf would begin to rise in response to reduced ice loads. Isostatic rebound begins almost immediately and would continue long after the ice has disappeared. The central depression, in large part caused by the present weight of ice, would potentially be as high or at higher elevations than the adjacent margins in the event that it fully rebounded to its position before ice began to accumulate.


A Grand Canyon

The new data has allowed investigators to probe other features of the subglacial topography. Greenland’s own version of a ‘Grand Canyon’ wends in sinuous fashion almost 750km from the central part of the island, north to the fiord into which Petermann Glacier empties; in places it is 800m deep (published in Science, 2013 – unfortunately it is not Open Access).


Have a look at this NASA video.

It lies beneath about 3km of ice; it is also below sea level. For size it rivals Arizona’s Grand Canyon. The irregular outline, depth and general rugged appearance suggests that the channel and its incision into bedrock formed before the ice sheet at least 2-3 million years ago.  Subglacial channels can provide drainage for meltwaters at the base of the ice sheet and as such will influence the dynamics of ice flow.  This is a massive structure, but how and why it formed and its effect on ice sheet behaviour are still to be guessed at.


The Hiawatha impact crater

West of the Canyon on the northwest fringe of the ice sheet, an intriguing circular shape in the ice led researchers at the Natural History Museum of Denmark to probe deeper into NASA’s Icebridge data. Initial investigations indicated a sympathetic structure in the underlying bedrock. Additional airborne radar was acquired that subsequently confirmed their suspicions. Buried beneath a kilometre of ice was a crater, 31 km in diameter, about 300m deep, with a raised outer rim and raised center.


Greenland's meteorite crater

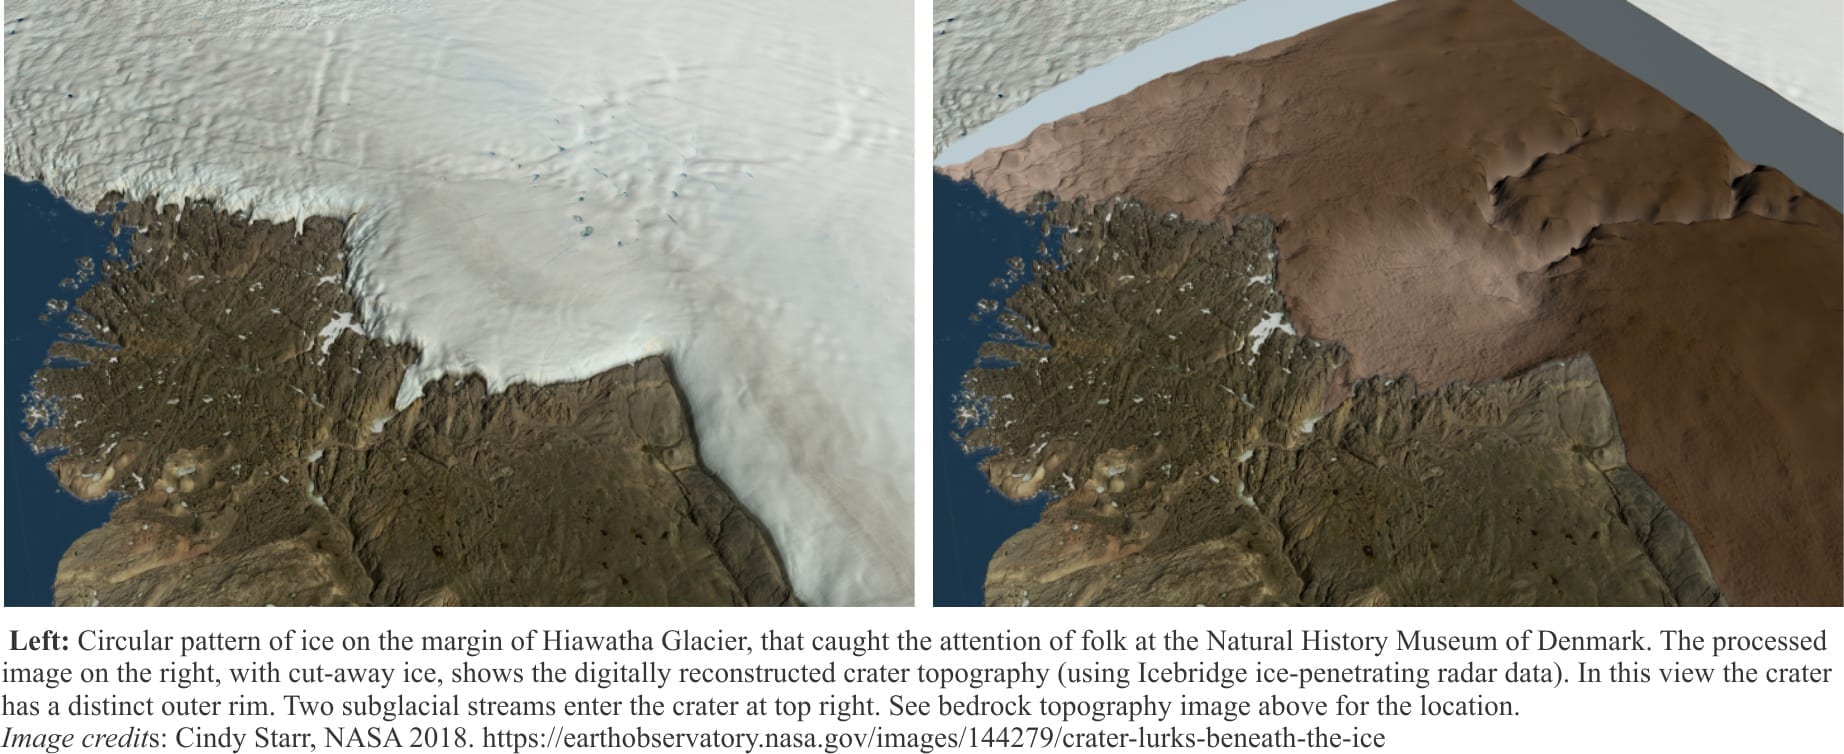
The morphology revealed by the radar data would probably have been enough to convince most people of its extraterrestrial origin. Fortuitously, the ice sheet here is drained by a couple of subglacial streams that appear to pass through the structure. Sediment samples were collected from streams where they emerge from the ice. The discovery of quartz crystals exhibiting evidence of high-pressure shock (shock lamellae visible in microscope views), provided the necessary confirmation.  This is indeed a meteorite impact crater, the result of a bolide about a kilometre across; in size it ranks 25th on an Earth scale. The radar data also suggests that fragmented bedrock is incorporated into ice near the base of the ice sheet, in which case the impact was probably quite recent – perhaps no more than two million years ago. This was a sizeable impact and it is intriguing to ponder its effects on the course of Pleistocene evolution and climate. It is the first impact crater to be discovered beneath an ice sheet.

Like the deep oceans, ice sheets contain hidden worlds. Remote sensing, like ice-penetrating radar, allows us to ‘see’ what lies beneath. There seems little doubt that Greenland and Antarctica will reveal more geological treasures.


Addendum

The age of Hiawatha impact crater, and therefore the impact itself, have recently been updated – it appears to be much older than previously determined. A paper by Kenny et al., 2022 (open access) in Science Advances describes 49Ar-39Ar dating of shocked zircons from fragments found in glacial outwash immediately downstream of the crater. The new date is 58 Ma – which is Late Paleocene, and is about 7 million years after the (end Cretaceous) impact that finished off the dinosaurs (among other organisms).

Facebooktwitterlinkedininstagram
Facebooktwitterlinkedin

Coral reefs and waves: degradation of the first might lead to increased damage by the second

Facebooktwitterlinkedininstagram

Anyone who has swum, snorkeled, or dived among coral reefs, will breach the sea surface a different person. The unimaginable diversity of life, the vitality, colour, texture, are breathtaking. Apex predators keep silent watch; minuscule crustaceans scurry from polyp to shelly crag. Life and death and life, chapter and verse.

Continue reading

Facebooktwitterlinkedininstagram
Facebooktwitterlinkedin

Jet Streams

Facebooktwitterlinkedininstagram

Resolute Bay, Canadian Arctic, winter 1990

The Polar Vortex. Sounds like scenes from the apocalyptic movie The Day After Tomorrow; a bit of a down-draft and everything freezes. The real vortex refers to a low-pressure system with a cold, west-to-east flowing (counter clockwise) air mass that hovers over the north pole (there is also a vortex over Antarctica). When stable, the cold air remains in the north, contained by the polar jet stream. When unstable, as sometimes happens in winter, the polar jet stream meanders such that cold air can penetrate much farther south.

February is deep winter in the Arctic, and yet current temperatures there are hovering around zero degrees C; almost T-shirt weather.  Warm air masses are being allowed to enter this normally frozen domain, while the cold snaps (March 2018) are wedged into southern Canada, USA and Europe. Arctic winter temperatures are abnormally high, significantly higher than past recorded temperature anomalies.  Is something happening to the Polar Vortex; is it in a state of decay? And if so, is this process part of some long-term climate change, or is it just another anomalous spike on the climate record? None of the answers proffered so far are definitive, at least from a scientific point of view (mind you, the media are having a field day). Science will go some way to resolving this problem by observing how jet streams respond over the next few decades. Continue reading

Facebooktwitterlinkedininstagram
Facebooktwitterlinkedin

It looks like sea level rise is accelerating; the era of satellite altimetry

Facebooktwitterlinkedininstagram

Strand Fiord, Axel Heiberg Island.

Sea level. It’s the most common starting point for any kind of elevation measurement, a datum, that for centuries was understood to be an invariant surface. Then some geologists came along and showed that, for eons past, sea level has risen and fallen countless times; coasts were flooded, sea floors exposed. And sea level is still changing, going up in some places, down in others, but on average it is rising; it has been doing this for the last few 1000 years.

The current globally averaged rate of sea level rise is 3.0 +/- 0.4 millimetres per year, based on satellite altimetry. Satellite measurement of sea level is now about 25 years old. Earlier measurements, some dating back to 1700, were made by tide gauges, basically glorified measuring sticks (the initial technology was just that) which over the years, have become sophisticated, automated measuring systems.  Tide gauges measure water levels on a local scale, and in order to make sense of the data in the context of global sea level, all manner of local variables need to be considered: for example, is the location open to the ocean or a sheltered harbour, storm surges, seasonal changes in currents and water mass temperatures, changes in air pressure (sea levels rise during passage of low pressure systems – this is part of the storm surge), and whether the land is rising or subsiding (i.e. local tectonics). In contrast, satellite altimetry gathers data from a much broader swath of the ocean surface. Both Jason 2 and the more recent Jason 3 satellites can cover 95% of the ice-free ocean surface in 10 days. The accuracy of the Jason 3 radar altimeter is currently an impressive 3.3 cm.


Sea level anomaly maps for 2016, from satellite dataRising sea levels and changing climate are inextricably linked because ocean water mass volumes increase or decrease in concert with changes in the volume of land-based ice (primarily the Antarctic and Greenland ice sheets), plus changes in ocean temperature (this is the steric effect) and salinity.  Thus, if there is an acceleration in atmospheric warming or cooling, there will be a reasonably sympathetic acceleration in ocean volume change and therefore, sea level change.  This is the scenario posited by many climate-change model projections – that increased warming will produce an acceleration in sea level rise. A recent publication that analyses the 25 years of satellite altimetry data (Proceedings of the National Academy of Sciences, 2018), concludes that the (global) average sea level rise is accelerating at 0.084 +/- 0.025 mm/year2, which means that the current speed of sea level rise (about 3 mm/year), will increase year upon year.


Sea level curves for 1993 to 2017 showing the steric and volume contributions

The possibility of accelerating sea level rise during the 20th century, based mainly on tidal gauge data, has been debated although most analyses indicated a degree of ambiguity in the data. In fact, a 1990 ICCP report (page 266) concluded there was little concrete evidence at that time for an acceleration, although re-analysis of 20th century tide gauge data, published in Nature (2015) did show a possible accelerating trend. If that analysis is correct, this is the first time such an acceleration has been demonstrated with reasonable confidence from a single data set.

As the published analysis shows, teasing accurate sea level numbers from the satellite data is not a simple task.  As is the case for any kind of remote sensing or monitoring, there are data corrections and filters.  Some of the corrections include:

  • Terrestrial water storage (rivers, lakes, and groundwater); this is necessary because of natural variability in the exchange between land-based water and the oceans,
  • Natural variability in land-based ice storage and melting, that adds to, or subtracts water from ocean masses,
  • Natural variability in heat exchange between the atmosphere and oceans (the steric contribution to sea level),
  • Multi-year cycles such as ENSO (El Niño Southern Oscillation)
  • One-off events such as volcanic eruptions that affect regional temperatures because of ash and aerosols; in this case the Pinatubo eruption influence was incorporated into the analysis.
  • And the drift in satellite orbits; this variability is much less than that of tide gauges.

The sum of these errors gives the plus (+) and minus (–) value (0.025 mm/year2) that is attached to the overall result – 0.084 mm/year2 (check the open access publication for details). So, if our current rate of sea level rise is 3mm/year, then in 10 years the rate will have increased (accelerated) to 3.84 mm/year, and after 50 years to 7.2 mm/year (almost double the 2017 rate).

Data correction may seem like a bit of a fudge, but it is a critical part of almost every measurement we take, no matter where or what it is; it is part of the process in science that makes data intelligible and coherent.  Correcting data is part and parcel of any attempt to isolate causes and effects, as well as determining the kinds of error that are inherent in all measurements. The bottom line in this example, and one that is pointed to by the authors, is that the analysis is preliminary, and that some of the corrections might change as our knowledge of climate and other global systems improves.  However, there is confidence that this kind of analysis is on the right track.

Facebooktwitterlinkedininstagram
Facebooktwitterlinkedin

The fractured lives of ice shelves; destined to collapse

Facebooktwitterlinkedininstagram

deformed ice on exposed portion of Muller Ice cap, Axel Heiberg Island.Under the influence of gravity ice will flow or creep, albeit glacially. Stand in front of a glacier or the edge of an ice sheet and if you’re patient enough, you will see it creep, inexorably. It may take a while (days, months) but like I said, be patient. Bits of ice may fall off the front (calve) but that’s more the product of gravitational instability and weakness at the exposed ice edge. If it wasn’t for the propensity to flow there would be no glaciers, and ice sheets would stand still.

Antarctic ice shelves, those thick, floating wedges and platforms of ice, are a direct consequence of ice flow. One of them, Larsen C, has been in the news of late because a very large chunk (5800 sq. km), broke off and floated away as an iceberg; the inevitable comparisons have the new iceberg (imaginatively named A68) as twice the size of Luxembourg or about the size of Delaware.  The Larsen C collapse took place in July 2017 during the polar winter, thus requiring thermal images; scientists had to wait for the summer sun to rise before getting a first-hand view of the new iceberg. Continue reading

Facebooktwitterlinkedininstagram
Facebooktwitterlinkedin

Polar bears do not live in the Antarctic, there are no Penguins in the Arctic. The asymmetry of the poles

Facebooktwitterlinkedininstagram

This post is about asymmetry – the Arctic and Antarctic polar regions. They are the most frigid places on Earth, but that is about all they have in common; with one other exception –  they are both stunningly beautiful. I can attest to this for the Arctic, or at least the Canadian Arctic Islands where I spent several summers; but I’ve never been to Antarctica. Visual treats everywhere. And silence – above the wind and the hum of a few insects – silence.

There is an intriguing asymmetry in their respective geographies, the timing of ice accumulation, present climates, the flora and fauna. What follows are a few comparisons and contrasts. Continue reading

Facebooktwitterlinkedininstagram
Facebooktwitterlinkedin

Nitrate in excess; a burgeoning global contamination problem

Facebooktwitterlinkedininstagram

Phytoplankton and algal bloom in Lake Eries, 2011A “Nitrate timebomb”.  Last week’s media metaphor (Nov 10, 2017), was no doubt intended to create visions of dire deeds. After all, it seems that explosions are not in short supply these days. The actual story though is more droll, based as it is on the slow leakage of excess chemicals called nitrates, into the global environment. No fireworks; only leakage. The headline in several media outlets, only lasted a day or two, barely scratching our collective consciousness. Perhaps the problem is too big, or too remote – a candidate for the too-hard-basket. As Mark Twain might have said, “I guess so, I dunno”.

Nitrogen itself is not a concern; every breath we take contains 80% N2. It’s what we do with nitrogen that is causing problems, particularly in natural systems like soils, surface waters, groundwater aquifers, and ultimately, the oceans. The scientific paper that caused these brief media conniptions was published this month in Nature Communications (it is Open Access). Continue reading

Facebooktwitterlinkedininstagram
Facebooktwitterlinkedin

Dirt; Soil degradation is a global problem we inflict on ourselves

Facebooktwitterlinkedininstagram

The media loves hyperbole. In some ways they remind me of ‘The end is nigh’ cartoon guy. This week (Oct 16, 2017) it’s ‘Ecological Armageddon’, a kind of end-of-the-world announcement that is founded on what looks like a drastic reduction in the insect biomass in parts of Germany; 75% of insects have disappeared since 1989. I don’t mean to trivialise these alarming reports, because if it turns out to be a phenomenon of more global extent (the collapse of bee colonies does not augur well), then the ramifications for activities like food production could be dire. The report’s authors note that the cause of this reduction is not yet understood, a sensible comment based on the limited scope of their study (the paper is Open Access). But their caution has not stifled speculation and hyperbole.

The demise of insects segues into the topic of this blog; the alarming rate at which soils, globally, are being degraded. There is a symbiotic relationship between soils and insects, linked primarily to the vital role both play in vegetation productivity. Continue reading

Facebooktwitterlinkedininstagram
Facebooktwitterlinkedin

Class 5; The Toba eruption – how a super volcano almost stopped humanity in its tracks

Facebooktwitterlinkedininstagram

Kayaking down Asahan River, north Sumatra. This river has all but been destroyed by a dam project

Toba Lake, in northern Sumatra, occupies the ancient Toba caldera. One of its outlets, the Asahan River, is the site of some spectacular white-water, a kayaker’s delight. For anyone willing to run the river, spare a thought for your early human ancestors, who it seems, were lucky to survive the aftermath of a cataclysmic super volcanic eruption 74,000 years ago. Be thankful that they did. Continue reading

Facebooktwitterlinkedininstagram
Facebooktwitterlinkedin

The intriguing paradox of global warming piggybacking on global cooling

Facebooktwitterlinkedininstagram

17th century depiction of a frozen riverFlood, fire, drought … We have, by luck and muddled management, thwarted pestilence, but it seems that changing weather patterns everywhere are leading us on a merry dance.  Our climate is giving us a bumpy ride; anyone living in the Caribbean and southeast US, or Bangladesh, will attest to this, given the havoc that hurricanes and tropical cyclones have wrought over the past few months (northern hemisphere summer, 2017).  The skinny, outer layers of our world (air and oceans) seem to be getting warmer. No doubt there are consequences?

It may seem paradoxical, but global warming is taking place against a backdrop of global cooling. Forcing of global climates is governed by internal (within our own skinny sphere) and external agents; the latter by solar output and earth’s changing orbit. There is now, good Continue reading

Facebooktwitterlinkedininstagram
Facebooktwitterlinkedin