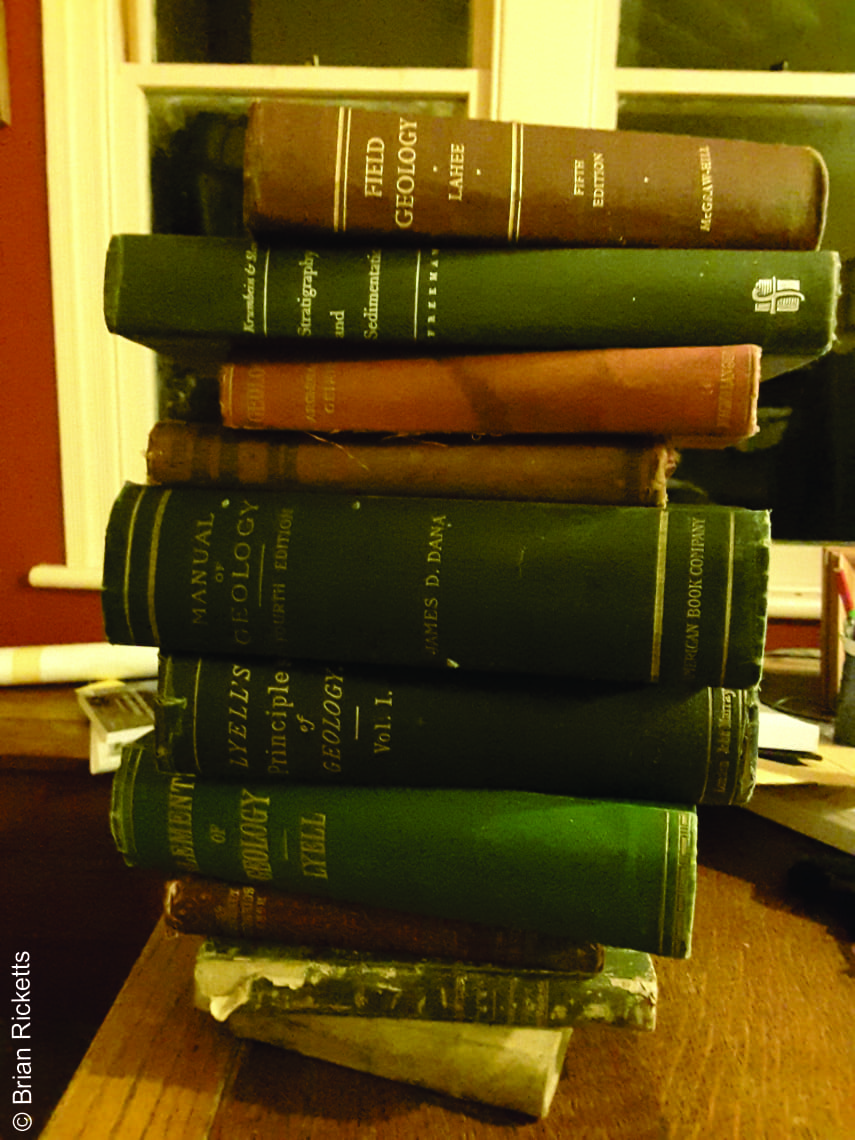
Being acquainted with things that are really ancient, is an everyday experience for a geologist; fossils and other flotsam of lives past, meteorites as old as the solar system itself. Records of these ancient lives, their successes and failures, of catastrophes, of ancient worlds, are written in every chip of rock, every grain of sand. We marvel at these stories, at their old-ness. My recent visit to the British Library in London was a reminder that our written history is also ancient, but counted in millennia rather than eons. I’m talking books and parchment, not carved cuneiform tablets. These treasures are housed in a room of the same name, light and humidity controlled, protected from hands that would love to turn the pages. Sensible precautions of course; many of these pieces would probably disintegrate at the slightest touch. I’d never seen the sole-surviving copy of Beowulf, an original Gutenberg or King James Bible, the Magna Carta, a 3rd Century fragment of a Gospel, a Thomas Tallis liturgical composition. So many documents that record our history and inform our present. Continue reading →
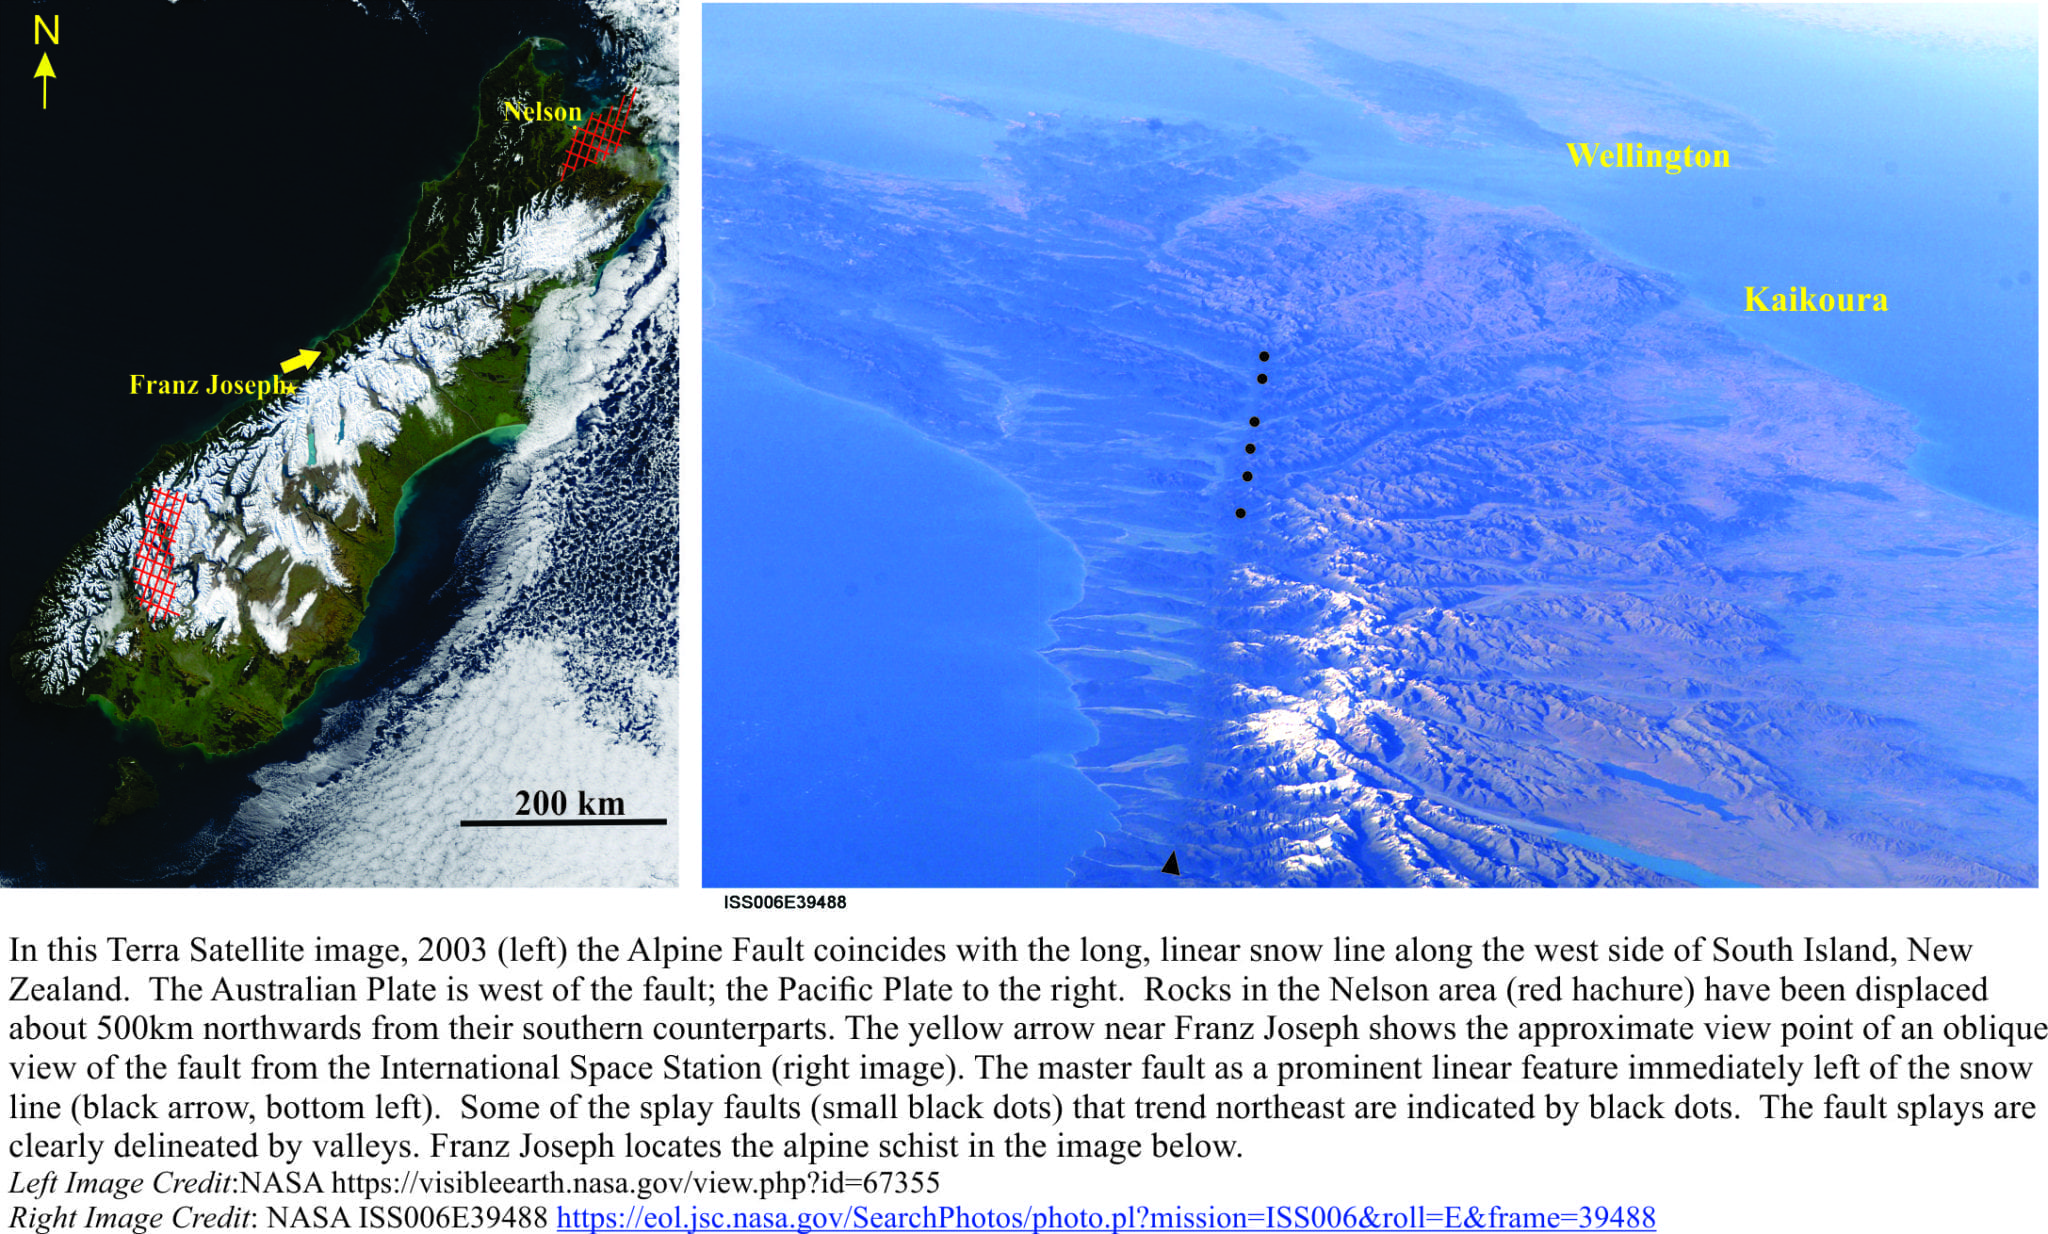
In 1940-41, Harold Wellman, a creative but somewhat irreverent New Zealand geologist, along with his colleague Dick Willett, discovered a remarkably long, linear fault striking slightly oblique to, and a few kilometres landward of the South Island west coast; almost the entire length of the island. They called this massive structure the Alpine Fault. The Fault can be traced overland some 600 km, about 450km of this is a more-or-less single fault strand; at its northern extent the fault splits into several strands, all of which are active.
Most New Zealand geologists in the 1940s had little problem with a structure like this – admittedly it was very long, but most were familiar with faults, especially active ones. By 1948 it had generally been accepted by the scientific community. The community did however have an issue with Wellman’s next discovery. He realised that a certain group of rocks in the southern part of South Island (Otago region), were almost identical to a group at the north end of the Island (Nelson region). He postulated in 1949 that these two geological domains were once a contiguous unit but had been separated some 500km by the Alpine Fault. To many geologists at the time, this was going a bit too far, and it took several years to dispel the initial disbelief, and perhaps the odd conniption fit; one of the main criticisms was the absence of any reasonable mechanism to accomplish this geological feat. This was pre-Plate Tectonics, a time when many earth scientists still considered vertical movements of the earth’s crust to be the most important (although Alfred Wegener’s ideas on Continental Drift were discussed – it seems that Wellman was quite keen on this hypothesis). Fast forward to 1965 and a paper by J. Tuzo Wilson published in Nature, described a “New Class of Faults…”; Transform Faults. Wellman’s discovery was about to acquire a mechanism, and become an iconic part of the new Plate Tectonics.
All plates identified by Plate Tectonic theory have boundaries, of which there are three basic types:
Spreading ridges and rifts, where upwelling magma creates new crust that moves away from the ridge,
Deep ocean trenches where two plates converge, forming a subduction zone that recycles old crust and mantle, and
Transform faults where two plates slide past one another. Most of this sliding is horizontal. If the movement between two massive slabs of crust and mantle were continuous then there would be few problems, other than a gradual (mm/year) change in one’s property boundary lines. But most movement along these fundamental structures is not continuous or uniform; it takes place in fits and starts – during earthquakes that commonly are very high magnitude, destructive events.
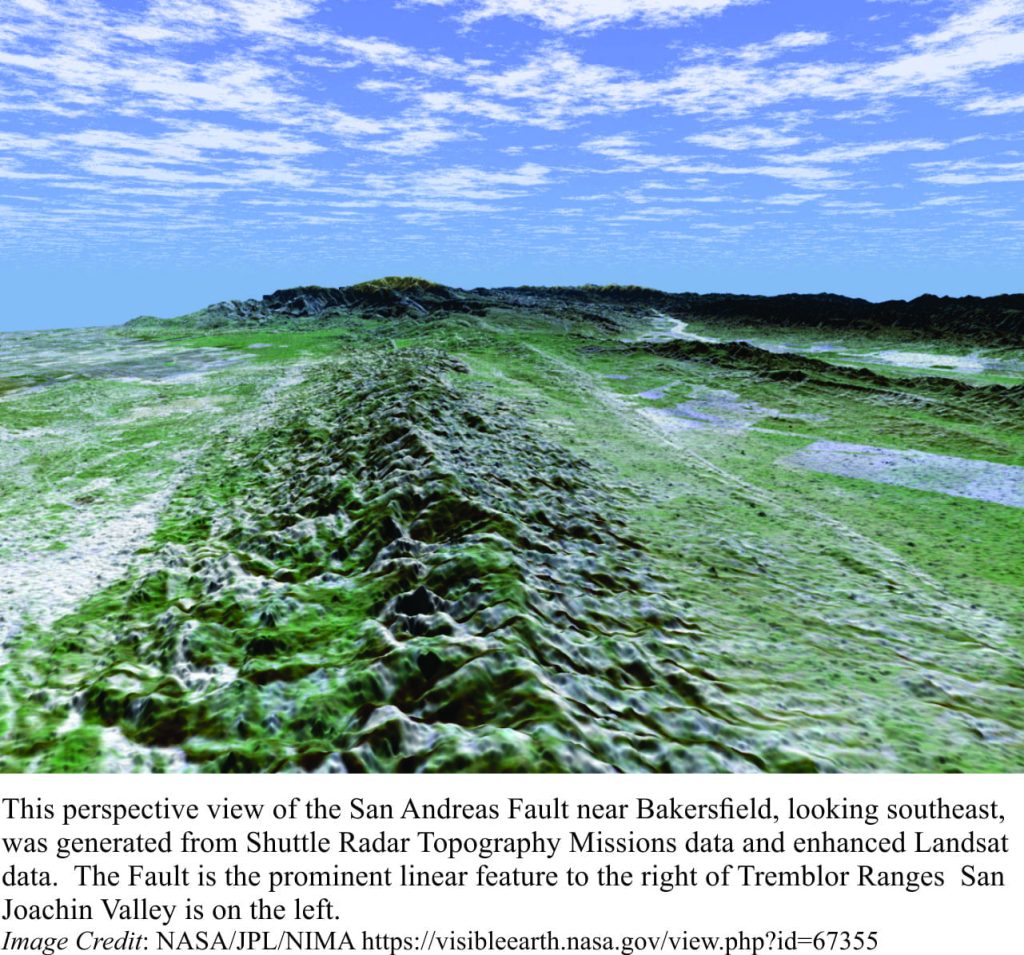
The Alpine Fault, and its close relative San Andreas Fault on the other side of the Pacific Ocean, are transform faults. They each mark a boundary between two plates – if you walk across the San Andreas fault you pass from the Pacific Plate to the American Plate; over the Alpine Fault, from the Pacific to the Australian Plate. There aren’t many places on earth where one can easily straddle two tectonic plates; these two transform faults provide great opportunities to become one with plate tectonics.
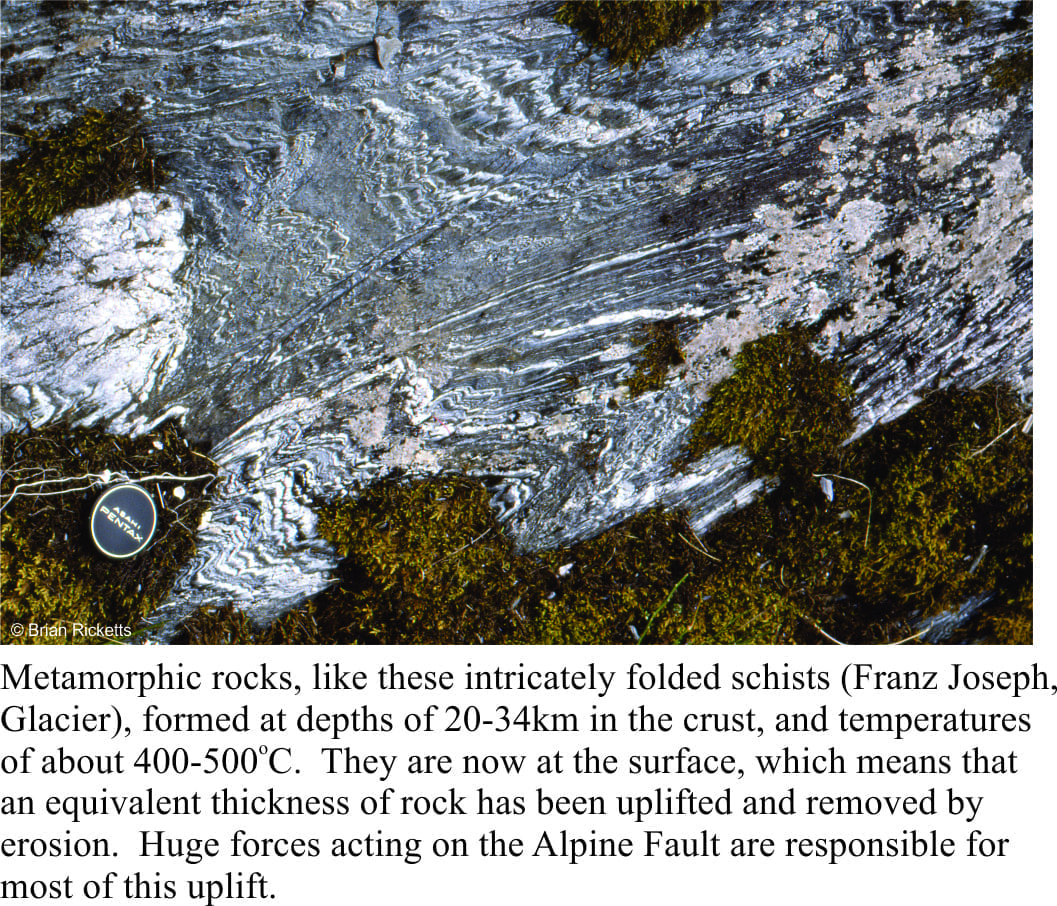
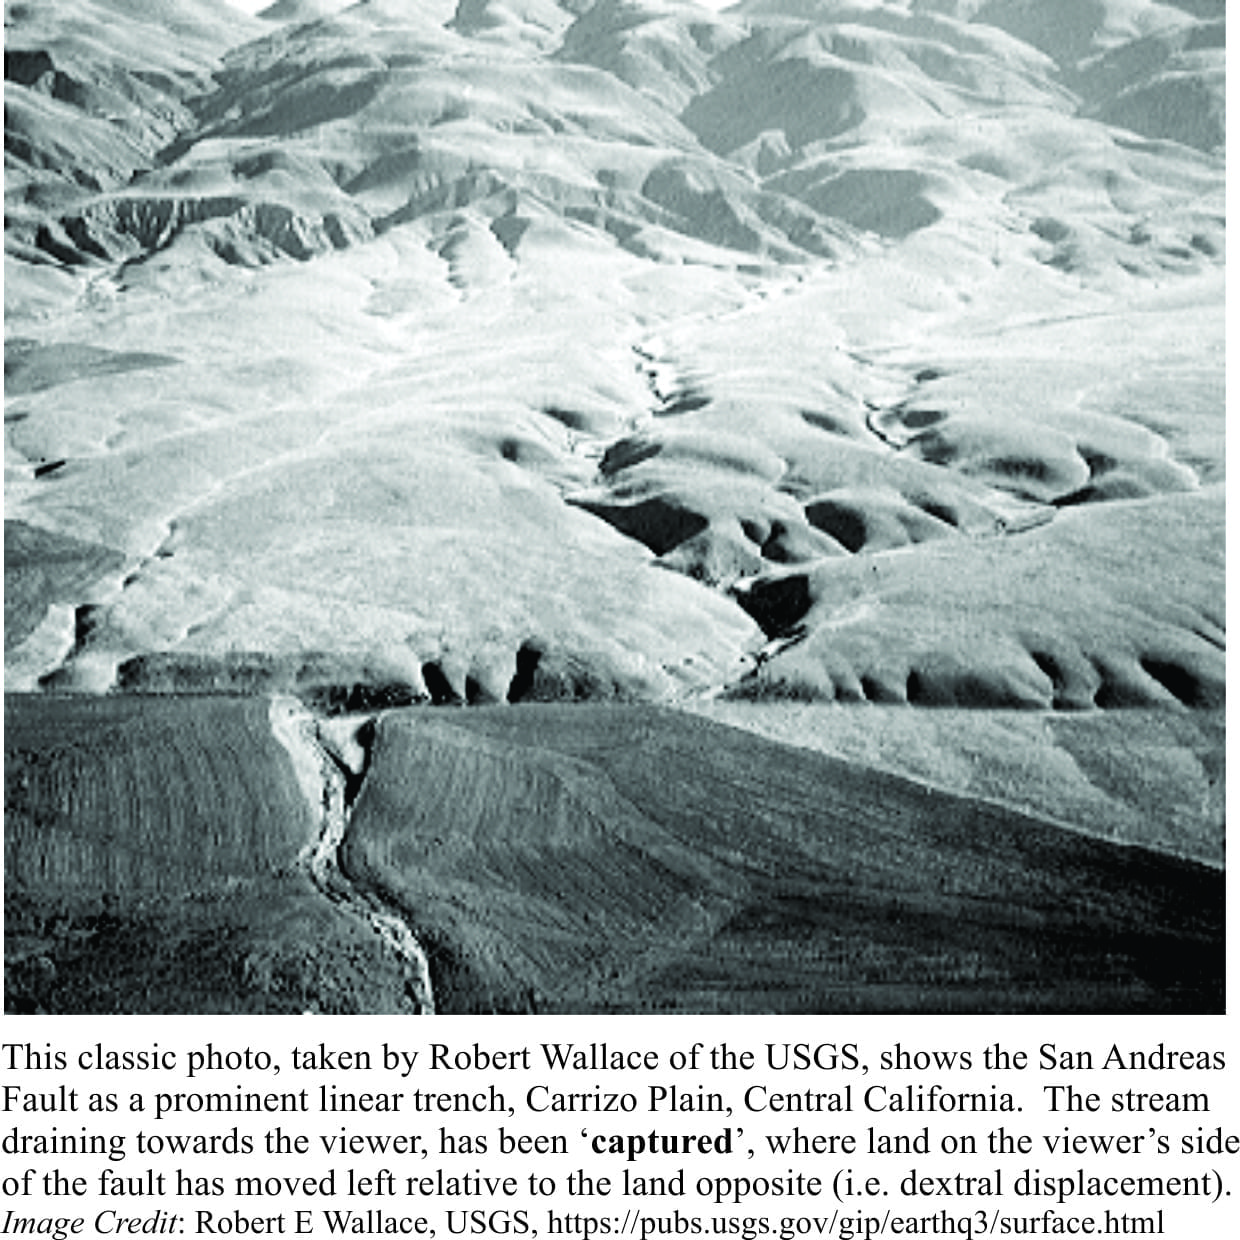
The Alpine Fault is geologically young. The 500-km fault separation of the two geological domains began about 25 million years ago; from a geological perspective, this is really fast – for tectonic plates. The west side of the fault moves northwards relative to the east side; it is referred to as a dextral (right-moving) strike-slip fault. At the same time, stresses acting against the fault have uplifted the landmass; over the last 12 million years, rocks formerly 20-30km deep, were pushed to the surface, forming the Southern Alps. Coincidentally, erosion and glaciation have carved the landmass into the rugged mountain range that extends almost the full length of South Island. Averaged over the last 2 million years, the central part of the Alpine Fault has moved horizontally at a phenomenal 27mm/year, and vertically at 10mm/year. It is thought that this extreme displacement of the earth’s crust is the result of large, M (magnitude)7.5 to M8 earthquakes occurring every 200-400 years, the most recent in 1717AD.
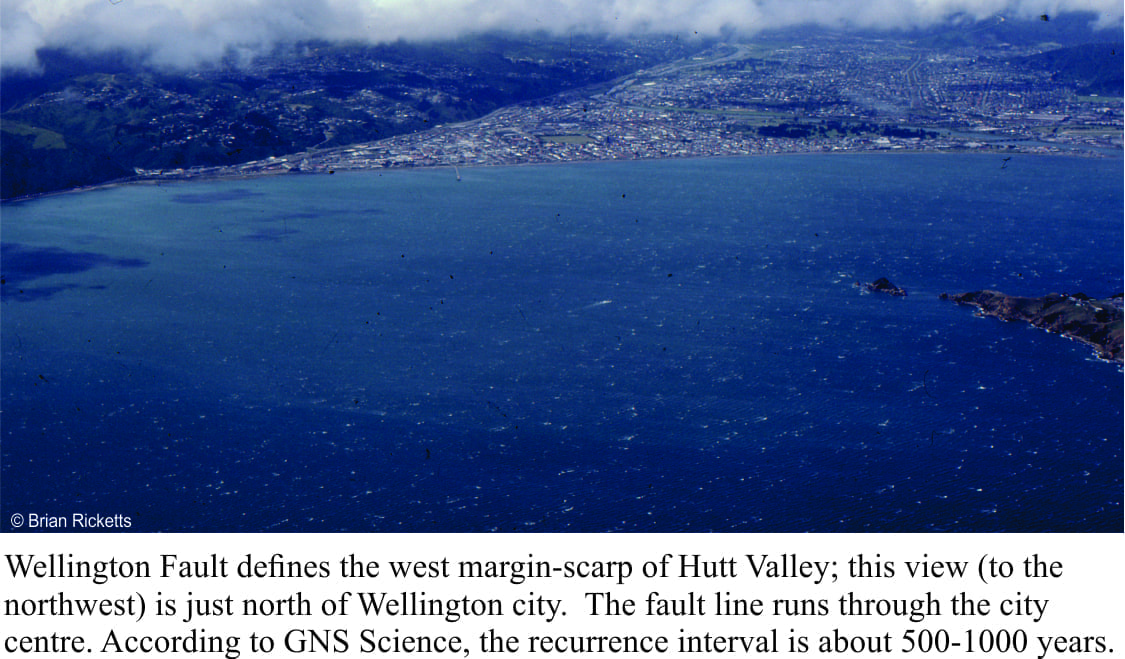
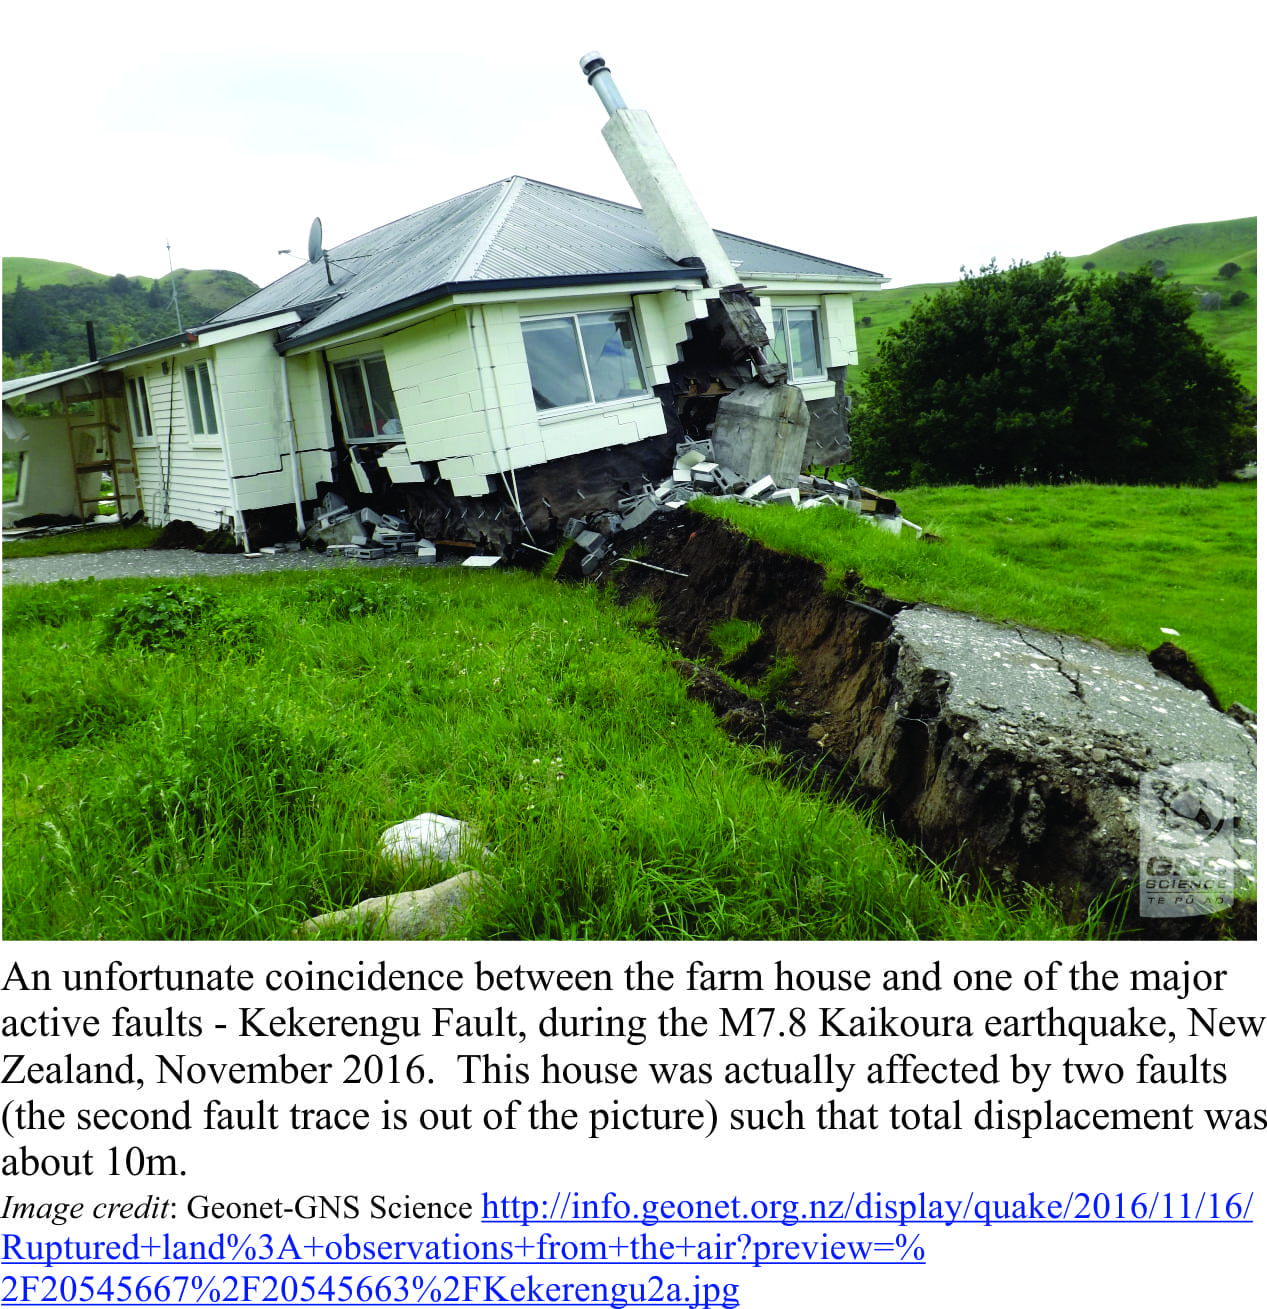
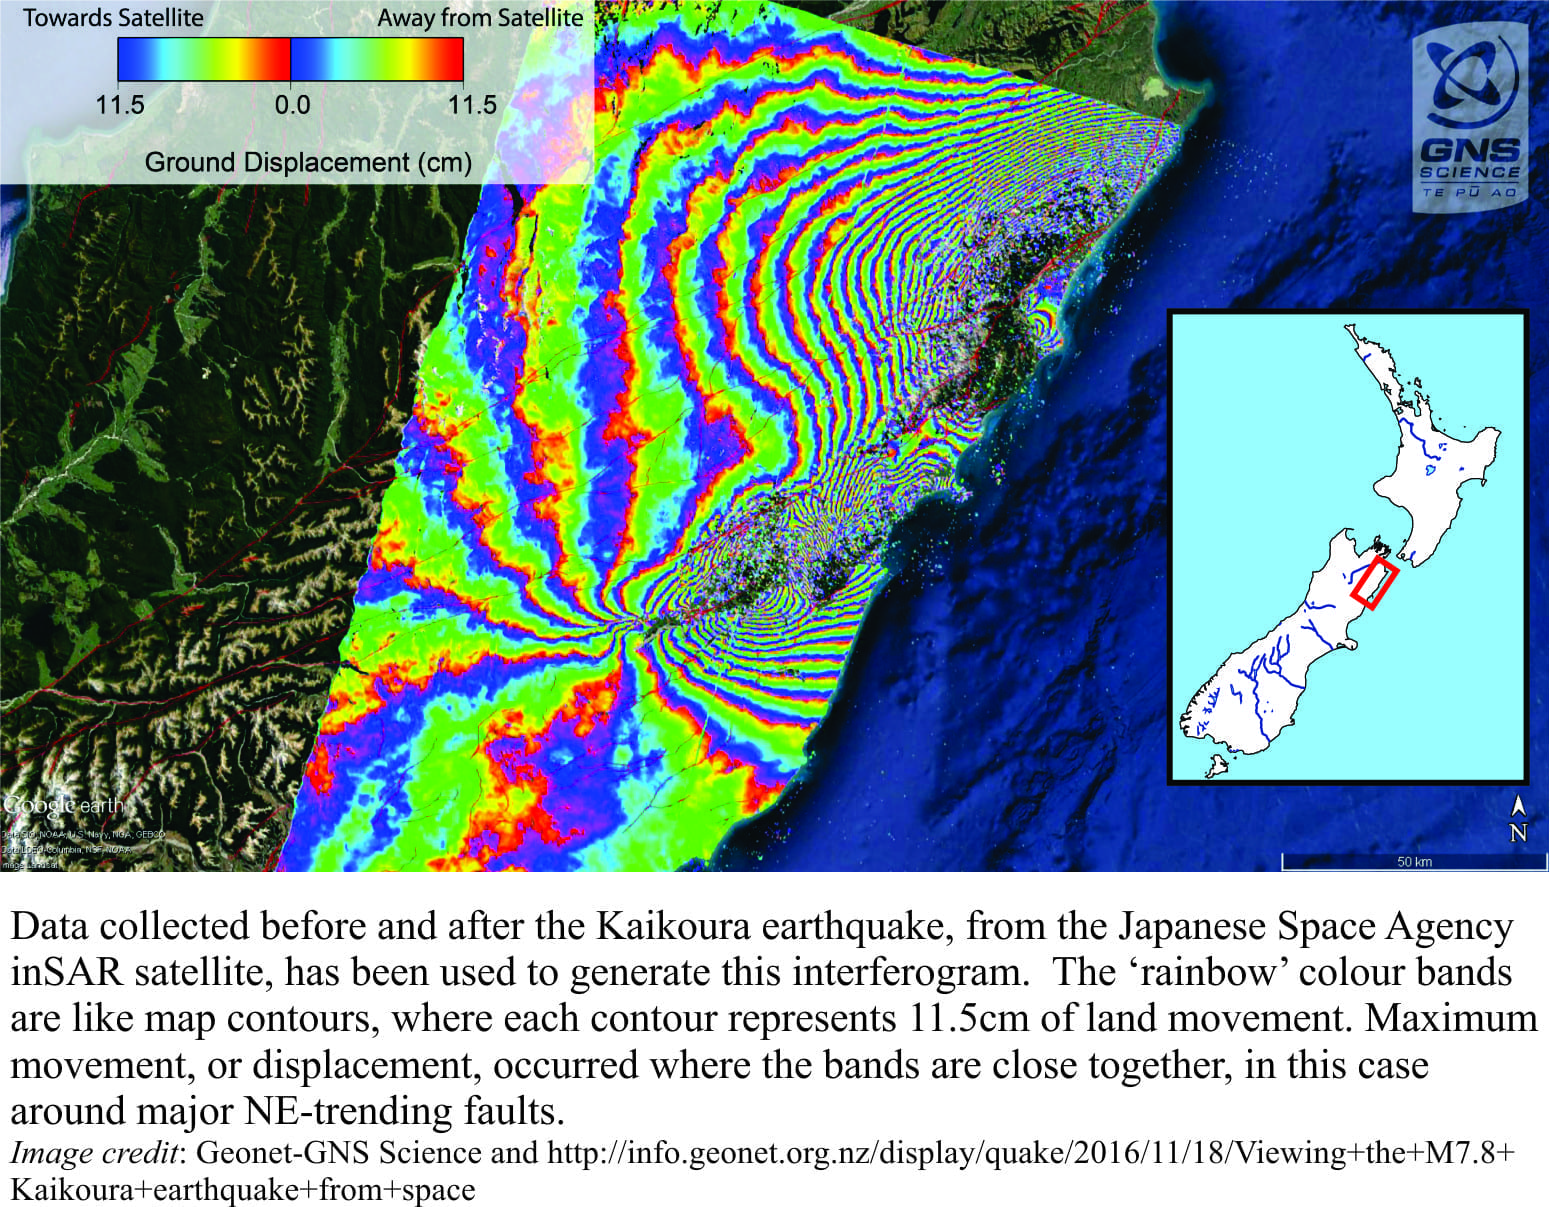
At its northern extent, the Alpine Fault splits into several large, active faults, some heading offshore, others into the southern North Island (the North Island Fault System) and these have been the focus of many destructive earthquakes in the M6 to M8 range. More than 6m of horizontal displacement registered the M7.8 event along Kekerengu Fault in November 2016 (Kaikoura earthquake). On January 23, 1855, up to 18m of horizontal displacement occurred during the Wairarapa Earthquake, estimated to have been M8.2 – M8.3. The epicentre was only a few kilometres south of Wellington city, which suffered significant damage although few fatalities; there was also a tsunami that in places had a 10-11m run-up.
San Andreas Fault is another iconic example of earth’s major fractures, and probably the most intensely studied. It is about 1200km long, and like its New Zealand counterpart, consists of a master fault with many divergent, active and inactive fault strands. It began to move things around about 28 million years ago and has continued to do so ever since, coming to public prominence on April 18,1906 with the San Francisco M7.7 to M7.9 earthquake (and subsequent conflagration); one of the largest events along this fault. Earthquake recurrence intervals vary along the San Andreas fault system; in the southern part it averages about 150 years, but in some fault segments like Big Bend, it may be as low as 100 years.A commonly used method for estimating earthquake recurrence interval is to date young sediments that have accumulated close to faults. Silts and muds that accumulate in river or lake beds will frequently contain peats or fossil soils, layers of woody material, and sometimes volcanic ash; along coasts, beach deposits may be raised by successive earthquakes, and these too may contain shells, wood or bone. These materials can be dated using carbon-14 and other dating techniques. The trick is to find layers that show some disturbance (for example from ground shaking, or displacement by actual faults) and then determine their age. There is always a fair degree of slop in recurrence numbers, a bit like predicting 1-in-500-year flood events (you might end up with 2 events in the space of 12 months!).
Serious earthquakes are a fact of life on transform faults; after all, what do you expect when 10-20 kilometre-thick slabs of rock slide past one another. Recurrence numbers for major events (greater than M6 or M7) may have annoying statistical variation, but they are based on sound science. The sensible lessons learned when someone else’s backyard is reduced to rubble, like – be prepared, or, let’s do more science – are all too quickly forgotten. I guess it’s easier to point fingers after the fact, than to be on constant alert.
J Tuzo Wilson’s 1965 paper A new Class of Faults and their Bearing on Continental Drift was published in Nature, v.207, p.343-347.
Seismic metaphors, or seismic as metaphor? Seismic, a word that geologists and geophysicists traditionally thought was reserved for their use, has been purloined by politicians and social scientists to describe momentous shifts in things like public attitudes and voter propensities. Seismic is the anglicized derivative of the Greek verb seien, (shake) and the word seismos (earthquake). Apparently, it first appeared in English language writing about the mid-19th century. Personally, I find it satisfying that the social milieu sees fit to apply the scientific word in such a useful, metaphorical sense.
The word seismic is also a nice descriptor of our restless, physical world, especially the bits we live on. Most of the earth’s crust is under stress, some parts more than others. Most stresses are generated by the movement and jostling of tectonic plates, particularly at boundaries where plates converge, collide, or slide past one another. Different parts of the crust respond to stress by bending; this includes seemingly hard, immovable rock. If the stress is removed then the deformed rocks return to their original states; this is referred to as an elastic response. However, if the earth materials are bent too far or too fast, they will break. An interesting analogue for this process, and a historical one, is the collapse of a Tacoma suspension bridge in 1940.
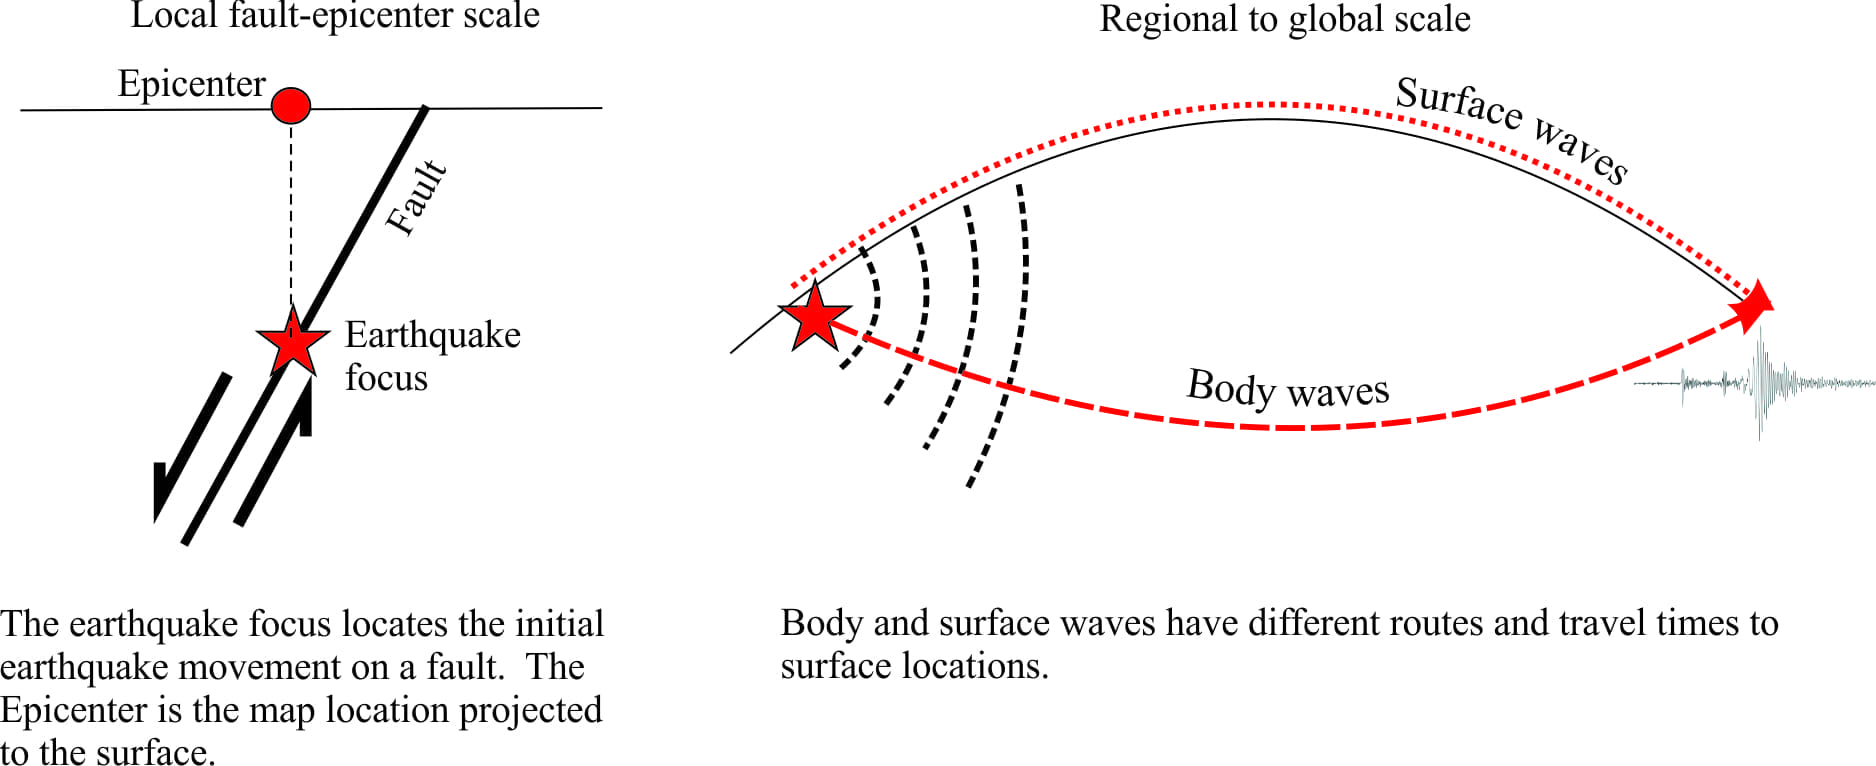
Here, steel girders and tarmac bent and twisted under stress until the deformation reached a limit (called the elastic limit), at which point the bridge failed. When the earth’s crust fails, the seismic event, or earthquake, can be devastating. Earthquakes are caused by the sudden brittle failure of rock under stress; the failure takes place along a fault, across which land (or sea floor) is moved up, down, or sideways. The rapid displacement of rock masses produces pulses of energy, or seismic waves. It is these waves that do the damage.
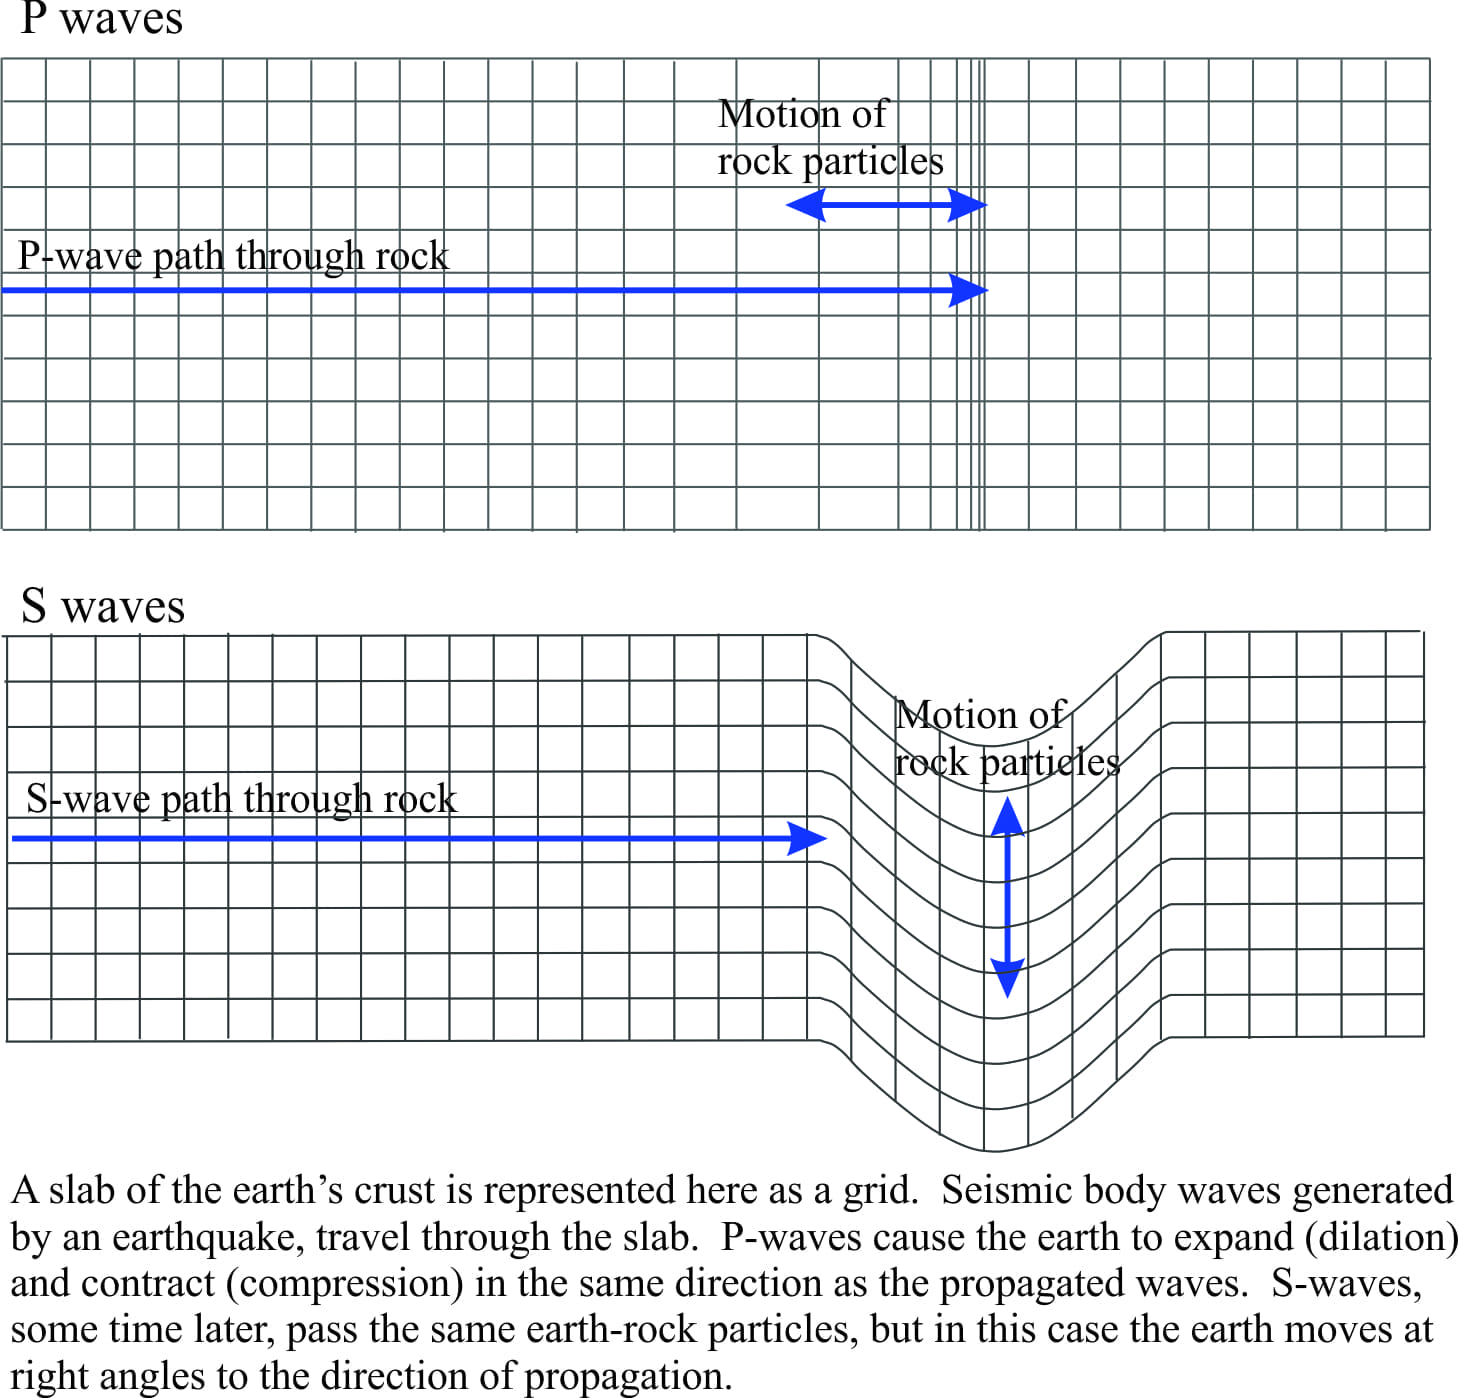
There are two main kinds of seismic wave; body waves that propagate through the earth’s interior, and surface waves that move along the earth’s surface. Body waves include a primary, or P-wave, and a secondary or S-wave. P-waves travel fastest; they are also called compressional waves because they tend to push and pull materials as they propagate. Slower S-waves, or shear waves, produce a side-ways motion. Shear waves are not transmitted through fluids such as sea water, or the molten interior of the earth. The cartoon below illustrates how the earth reacts to these two wave types. Surface waves are the slowest to propagate but they are also the seismic pulses that do most of the damage during an earthquake. The animation shows the earth motion for one kind of surface wave;
Rayleigh Waves. Rayleigh Waves produce a circular, or orbital motion of earth materials at the surface, a bit like particle motion beneath sea waves.
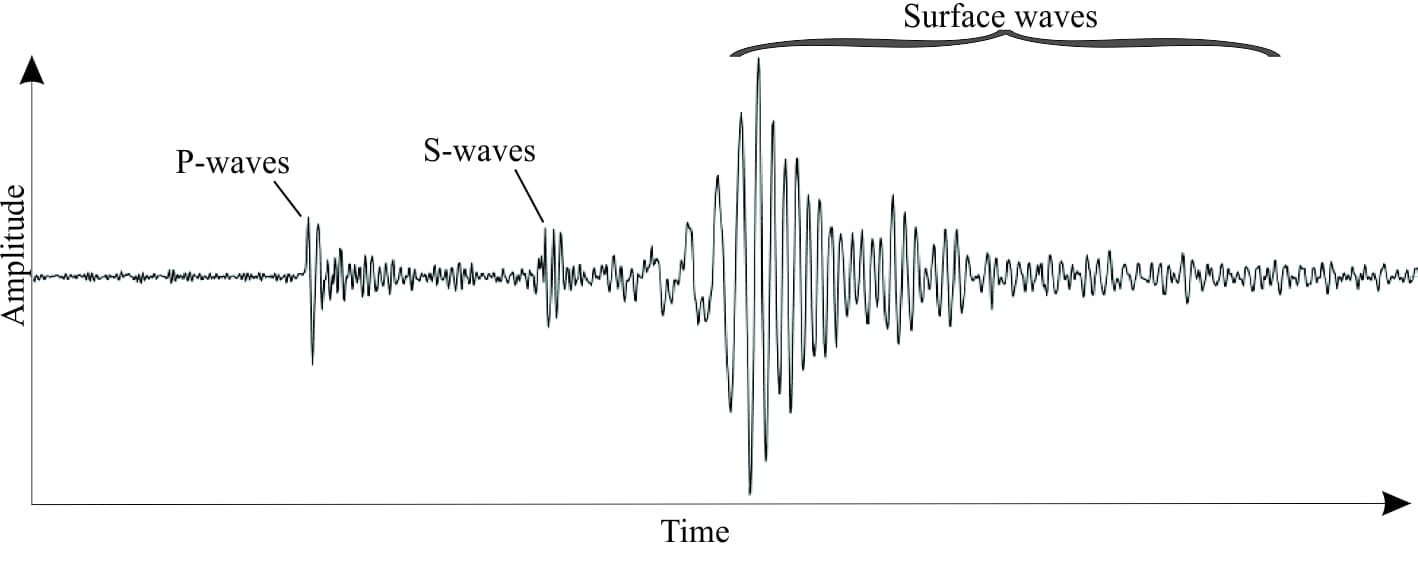
Each type of seismic wave is identified by the speed at which it moves, and the kind of movement that sediment and rock are subjected to. These differences are expressed on seismograph recorders. On a typical seismogram (below), P-waves arrive first, followed by S-waves. S-waves tend to have lower frequencies than P-waves (more spread out on the graph), but higher amplitude. Surface waves usually have the highest amplitude.
Earthquake magnitude (M) reflects the severity of ground roll and shaking, and on seismograms corresponds to the amplitude of the signal (usually of surface waves). M is expressed as a number (M1.8, M4.6, M7.8) up to a maximum of 10 (10 might be caused by a large meteorite impact – when there isn’t much left). The numbers, and therefore the magnitude scale, are logarithmic, such that a magnitude of 4 (104) is 10 times smaller than M5 (105), and 100 times smaller than M6 (106). We can also think of the changes in magnitude in terms of the energy released during a quake. It has been determined, (as an approximate empirical relationship) that for every unit increase in magnitude, there is a 27.5-fold increase in energy. The difference in energy is also logarithmic, such that an M8 event releases 571,914 times more energy than an M4 event (the magnitude is 10,000 times greater). These kinds of numbers demand a degree of respect for the twists and turns our earth can throw at us.
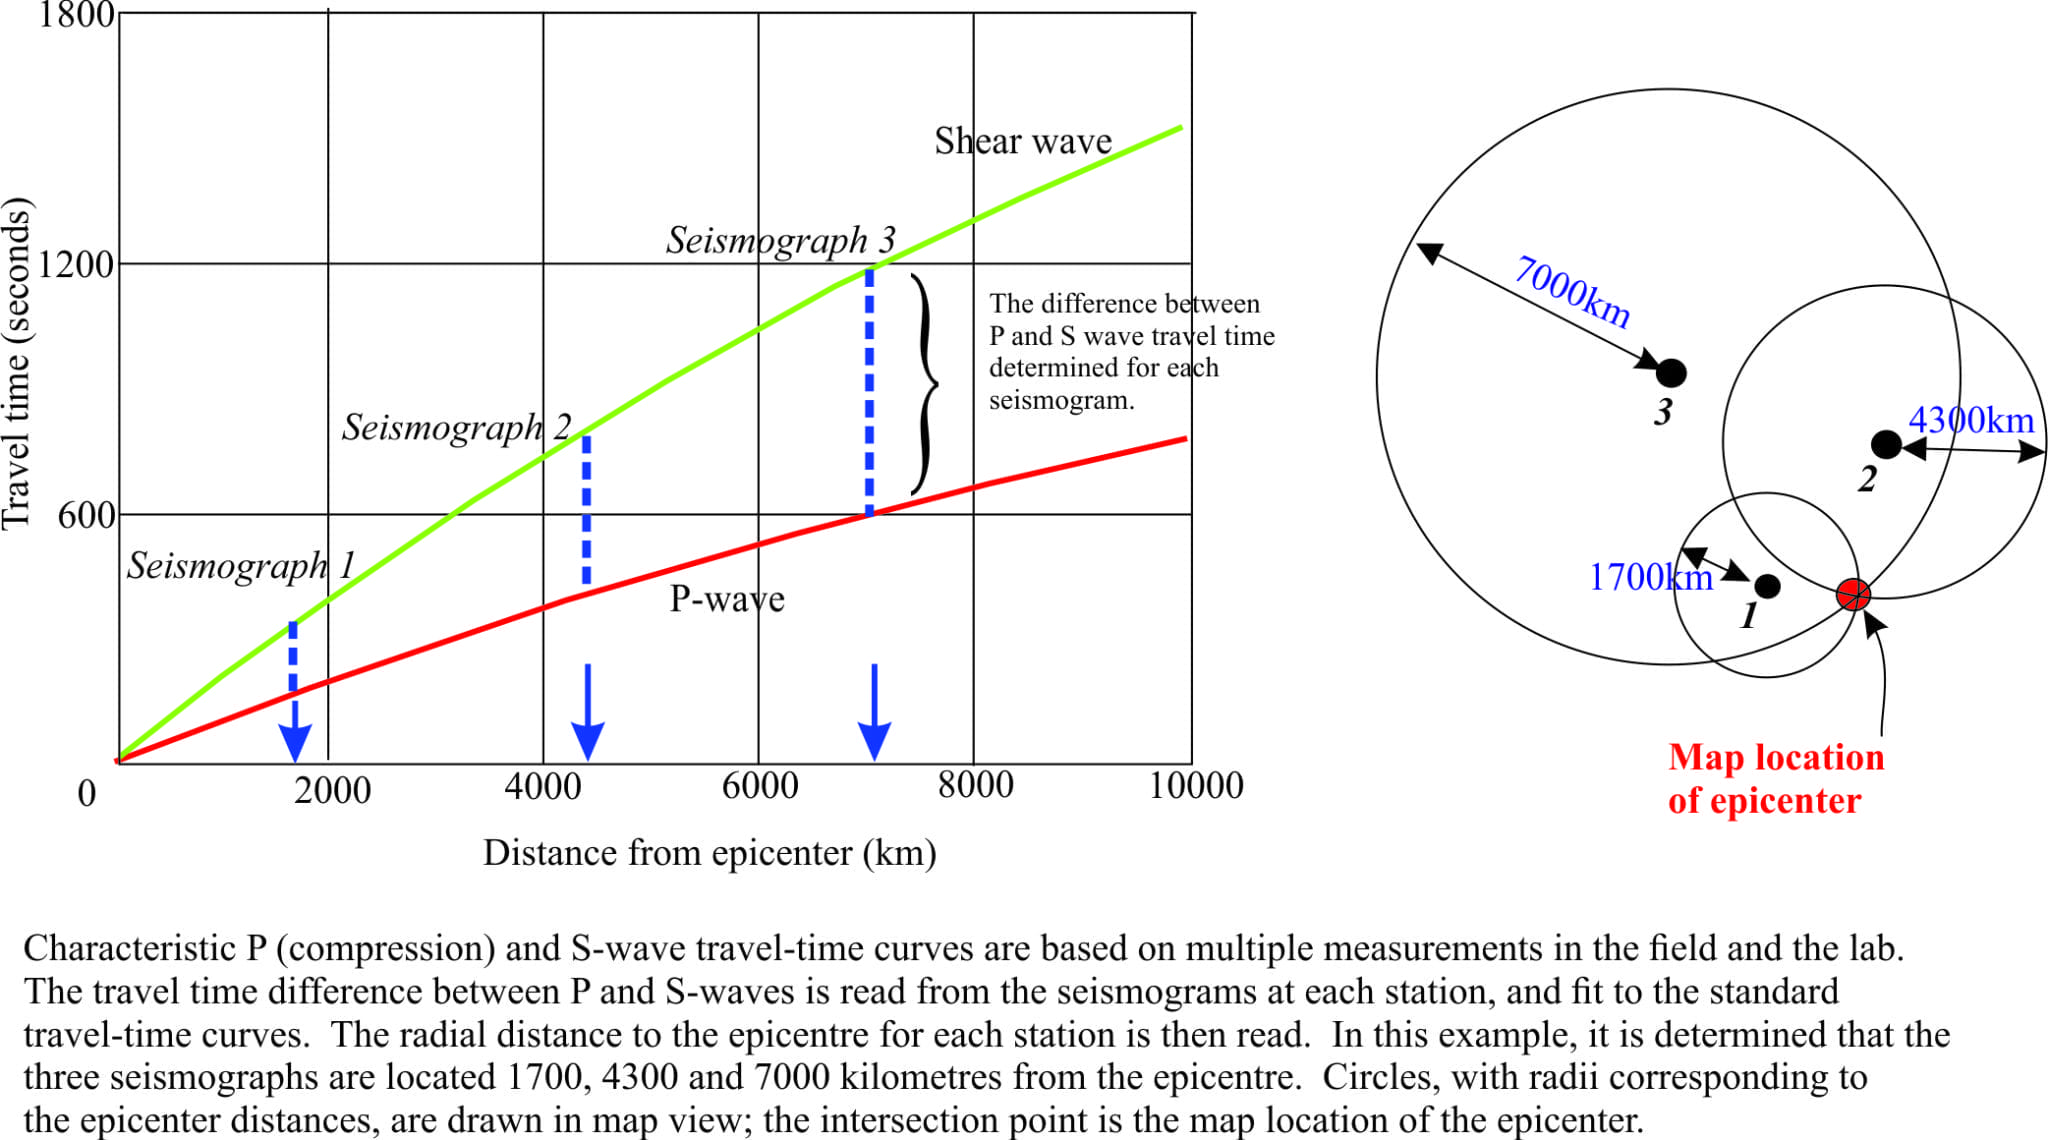
Seismograms also help seismologists determine the Epicenter of an earthquake; the epicenter is the map location rather than the actual location, or focus, at depth. The calculation makes use of the fact that P-waves are faster than S-waves, so that the distance to an epicentre is based on the difference in arrival times for each type of wave. Distance in this case is the radius of a circle centered on the seismograph location. To triangulate the epicentre, at least two more seismographs in different locations are needed – in reality there can be hundreds of seismographs that allow the calculation. If circles are drawn about each seismograph, each with a different radius, they will intersect at the epicentre. Variations in the structure of the earth mean that seismic wave velocities can vary, so that the circles may not all intersect at a single point. However, the large number of seismographs around the world means that location of the epicentre is usually accurate.
The November 14, 2016 earthquake in Kaikoura, New Zealand was a M7.8 event. We live about 500km north of the epicentre. Almost on the stroke of midnight we felt definite shaking (P-waves). A few seconds later the shaking increased significantly. At this point trees were swaying and water was slopping over the edge of the pool; this was due to ground roll from the slower surface waves. Other than an adrenaline rush, there was no damage for us; farther south it was a very different story. One spectacular outcome was the abrupt, lateral 6m shift along part of the New Zealand coastline; the same coast was also uplifted 1-2m.
I’ve always thought that New Zealand is a great place to witness geology in action. But sometimes it can go a bit too far.
An excellent technical paper on the Kaikoura event by Ian Hamling (GNS Science) and a host of co-authors, has been published inScience, March 26, 2017.
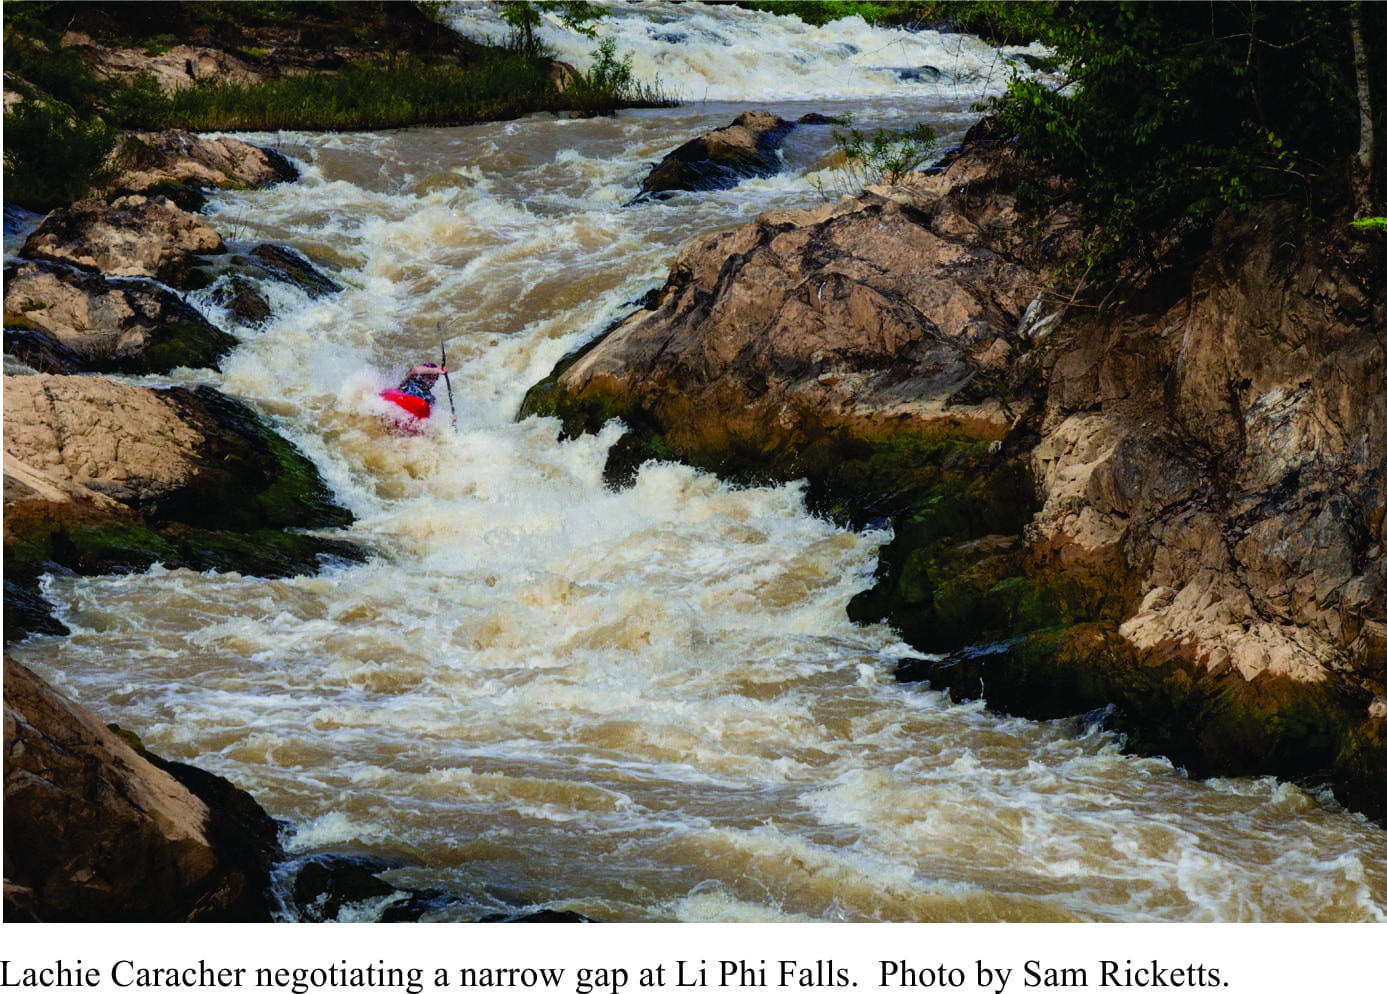
I am of a generation that, at mention of Laos, Vietnam and Cambodia, I recall images of intense conflict, thankfully long past. The images now are of jungle, peaceful villages nestled among ancient civilizations, and rivers; kayaks instead of gunboats. The coincidence between geology and river in Southern Laos (LDR) has created an area known as 4000 Islands. Here, Mekong River changes from a single channel to multiple braids that thunder across a spectacular array of waterfalls and rapids; a white-water kayaker’s idea of fun. Sam Ricketts, his friend Lachie Carracher and a film crew (Luke McKinney and Lissa Hufford), converged, in December 2016,pon Don Det, an island-town in the middle of 4000 Islands; their focus – Li Phi Falls. Continue reading →