Monitoring groundwater from space
You could be excused for labeling this title conspiratorial, the brutal reality encapsulated in Alan Parsons prog rock group’s signature song or a Helen Mirren thriller. And if that is your inclination, don’t bother reading any further because this post deals with far more mundane uses of remotely sensed data. The data sets are generated by two groups of satellites that measure very different attributes of the earth, gravity and light spectra. Teasing the data has given us multiple stories of how systems like surface and groundwater are responding to human activities and natural processes. Some of these stories make grim reading.
GRACE
GRACE (Gravity Recovery and Climate Experiment) makes use of the fact that earth’s gravity depends on the distribution of mass, primarily rock and water (including ice).
Over short periods of time (years, decades), the distribution of rock mass remains constant; geological changes generally take 10s of thousands to millions of years. However, the distribution, or redistribution of water can take place much more rapidly. GRACE data permits us to look at such changes on the scale of decades.
The GRACE experiment is a joint venture between NASA and the German Forschungsanstalt für Luft und Raumfahrt.
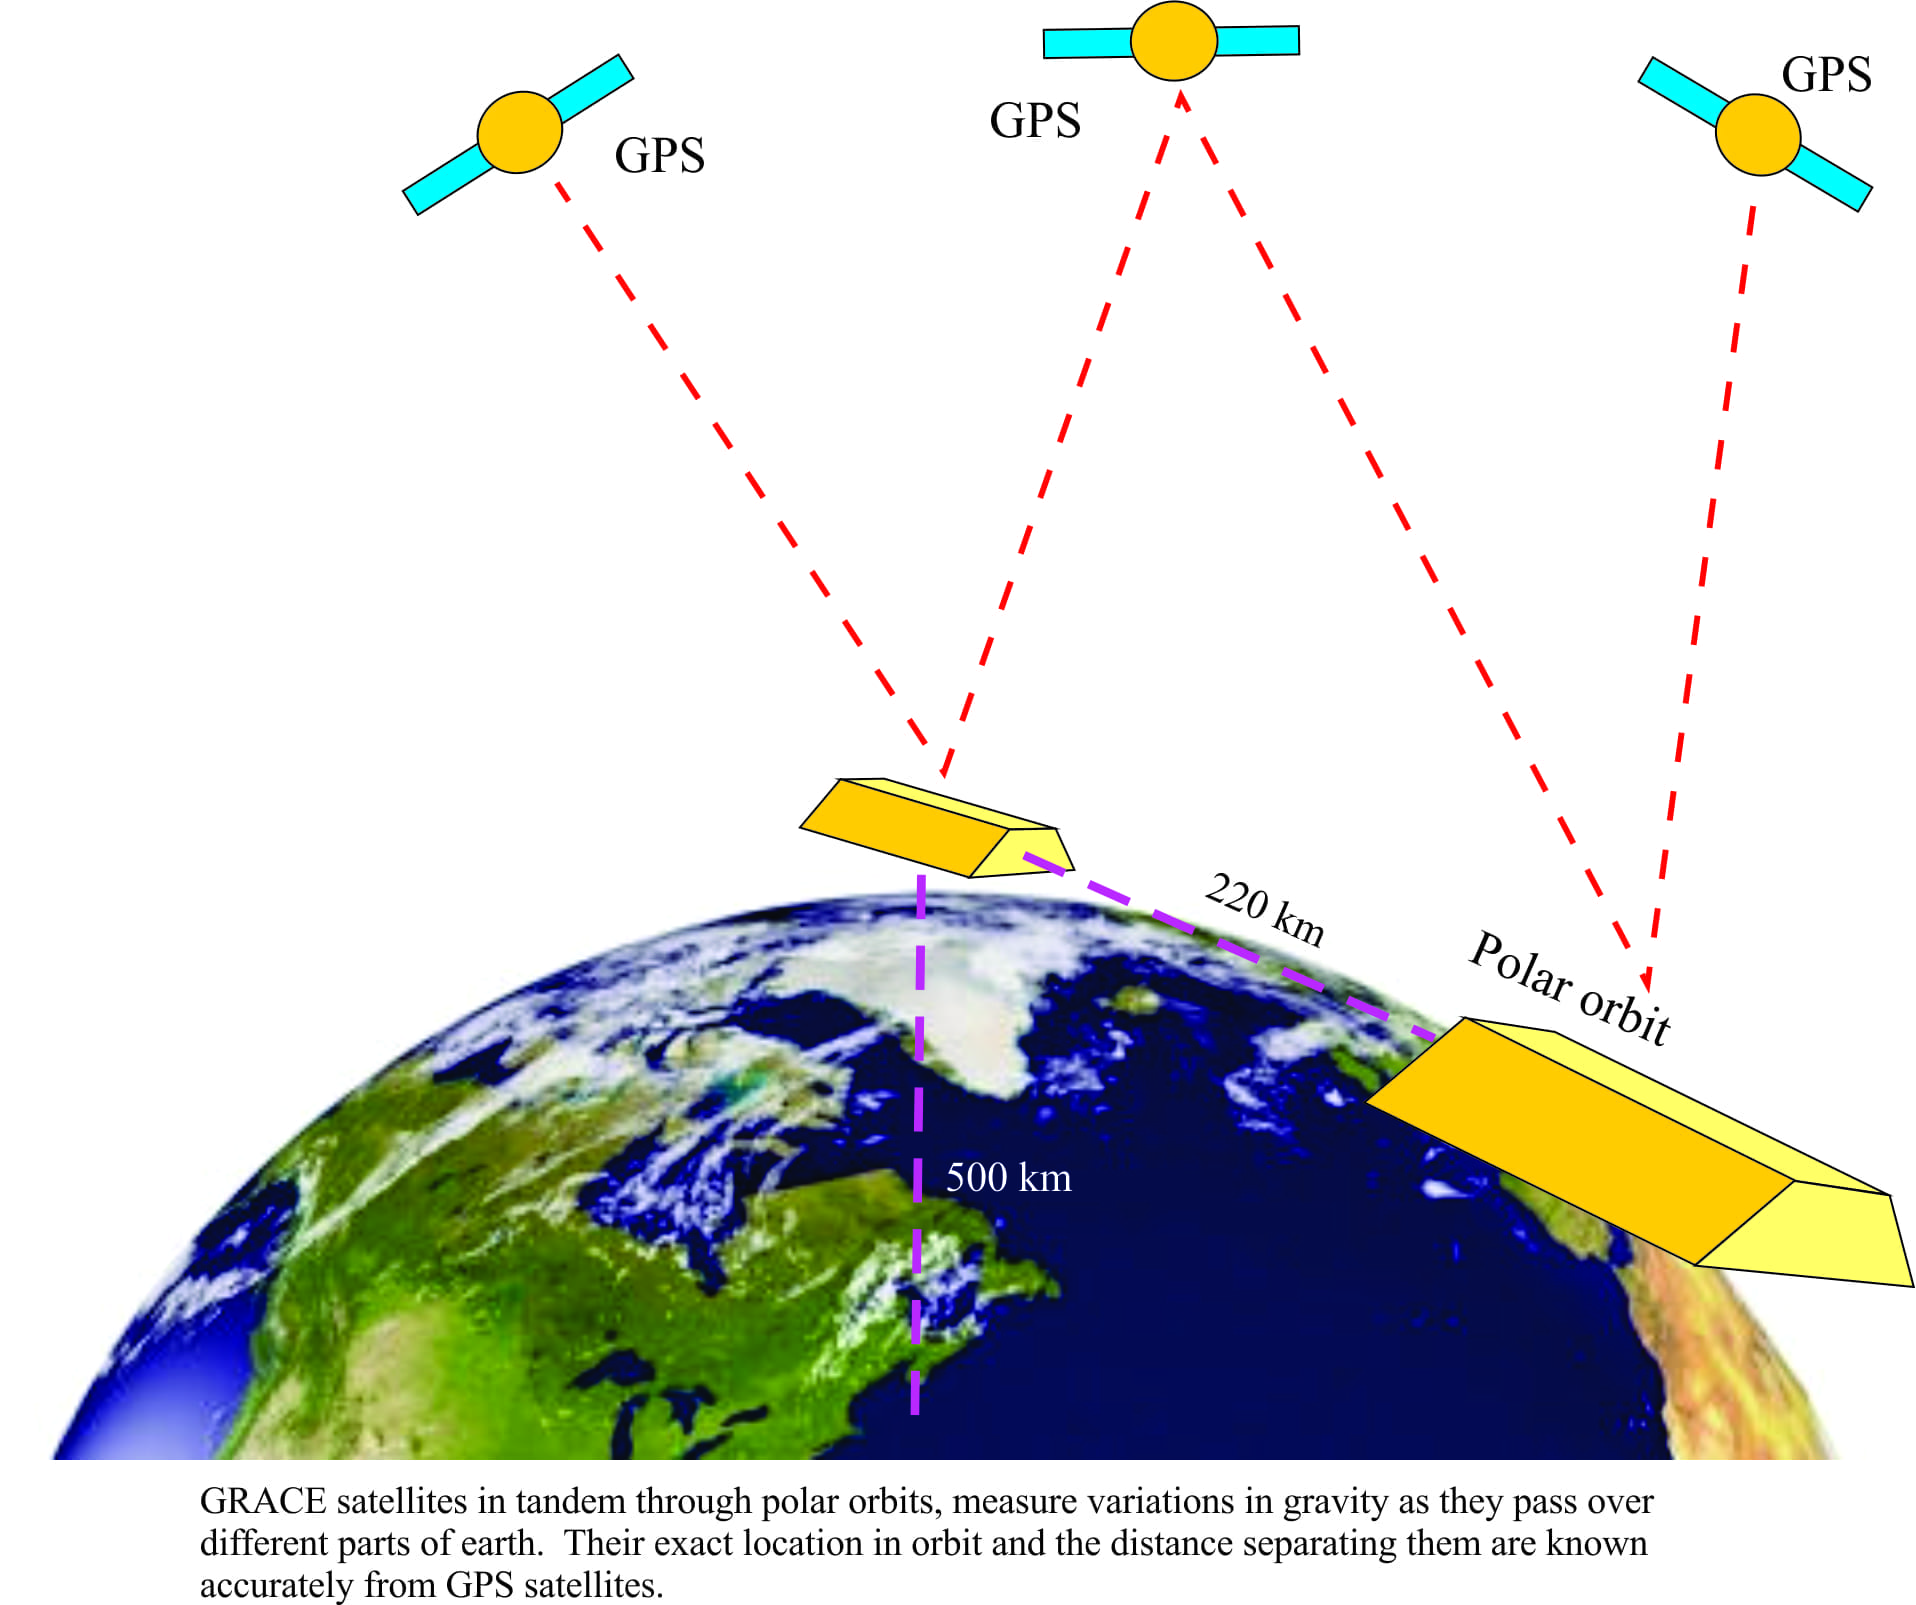
Two satellites, launched in 2002 from the Plesetsk Cosmodrome in Russia, have identical polar orbits. They orbit the earth in tandem, 220km apart and 500km above the earth. During orbit the satellites are influenced by variations in gravity which result in small changes in velocity. For example, the lead satellite may speed up or slow down with respect to the trailing satellite, depending on whether the gravity increases or decreases through a particular segment of the orbital path (the satellites are basically playing catch-up). The change in distance between the satellites is measured (to within one centimetre – it’s very accurate). Thus, if the gravitational force over some area also changes with time then this will be reflected in the series of distance measurements.
At any location, most of the yearly to decadal changes in gravity are attributed to the redistribution of water. Years or decades of groundwater withdrawal lead to significant decline in watertables; the Great Valley of California and High Plains aquifer are good examples where groundwater is used mostly for irrigation where it is either taken up by plants or lost to evaporation. Over decades there is a substantial change in the mass of water in the aquifers and this results in small, but measurable changes in gravity. Likewise, ocean masses will change when water is gained or lost to ice, or when the density stratification of ocean water masses changes.
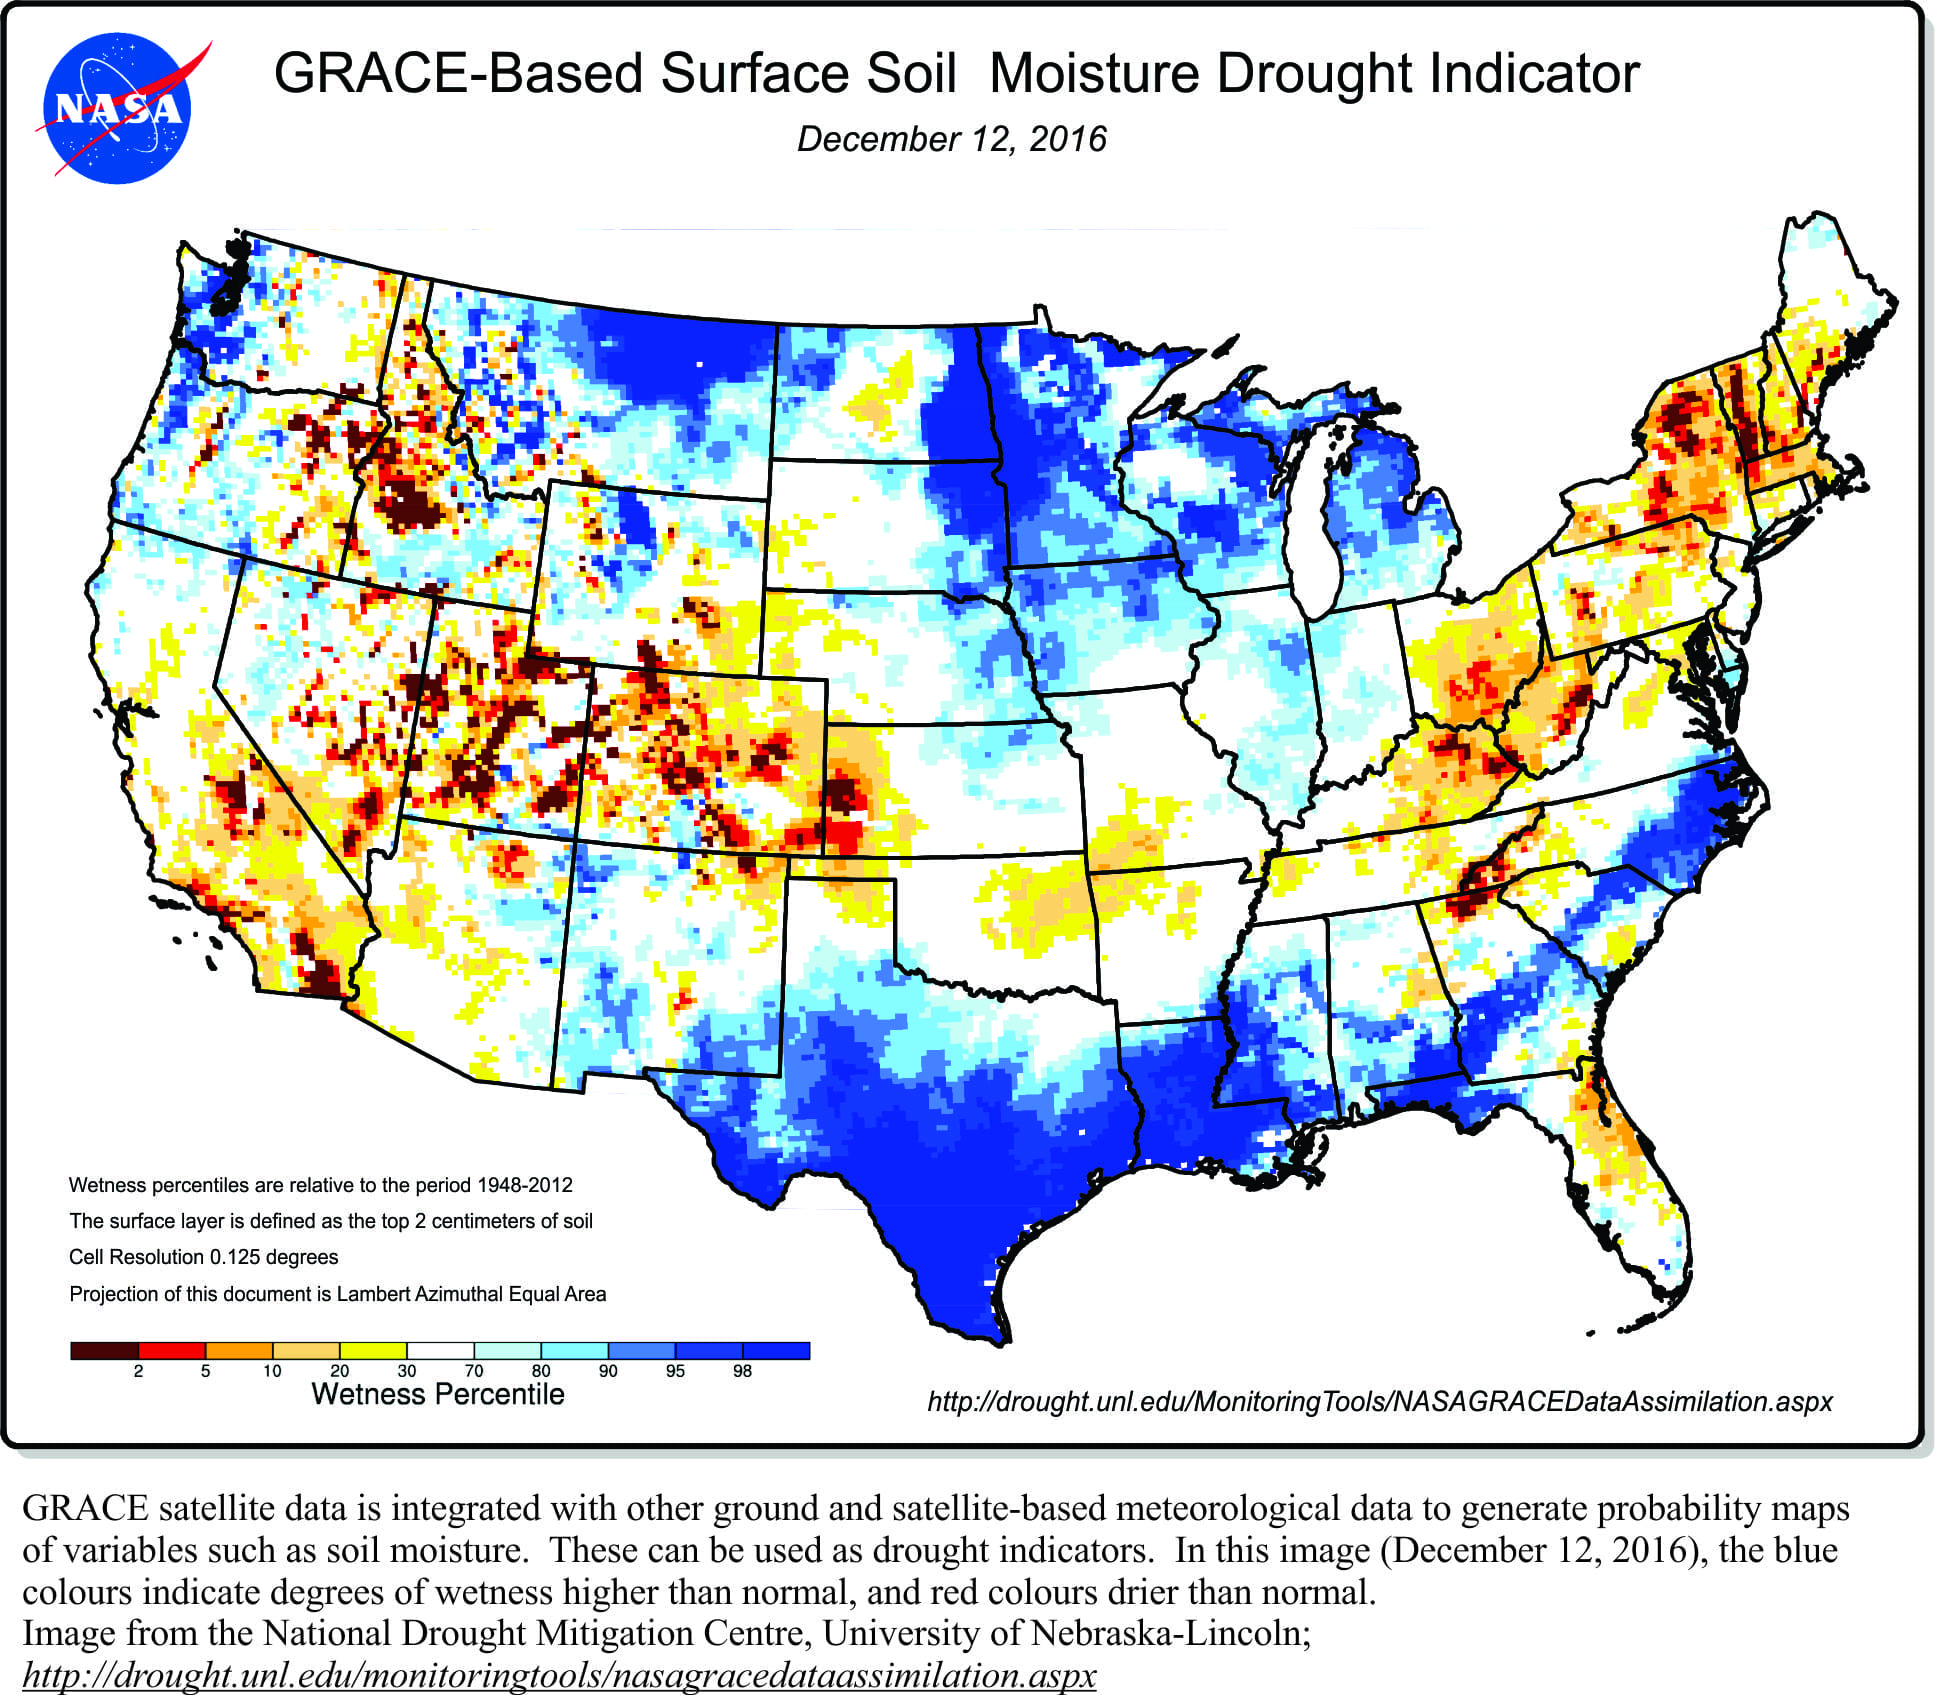
The spatial resolution of GRACE data is about 150,000 sq. km. which means that analysis of water storage budgets applies to broad regions, such as aquifers of regional significance. When combined with other ground and satellite meteorological data, the analyses can also be used to map changes in soil moisture which is particularly useful for monitoring changes in drought-affected regions
Analysis of aquifer stress (from overuse and/or changes in groundwater recharge) has, in one scenario shown that one third of regional aquifers globally are significantly over stressed, not surprisingly those in North Africa, Middle East, China and central-west USA. However, there are also cautionary tales as groundwater depletion modelling of this kind is continually refined, illustrating the need to incorporate all sources of water such as soil moisture, reservoir-lake-river storage, wetlands, and vegetation.
Regardless, the GRACE experiment has enabled researchers to look at water addition-subtraction, resource and risk, on a scale not possible using only ground-based data.
LANDSAT
LANDSAT was first launched in 1972. There have been 7 successful LANDSAT vehicles including the last launch in 2013, their primary role being to collect remotely sensed data at various spectral (light) frequencies. Over the years, the satellites have recorded data to compile millions of digital images.
Scientists from the European Commission Joint Research Centre recently partnered with Google to create interactive digital maps that show quantitative changes in surface water over the period 1984-2015. This massive effort used more than 3 million images that were analysed by 10,000 computers to produce a set of global maps at 30m horizontal resolution.
The technical paper describing the new dataset was published in Nature, December 7, 2016.
Choose a location and select from various options to show, for example, total surface water over the 32-year period, or changes in water such as permanent gain or loss. The maps (and accompanying data) provide a wealth of information about surface processes, changes in water availability, changes in seasonality, or the potential positive/adverse effects of human activity on surface water systems (rivers, lakes, diversion canals etc.). The maps can be enhanced by integration with satellite derived radar or more accurate altimetry data, and for more regional views, integration with GRACE data.
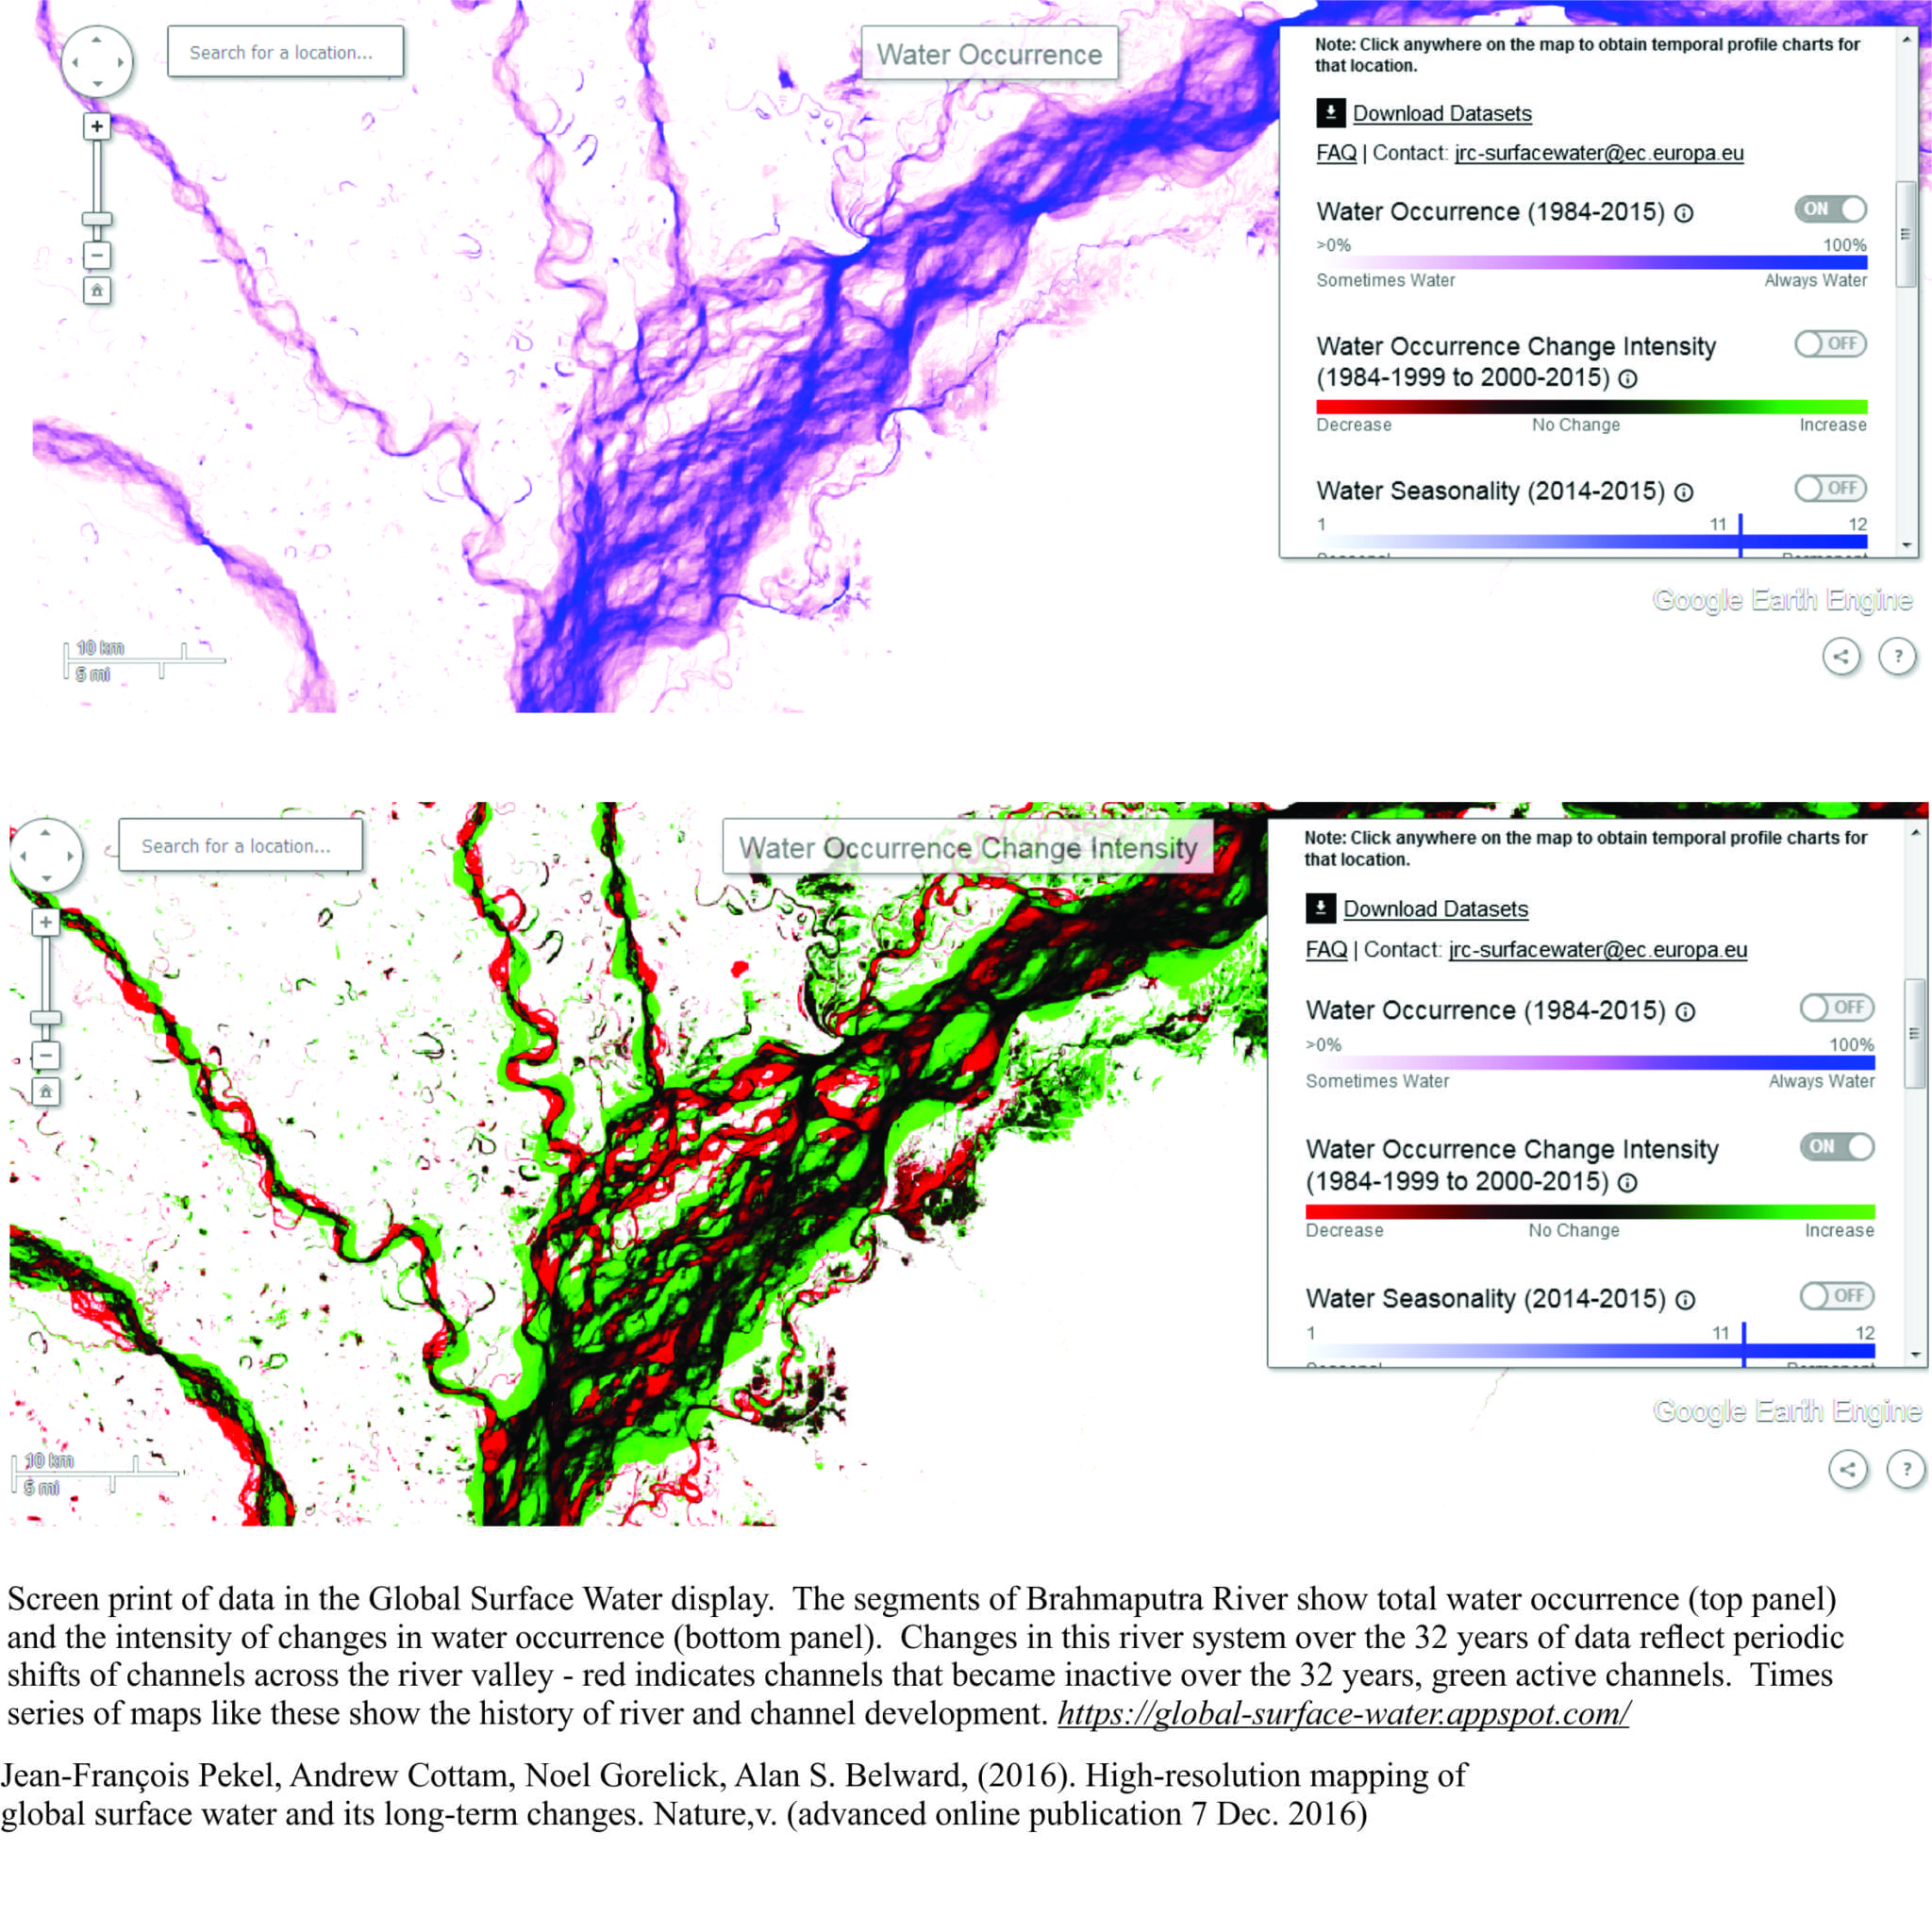
Shown below are screen prints of two examples from the interactive app. Those of the Brahmaputra River show the natural change in active river channels, where they abandon one location and move to another, sometimes abruptly, sometimes gradually. The second image of Aral Sea shows, in stark colour, those areas that have permanently lost water because of river diversion (for irrigation) in the 1960s.
Comment
We tend to take satellite data for granted – weather, communications, science research, defence, and perhaps for some of the more conspiratorial reasons. The GRACE and LANDSAT data sets are just two of many different types of satellite, or remotely generated data that are opening new avenues for activities like landslide detection and weather forecasting, or detection of long-term trends in various earth processes. When LANDSAT was launched, I doubt that many onlookers could have predicted the kind of web-based interactive map now available to anyone with a mobile phone. I for one, look forward to even more (peaceful) innovation that enables science to move ahead, solve old problems, and ask new questions.
Anyone can access the maps and data on the EU Commission’s interactive site.
Addendum
An article published in Nature, June 14 2018, evaluates GRACE ice mass data from Antarctica that, alarmingly, indicates a trippling of ice loss between 2012 and 2017, that would have contributed an average sea level rise of 7.6mm, more than twice the generally accepted rate.