
 Flood, fire, drought … We have, by luck and muddled management, thwarted pestilence, but it seems that changing weather patterns everywhere are leading us on a merry dance. Our climate is giving us a bumpy ride; anyone living in the Caribbean and southeast US, or Bangladesh, will attest to this, given the havoc that hurricanes and tropical cyclones have wrought over the past few months (northern hemisphere summer, 2017). The skinny, outer layers of our world (air and oceans) seem to be getting warmer. No doubt there are consequences?
It may seem paradoxical, but global warming is taking place against a backdrop of global cooling. Forcing of global climates is governed by internal (within our own skinny sphere) and external agents; the latter by solar output and earth’s changing orbit. There is now, good scientific evidence to show that global climate responds to long-term changes in earth orbit. Earth does not revolve around the sun in nice uniform paths, but wobbles, deaks, and turns on time-scales that range from the geologically brief (about 22,000 years) to 100,000 years. These Milankovitch cycles refer to precession (wobbles about the earth axis, 19,000-22,000 years), obliquity (changing tilt of earth’s axis, 41,000), and eccentricity (changing orbit around the sun, 100,000 years) (an earlier post describes these cycles).
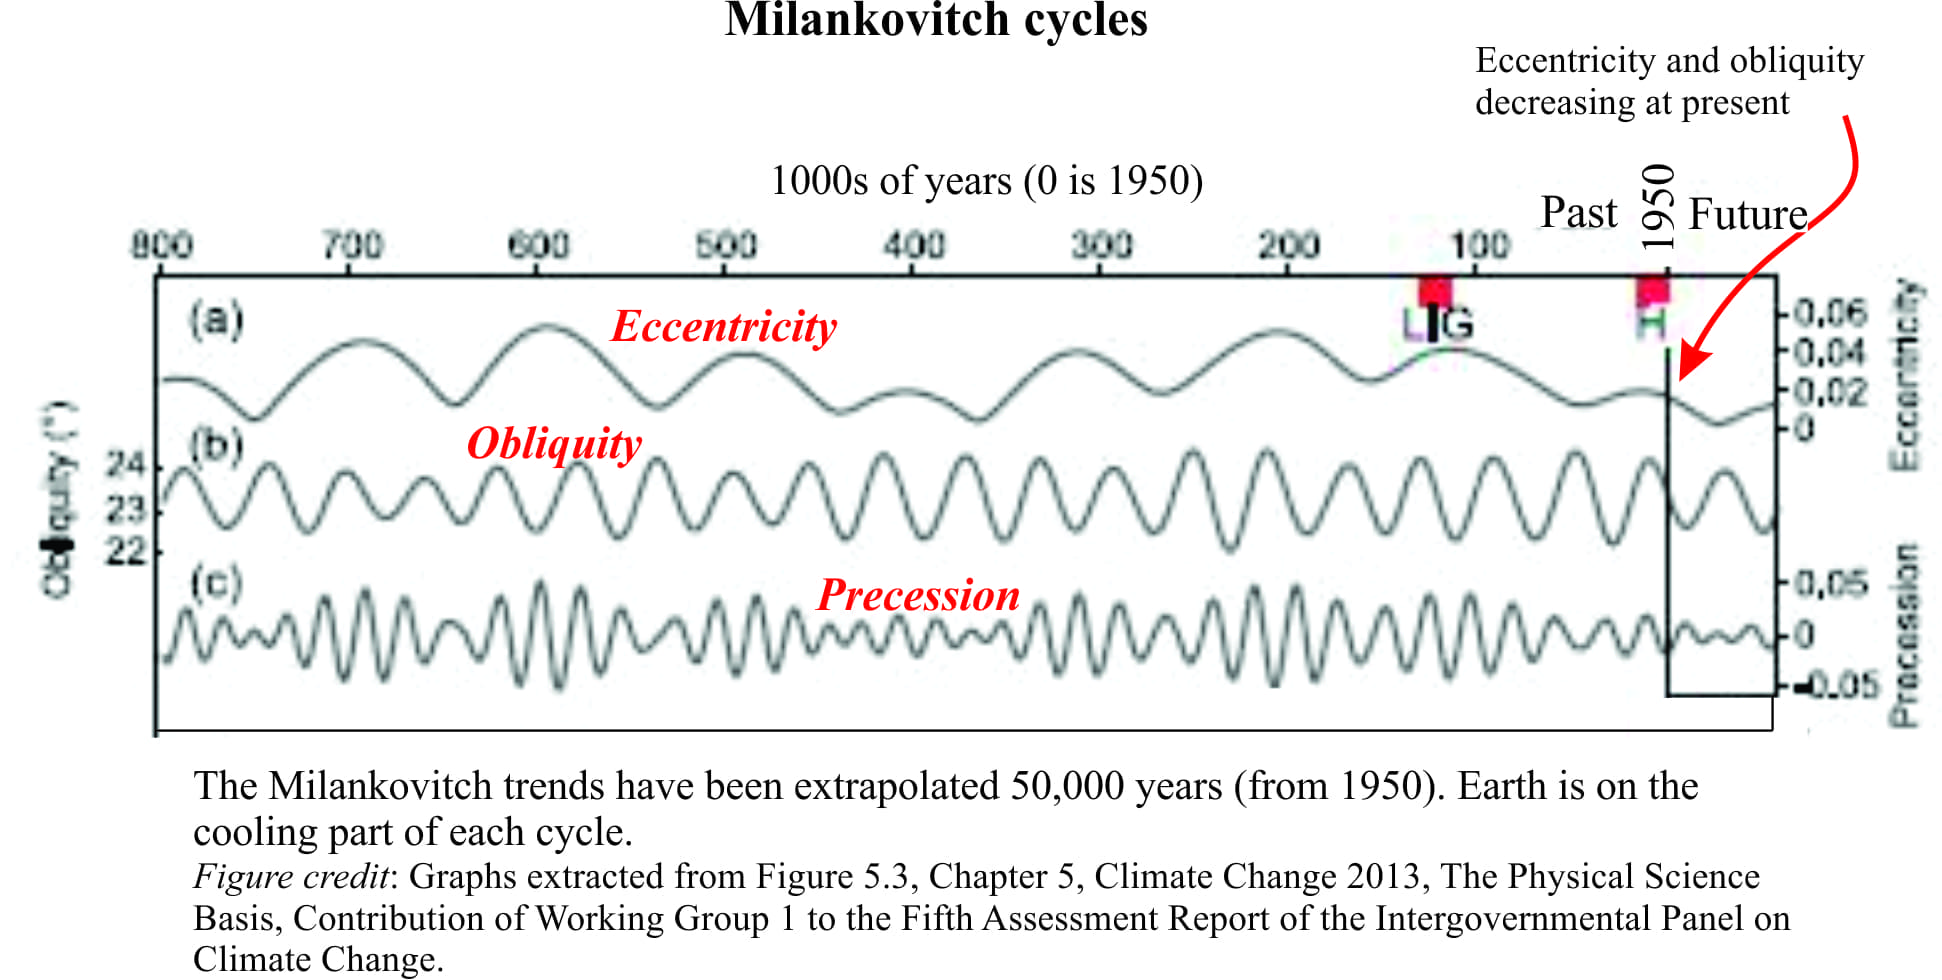
The graph above shows typical cycle trends for each kind of astronomical forcing. For each cycle, the downward, or decreasing values correspond to global cooling trends that, in the 100,000 year cycles, appear to culminate in glaciations; there is some dispute whether these long-term cycles or the 41,000 year obliquity cycles are more important as climate enforcers. The mathematical elegance of these curve constructions means that we can predict cooling and warming trends into the future, and in the example shown, this has been done for the next 50,000 years. Earth is currently on the cooling side of each curve – but there is no need to panic; the time-frame here is in thousands of years. Nevertheless, the predicted trends provide a useful context in which to frame the current vagaries of climate.
Climate forcing, or climate change also depends on the energy received directly from the sun, independent of variations in the orbit; i.e. variations in the sun’s output. Sun spot, or Solar Cycles at about 11 year intervals (formally known as Schwabe Cycles, after Heinrich Schwabe in 1843), account for variations in normal solar output of about 0.07%, or about 1 watt per square metre at the surface (equivalent to the output of a very small light bulb). Schwabe cycles represent the waxing (solar maxima) and waning (solar minima) of sunspots. Sunspot cycle counting began in 1755; we are currently in Cycle 24.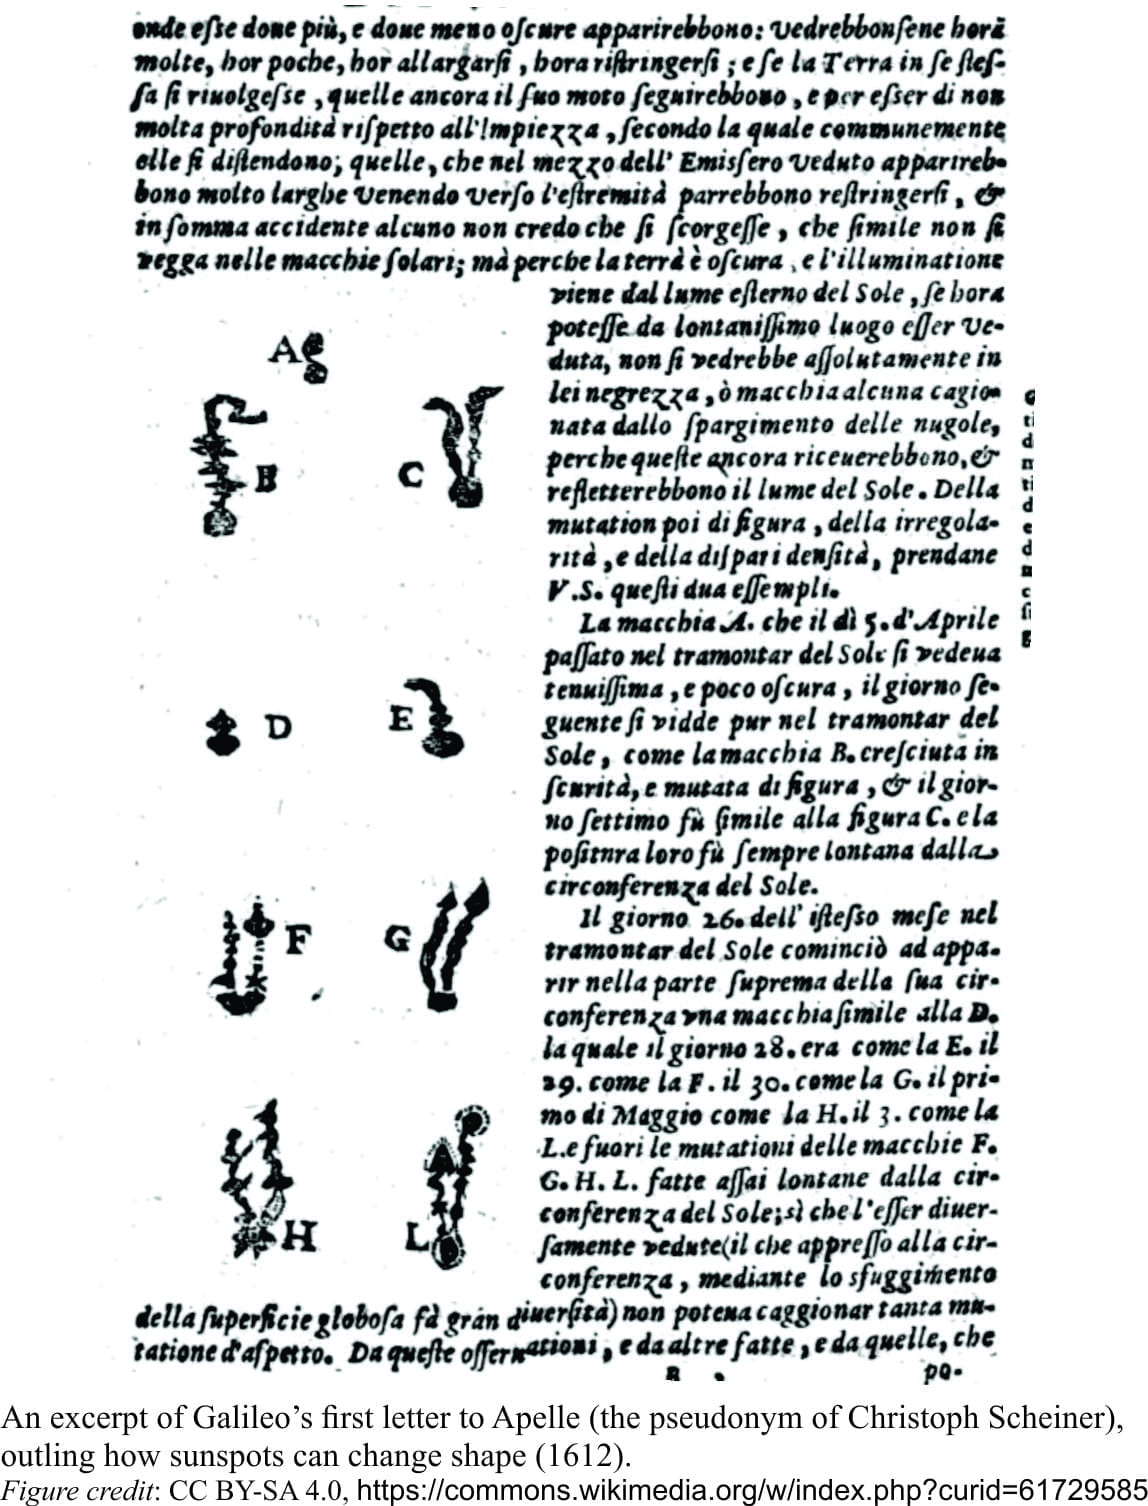 There is evidence that grander solar cycles also exist, the best documented being the Maunder Minimum, known parochially as the Little Ice Age. Between 1645 and 1715, Northern Hemisphere temperatures averaged about 1oC lower than normal. This may not sound like much, but regionally, especially in Europe, this resulted in frigid winters, failed crops, and a cold, restless populace. Other climatic minima, commonly equated with solar minima, also are recorded, for example the Dalton minimum at the end of the 18th century.
Not all scientists agree that these climate minima are directly related to variations in solar output; some argue that there is little variation in solar output, while others suggest that in some cases, volcanic eruptions contribute to cooling. A case has been made for the Maunder Minimum where, in a paper published in The Astrophysical Journal, authors N. Zolatova and D. Ponyavin argue that the incidence of sunspots, and therefore solar activity, did not diminish significantly over this period. They posit that there were errors in recognizing and counting sunspots by 18th century astronomers, and that the cultural contexts within which the astronomers worked, also influenced sunspot counting to the extent that some deliberately ignored the evidence.
A subsequent re-evaluation of the Maunder minimum using several datasets (I. Usoskin and others, 2015), was published in the journal Astronomy and Astrophysics. This multi-authored paper, is in part, a rebuttal of the earlier paper, and reinstates the ‘MM’ as a fully-fledged solar Grand minimum; they include reanalysis of sunspot records from different locations, aurora events, and 14C and 10B (cosmogenic) isotope data. The carbon and boron natural isotopes form by exposure to the sun’s radiation. Isotope data from ice cores over the last 9000-10,000 years indicates a direct relationship between solar flux and cosmogenic isotope abundance. The data indicate that solar grand minima/maxima, like the Maunder Minimum, occur every 100-200 years (this and other papers also argue that the current trend towards global heating cannot be explained by any recent changes in solar irradiance, i.e. the amount of solar energy reaching the earth’s surface).
The isotope data, plus measures of solar output over the last few decades, indicate that we are currently heading towards another Grand minimum, perhaps sometime in the next 50 years. Herein lies a climate paradox; likely heating of the atmosphere and oceans at present, competing with astronomical climate forcing that trends towards cooling.
How might this Herculean contest play out? The possible effects of low, Maunder Minimum-like solar activity in the latter part of this century have been presented in a model that considers ocean and atmospheric conditions, including the jet-stream (Journal of Geophysical Research: Atmospheres, 2015). The model suggests that, despite a reduction in solar energy similar to that calculated for the Maunder event, the total surface cooling on a global scale would be much less than 1oC, and would be unlikely to offset greenhouse gas surface warming trends.
Astronomical climate forcing, particularly when the trends are going in the opposite direction to the kind of climate change scenarios we are regaled with on a daily basis, add an intriguing twist to an already complicated tale. Climate forcing by Milankovitch orbitals, are very long-term by our daily standards and can probably be put safely to one side. But if there is any credence to the solar grand cycles, acting at a time-scale of decades, then it might be worth paying attention. It would certainly be handy knowing beforehand, the outcome of the ensuing contest.
Note: When reading the first sentence, keep in mind this post was written before the Covid-19 pandemic.