A slashing blow by some mythical behemoth, knifing effortlessly through earth’s rocky foundations; a (seemingly) bottomless chasm, a canyon, with nothing but the wind between you and whatever lies below. A bit over the top perhaps, but canyons often spark the imagination – standing on the lip can feel like being perched on the edge of the world, vertiginous for some. Most canyons have been carved by the relentless churning of stream and river, incising the layers of rock and removing the sediment to distant shores.
Terrestrial canyons have their submarine counterparts, that transect the submerged, outer margins of continents and volcanic islands. Submarine canyons commonly mark the transition from shallow continental shelves and platforms to ocean basins, acting as conduits for sediment delivery from rivers, deltas and shallow seas, to the deep oceans. And like their land-based cousins, they are deep (1 to 2 km, or in the case of Grand Bahama Canyon, 5km), steep-sided incisions in the ocean floor. More than 600 submarine canyons have been identified world-wide from bathymetry maps.
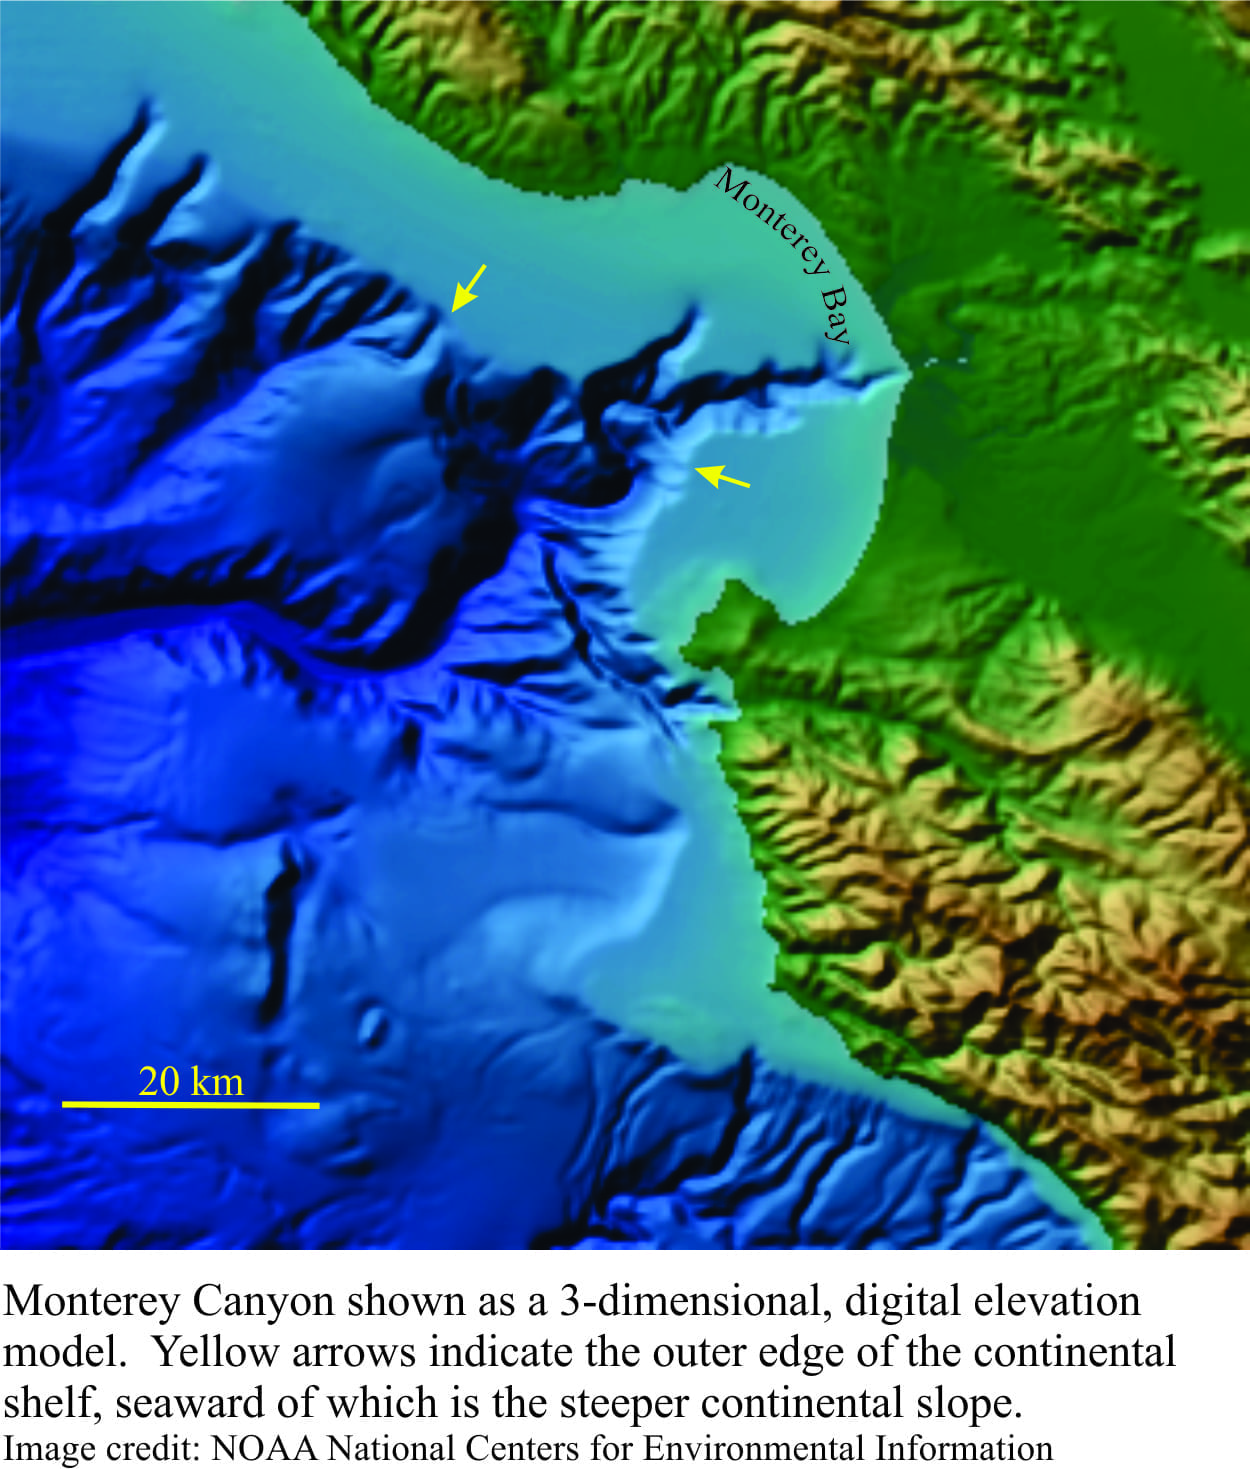
The 3-dimensional bathymetric reconstruction of Monterey Canyon (top image), about 100km south of San Francisco, illustrates common attributes of these structures. The canyon cuts deeply into the break between the shelf and steeper marine slope – in this image the break is a definite line separating light blue from darker shades. The Monterey Canyon head encroaches onto the shallow shelf to within a few 100m of the shoreline; this is actually atypical of most other canyons where incision of the sea floor usually begins closer to the shelf edge. The canyon channel snakes down slope, eventually flattening out on the deep ocean floor; the main channel is joined by several smaller tributaries. Several smaller gullies are also incised into the shelf edge and slope.
The general opinion among earth scientists is that submarine canyons are formed by two main processes: Erosion by sea-floor hugging flows of mud and sand (given the general name sediment gravity flows), and by collapse of the steep margins, producing submarine landslides (and potentially, tsunamis). Common triggers are thought to include storm surges and earthquakes. The primary basis for this interpretation is abundant geological evidence of past events, combined with some experimental work, but it remains a largely theoretical interpretation because there have been very few direct observations of either process in action. The reasons for this disparity are that submarine flows of mud and sand are relatively rare events (at least on a human time scale), and because of the difficulties inherent in witnessing such processes in deep water. For this reason, recent events in Kaikoura Canyon (southeast New Zealand) have sparked significant international interest.
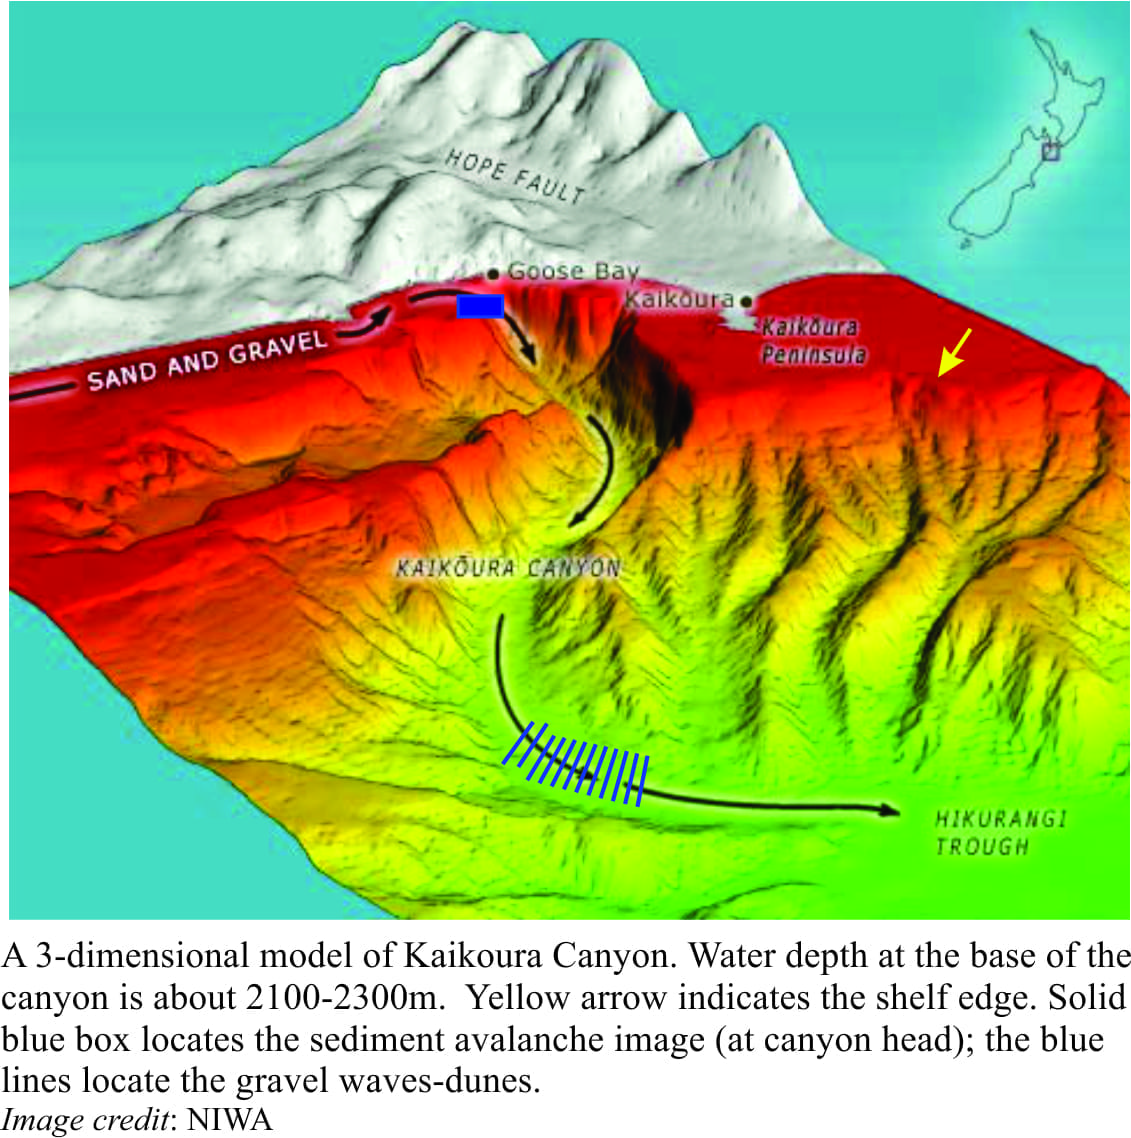
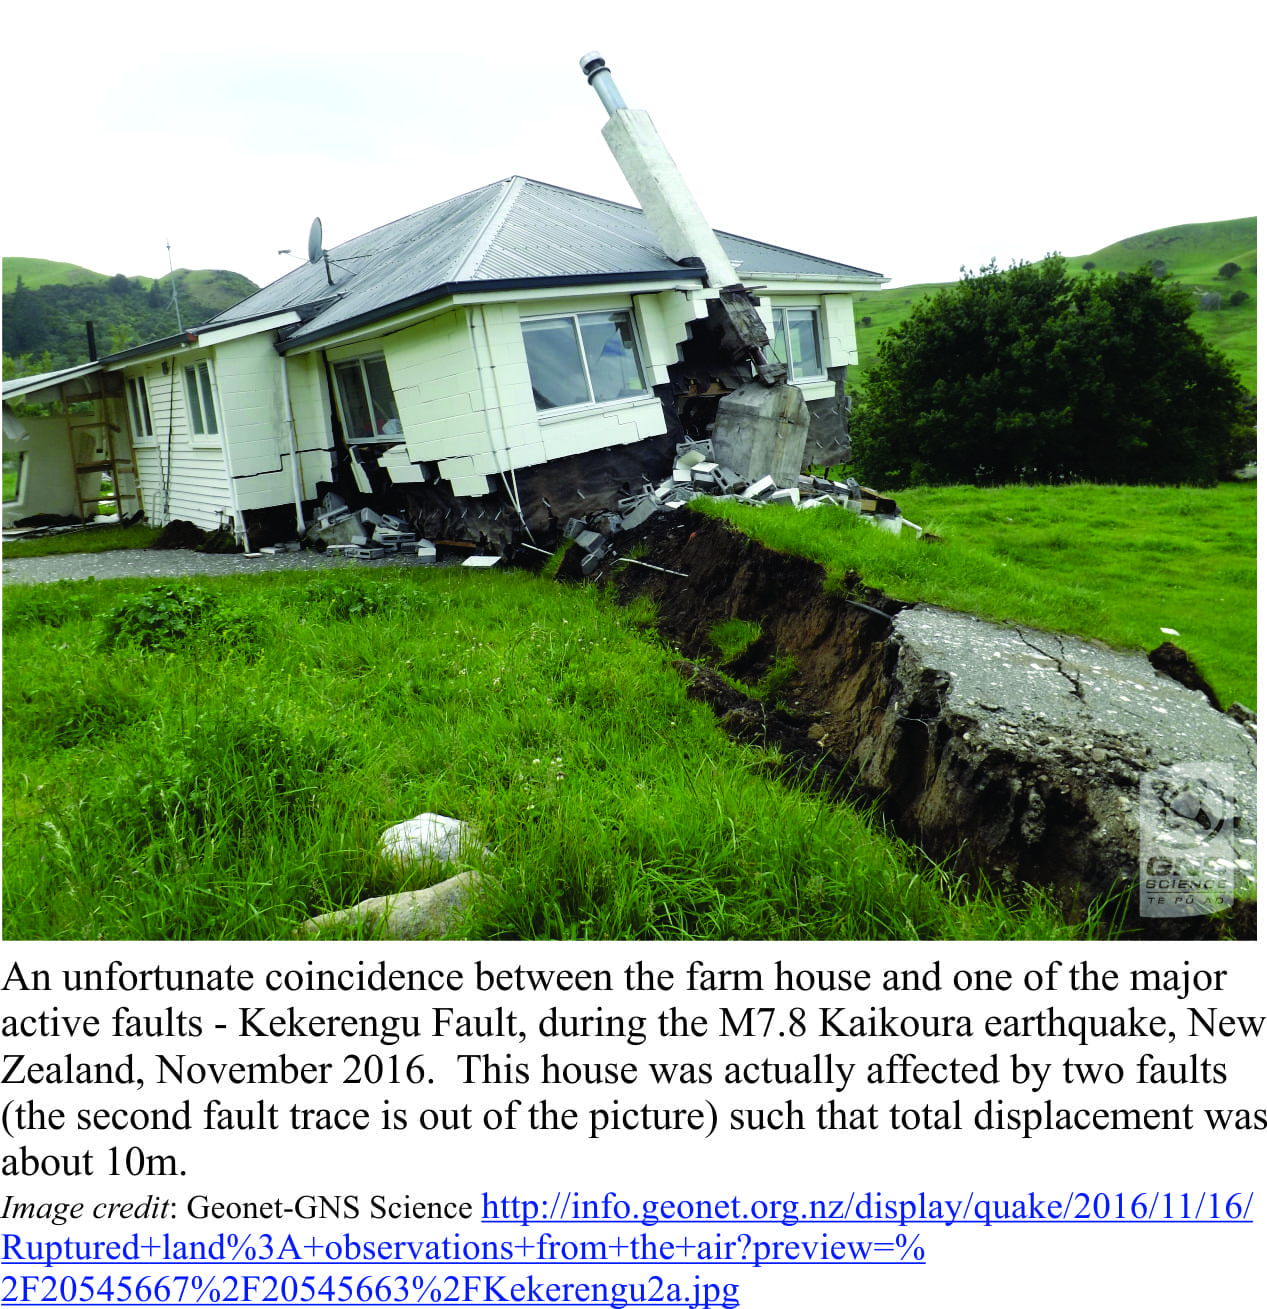
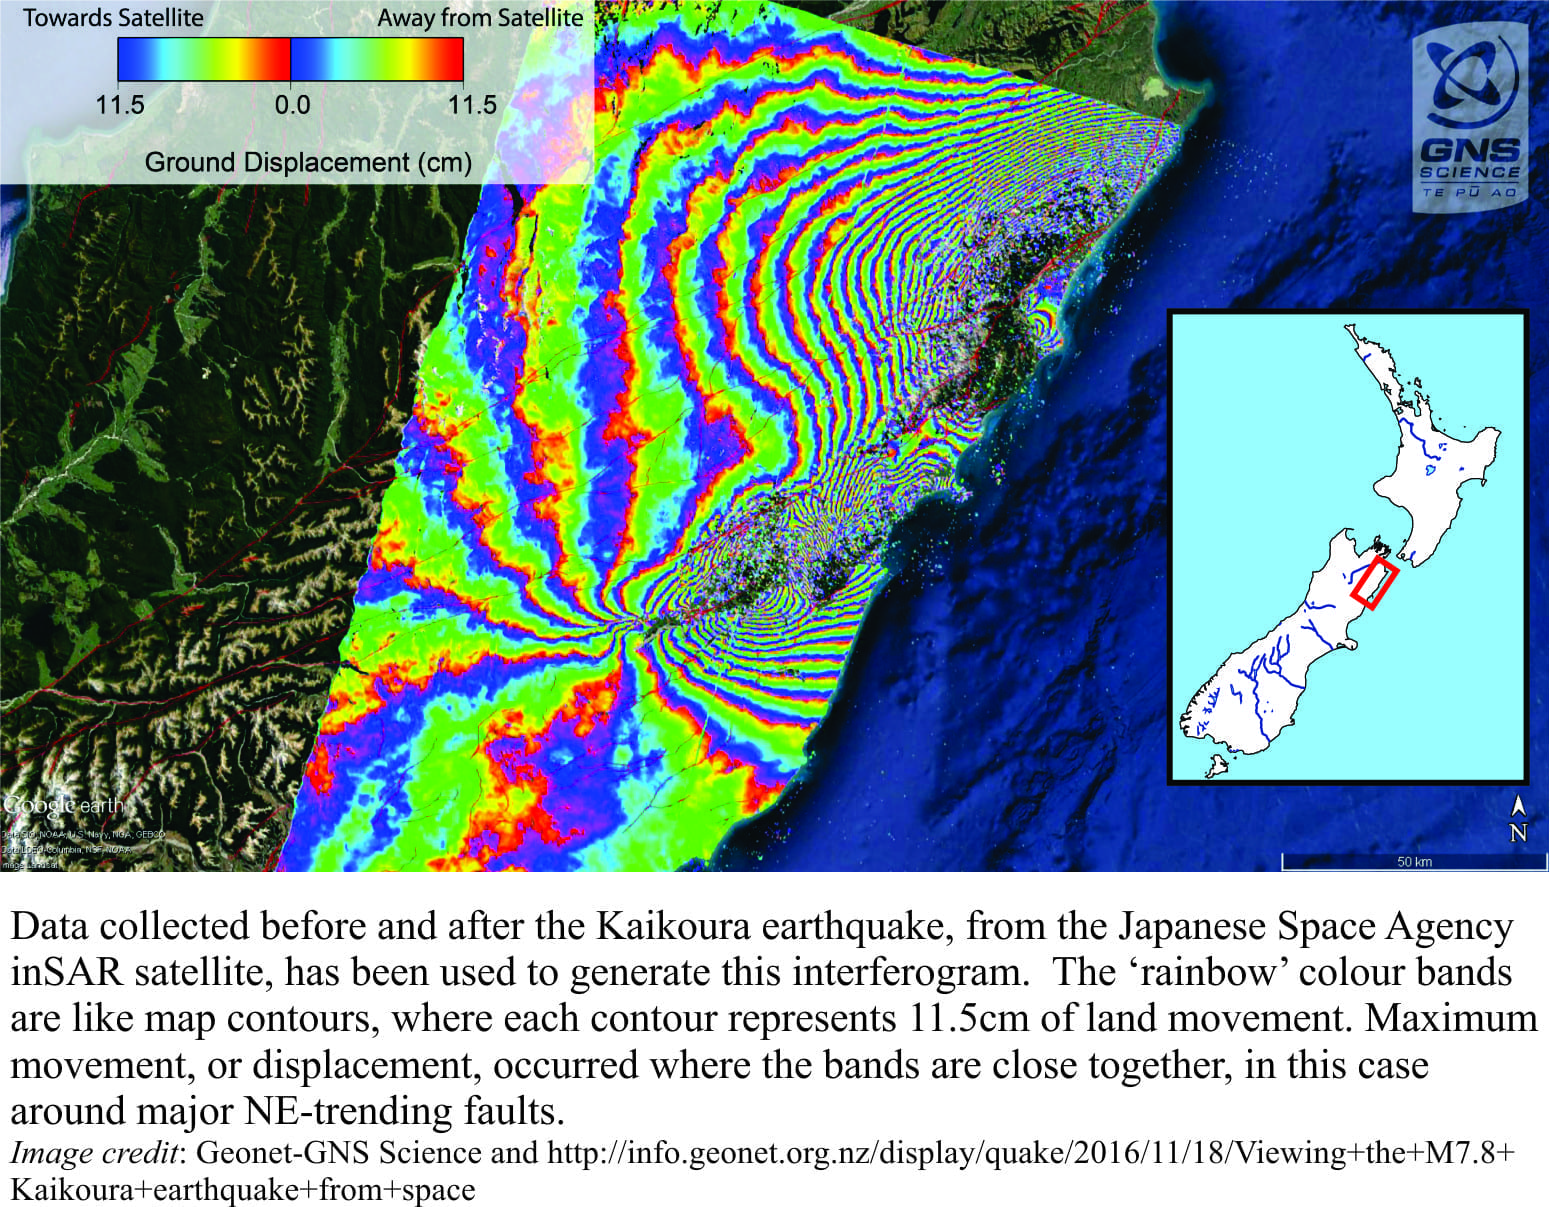
Kaikoura Canyon (New Zealand), 60km long and up to 1200m deep, is located along the tectonically active Hikurangi margin, close to the Alpine Fault system that transects northern South Island and the adjacent submarine shelf. At its deepest extent (about 2100m) the main canyon channel merges with Hikurangi Channel, which at more than 1500km, is one of the longest deep-sea channels in the world; Hikurangi channel wends its way across the more subdued ocean floor towards the abyssal Pacific Ocean. The submarine canyon head is an uncomfortable 1000m from the coast, a spitting distance that elevates the risk of destructive tsunamis that can evolve from submarine landslides along the canyon walls. November 2016, and the magnitude 7.8 Kaikoura earthquake, provided a rude reminder of the potential for disaster. The seismic jolt activated slope collapse and sediment movement down the canyon slopes and main channel; fortunately, the ensuing tsunami was small, but the bonus for science was huge. Mapping of the canyon head and main canyon channel, fortuitously three years before the earthquake and three months after the event, has enabled scientists to track the changes to channel morphology and sediment distribution that can be attributed solely to the earthquake
(The project was coordinated by New Zealand’s National Institute of Water and Atmospheric Research ( NIWA).
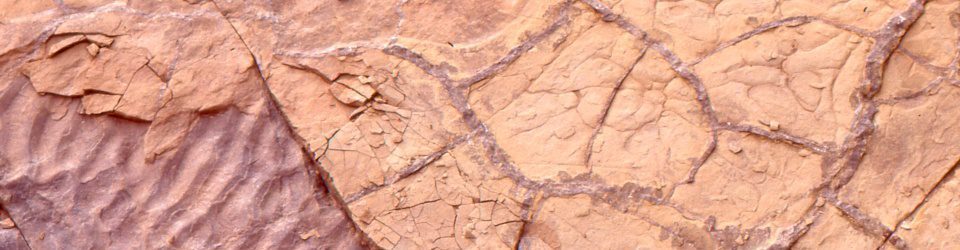
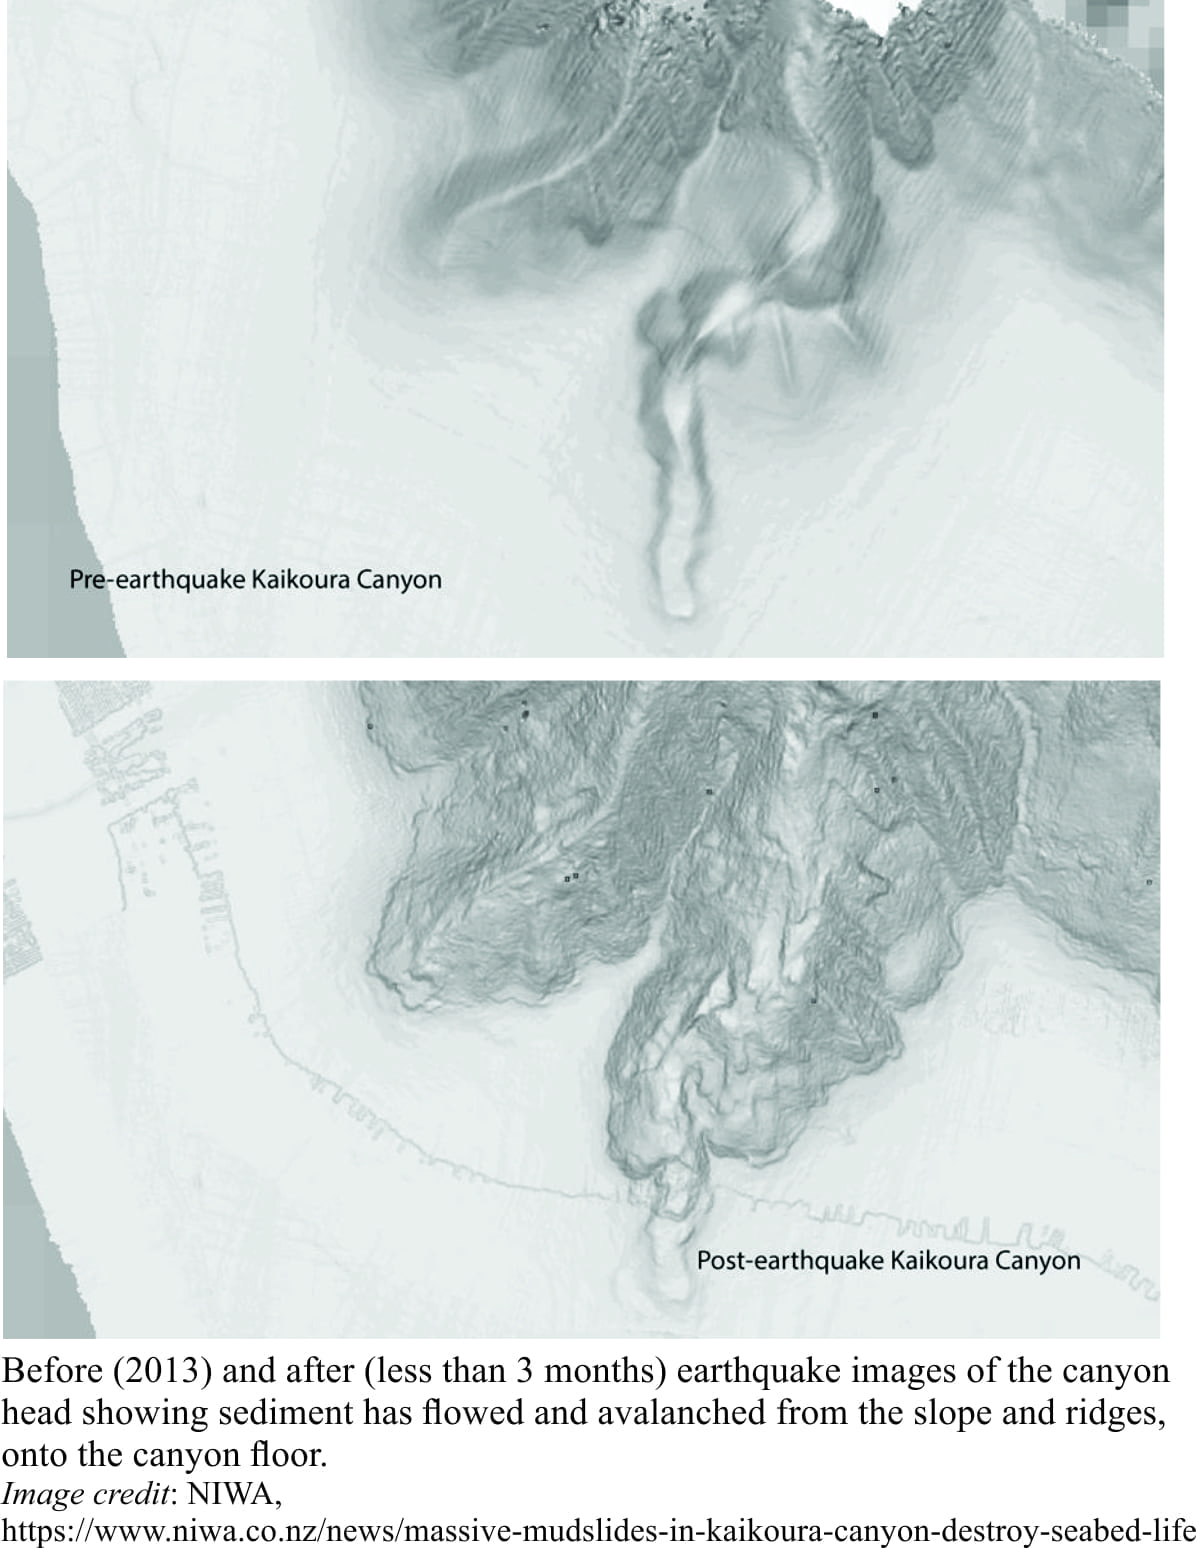
The first two images show before (2013) and after conditions at a location near the canyon head (closest to shore). Large swaths of muddy sediment were dislodged from the ridges and slopes, cascading into the main channel; most of the canyon head is now devoid of its sediment mantle. Parts of the canyon floor are 50m deeper than before the earthquake, because of erosion by the moving sediment.
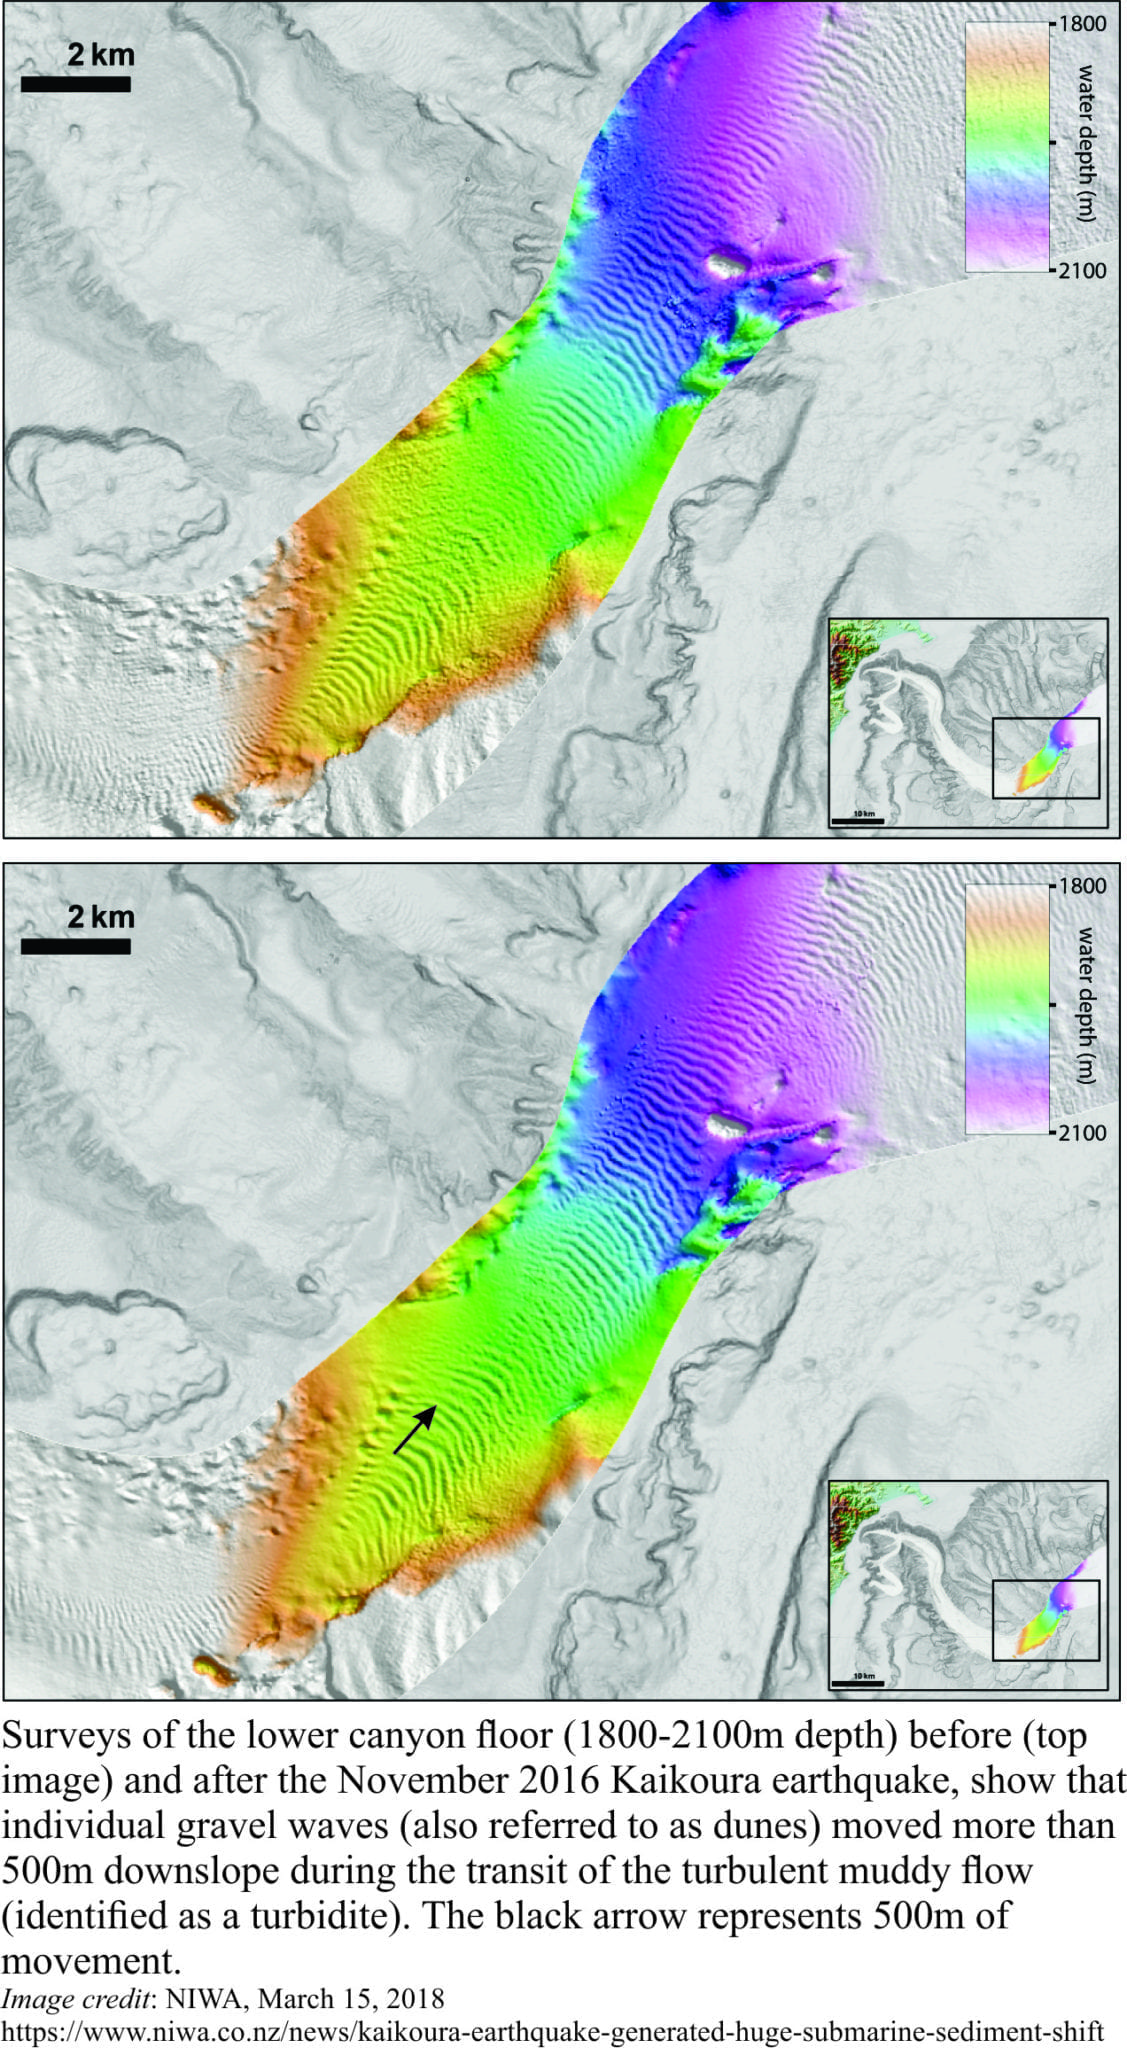
 The second set of images show before-and-after scenes of the canyon floor at 1800 to 2100m water depth. The striped pattern is formed by large, ripple-like gravel waves, or dunes, that under normal conditions would migrate slowly downslope. However, most of the gravel dunes were moved at least 500m downslope by the rapidly transiting muddy flow.
Much of the dislodged sediment continued as a turbulent muddy flow down the main canyon channel and thence to the deeper Hikurangi Channel; the flow had sufficient momentum to carry it more than 680km from its source. Evidence for this comes from deep-sea cores taken 4 days, 10 weeks, and 8 months after the earthquake. Cores were taken from the floors of both canyon channel and the more distant Hikurangi Channel, plus the flatter area, or overbank, beyond the channel banks (analogous to a river floodplain). The reasoning here is that, if sediment gravity flow deposits can be identified in the overbank region, it means that the flow itself was deeper than the channel and, given that we know how deep the channel is, an estimate can be made of the minimum depth of the actual flow. Overbank deposits were detected in cores, indicating that the moving flow was at least 180m thick, 680km from Kaikoura Canyon. As Joshu Mountjoy (one of the project leaders for NIWA) has pointed out, this has proved to be one of the few occasions in which actual flow dimensions in a deep-sea channel could be measured.
From the Kaikoura event we have confirmed that seismicity can trigger physical modifications to submarine canyons and submarine slopes, and that sediment is flushed from canyons to the deep ocean by far-travelled, turbulent muddy flows (i.e. sediment gravity flows). We have learned something of the stability of the canyon itself and the sediment that gradually mantles the sea floor. The legacy of the Kaikoura earthquake (or any major earthquake for that matter) is often voiced in terms of broken lives, disrupted highways, and the costs of rebuilding. There should be no attempt to minimise these outcomes, but we should also remind ourselves of the advances in scientific understanding of earthquakes, and the geological consequences that accrue from an event like this. We should applaud these gains in knowledge because ultimately such knowledge will help save lives and property.
Most of the information for this post is gleaned from NIWA news articles and publications, linked in the text above.