Photosynthesis, a process that had its beginnings about 2.5 billion years ago, has an awesome responsibility; it keeps us breathing. It is a metabolic process in plants that uses the energy from sunlight to drive chemical reactions; reactions that produce amino acids, proteins, sugars and other compounds that create the architecture of plants. The process takes atmospheric CO2, converts the carbon plus other nutrients to organic compounds, then expels the left-over oxygen. Plants help regulate the composition of the atmosphere – they are our other set of lungs.
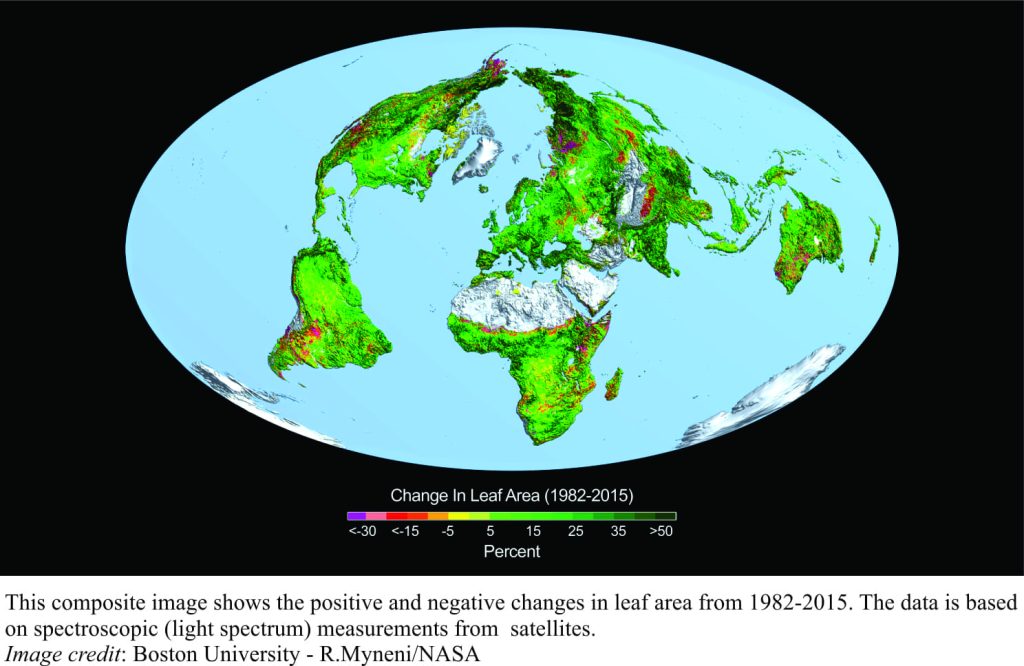
It has been shown experimentally that photosynthesis increases in many kinds of plants (some more than others), as the supply of atmospheric CO2 also increases. On a global scale, this is referred to as greening of the earth, where both regional studies, and more recently satellite data show an overall increase in plant growth, and an increase in growing seasons. In Europe and North America, the seasonal leaf-out (or bud-break) for the period 1950 to the 1990s was 2-4 weeks earlier than pre-1950.
Plant growth responds to several environmental factors, such as temperature, soil health, and the availability of water and nutrients. Modelling of plant response to these various controls suggests that globally about 70% of the increased growth (greening) is due to increases in CO2 fertilization. The remaining 30% reflect changes in nitrogen uptake, regional temperature and precipitation, and land-use.
These observations and models are important because they help to define how critical parts of the carbon cycle might respond to increasing CO2 and to changes in climate. Increased growth means that carbon sequestration in plants, and eventually in soils, is also increasing. A 2015 study has shown that there is significantly greater CO2 uptake in the tropics compared with higher latitudes, although the authors comment that continued deforestation, plus potential changes in climate conditions, might offset this process.
Quantifying the multitude of positive and negative feedback processes in the carbon cycle is a recognized challenge in climate science. Increased uptake of CO2 by plants is a negative feedback that helps reduce the excess gas in the atmosphere. However, there are important caveats and limitations to this process; some of these are listed below.
- Plants, in adapting to increased CO2, may reach a point where there is no additional growth. Increased CO2 concentrations result in the closure of leaf stomata. Stomata are the microscopic vents in leaves that allow CO2 to enter, and water to leave (evapotranspiration) the leaf structure. Closure of stomata is used by plants to regulate water loss, but closure will also restrict the amount of absorbed CO2.
- Nitrogen is a critical plant nutrient. It has been experimentally determined that increased CO2 can lead to a decreased uptake of nitrogen; this negative response persists even when plant growth is enhanced by CO2. The long-term effects of lower N are not well understood. Nitrogen is a key ingredient of plant proteins, so does a potential reduction in its uptake mean lower protein levels in food crops?
- Other nutrients, such as phosphorous and potassium, are critical for plant growth. Leaf growth cannot continue unabated without sympathetic development of roots, for which both potassium and phosphorous are necessary ingredients. Increased leaf greening may be limited by the availability of these other nutrients.
- How do soil microorganisms respond to increasing CO2? Microorganisms are responsible for mediating the delivery of most nutrients to plants, but they are highly susceptible to soil erosion, deforestation, and changes in soil chemistry such as pH.
The response by vegetation to increasing atmospheric CO2 is an important feedback in the carbon cycle. The earth is greening, but it is also clear that the current vegetation cover is not capable of sequestering all produced CO2, because atmospheric levels of the gas continue to rise. Deforestation in tropical regions is certainly not helping in this regard. The importance of understanding such changes cannot be understated; plants, both macroscopic and microscopic, are a critical part of the food chain. Plants can adapt to environmental changes, but that capability is highly variable among the different kinds of vegetation. Plant adaptability also has its limits.
