Mohr-Coulomb failure criteria

Facebooktwitterlinkedininstagram
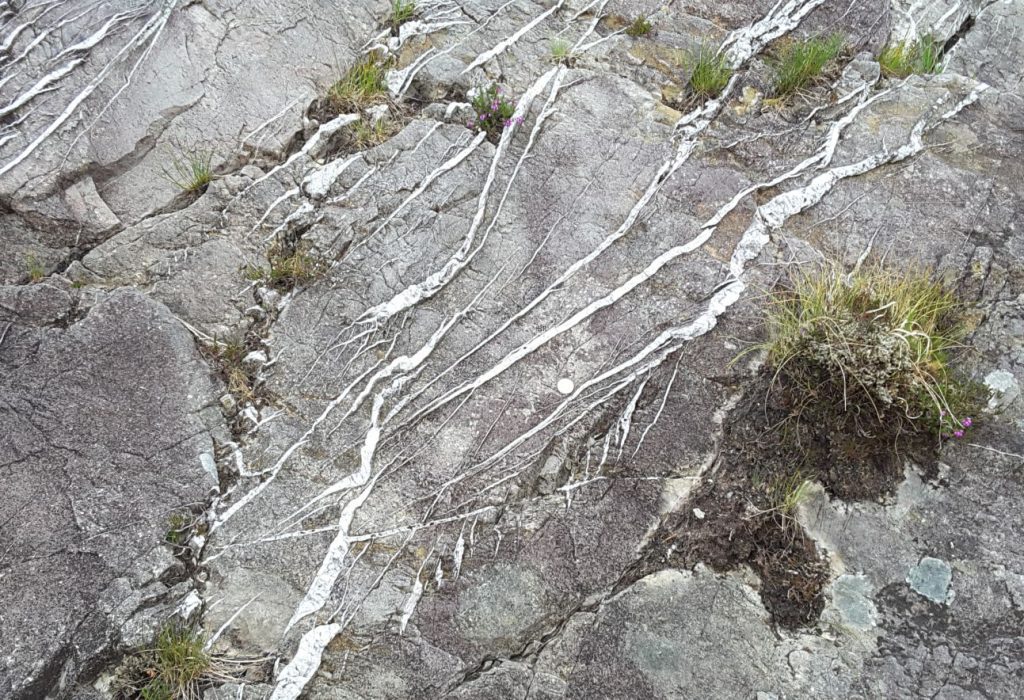
Conjugate fractures and en echelon tension gashes – indicators of brittle failure in Old Red Sandstone, Gougane Barra, County Cork, Ireland.

Conjugate fractures and en echelon tension gashes – indicators of brittle failure in Old Red Sandstone, Gougane Barra, County Cork, Ireland.

Brittle deformation and Mohr-Coulomb failure

Deformation of Earth materials takes place predominantly within two rheological domains: brittle and ductile. Deformation close to the Earth’s surface is dominated by brittle failure (faults, fractures, and joints); ductile behaviour of rock become increasingly important deeper in the crust and lithosphere mantle – exceptions include the deformation of ice and salt at shallow depths. Ductile deformation depends on differential stress, material viscosity, and time, where the latter is generally couched in terms of strain rate. Brittle failure also depends on strain rate, but at the opposite end of the scale; it is also a function of rock strength.

Rock strength is a measure of the stress required to produce failure. It has the units and dimensions of stress, commonly expressed as megapascals (ML-1T-2). Rock strength is defined for tensile and compressional conditions – joints are mostly tensile structures whereas faults and fractures involve components of shear with dip-slip, strike-slip or oblique-slip movement along planes of failure. In general, compressive strength exceeds tensile strength within the crust.


Measurement of rock strength

The strength of any material can only be determined by experiment. For hard rock the most common tests are the uniaxial and triaxial compression tests. Triaxial tests can also be used for unconsolidated soil and sediment, but other methods like cone penetrometry are probably more useful for determining resistance to stress.

Uniaxial and triaxial tests subject a small cylinder of rock to axial normal stress (σ1) using a piston at one end of the cylinder. In uniaxial tests the rock cylinder is unconfined such that σ2 = σ3 = 0). For triaxial tests, rock cylinders are enclosed in a jacket of rubber or metal that is pressurized, commonly by oil or some other fluid that surrounds the jacketed sample; in this case σ2 = σ3 > 0. Tests with this apparatus will usually increase the confining pressure incrementally. The piston pressure value at the point of failure corresponds to the material strength.  Typical triaxial stress-strain curves are shown below.

A schematic of a typical experimental set-up for triaxial tests on rock samples. Confining pressure is increased by increasing the pressure on the oil surrounding the jacketed rock cylinder (from R. Weijermars 2023, Principles of Rock Mechanics, Figure 6.11b. Creative Commons Attribution-NonCommercial-ShareAlike 4.0 International License. PDF available).The example of sheared rock shows fracture planes that are highly irregular, plus subordinate microfractures. Typical stress-strain curves (right) are shown for increasing confining pressures; differential stress is the principal maximum stress σ1 minus the minimum stress σ3. The steep part of each curve (parallel to the green line) is the initial, recoverable elastic response; beyond this limit the curves represent permanent deformation. From Middleton and Wilcock 1974, Figure 4.8

A schematic of a typical experimental set-up for triaxial tests on rock samples. Confining pressure is increased by increasing the pressure on the oil surrounding the jacketed rock cylinder. The example of sheared rock shows fracture planes that are highly irregular, plus subordinate microfractures (from R. Weijermars 2023, Principles of Rock Mechanics, Figure 6.11b. Creative Commons Attribution-NonCommercial-ShareAlike 4.0 International License. PDF available). Typical stress-strain curves (right) are shown for increasing confining pressures; differential stress is the principal maximum stress σ1 minus the minimum stress σ3. The steep part of each curve (parallel to the green line) is the initial, recoverable elastic response; beyond this limit the curves represent permanent deformation. From Middleton and Wilcock 1974, Figure 4.8

Failure at very low confining pressures commonly produces fractures that parallel the rock cylinder. At higher confining pressures conjugate fractures form where the conjugate set is approximately bisected by the maximum principal normal stress σ1. Theoretically the two fracture planes should form at angles where the shear stress is a maximum, in other words at 45o to σ1. The fracture angle (θ) is measured from σ1 to the normal to the fracture plane. The reason for this is that the stress acting on the plane can be resolved into a normal stress component at right angles to the plane, and a component parallel to the plane which is the shear stress.  Based on experiment, (θ) measured in this way tends to be slightly larger than 45o (which means the fractures are aligned slightly less than 45o either side of σ1).  Furthermore, it has been determined experimentally that the normal stress (piston pressure) required for sample failure increases with increasing confining pressure, but the fracture angle for a particular material (θ) remains relatively constant.
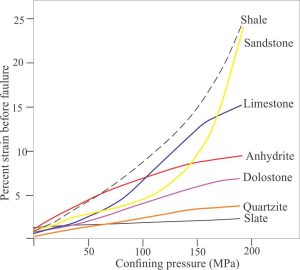
Examples of the stress-strain relationship for triaxial test failure of different rock types, where strain is expressed as a percentage (strain has dimensions of L), and stress is the confining pressure. The graph also illustrates the increase in rock strength with increasing confining pressure. Modified slightly from From R. Weijermars 2023, Principles of Rock Mechanics, Figure 6.10. op cit.

Examples of the stress-strain relationship for triaxial test failure of different rock types, where strain is expressed as a percentage (strain has dimensions of L), and stress is the confining pressure. The graph also illustrates the increase in rock strength with increasing confining pressure. Modified slightly from From R. Weijermars 2023, Principles of Rock Mechanics, Figure 6.10. op cit.

Coulomb’s statement of material failure

The experimentation and theory that established the principles of rock strength and criteria of failure are commonly attributed to Charles Augustin Coulomb (1736-1806) although his initial research drew on the work of two illustrious predecessors – Leonardo da Vinci (1452-1519)   and Guillaume Amonton (1663 –1705).  Both conducted experiments on friction; of significance to Coulomb’s later work was their conclusion that frictional forces are proportional to the normal forces acting on a plane.

Amonton in 1699, expressed this relationship something like:

                                           Frictional force/ σN = Tan φ

 where σN is the normal force, φ is the internal friction angle, and Tan φ is variously called the friction factor, or friction coefficient, commonly written as γ. Tan φ is dimensionless. The internal friction angle is defined as the angle between the normal stress and resultant stress at the point of failure. The ‘internal’ part of the name refers to friction forces within a material – forces that resist deformation, rather than friction on a surface.

[Note the difference between the internal friction angle φ, and the angle of fracture θ that references an actual, observable fracture plane – they are not the same measure.]

Coulomb recognized the importance of friction as a control on material failure. However, he concluded that the natural strength, or cohesion of rock, sediment, and soil also played a critical role (Coulomb, 1773). His mathematical statement expands Amonton’s equation such that the shear stress (τ) at the point of material failure requires a cohesive strength term and a friction term, thus:

                                                τ = C0 + Tanφ σN    or

                                                τ = C0 + σN γ  

where τ is the shear stress at the point of failure and C0 is the material cohesive strength. This is the iconic Coulomb criterion for material failure.

A useful way to visualize the internal friction angle (φ) is to conduct a simple experiment demonstrating the angle of repose for a pile of dry, well-sorted sand; the actual value is about 34o. If the slope increases it becomes gravitationally unstable and grains will slide or tumble downslope until the repose angle is re-established – in other words, the granular material shears – the repose angle represents the condition of dry sand peak-strength at the point of failure. This basically is the model applied to failure of harder rock where internal shear is caused by differential stresses.


Plotting Coulomb’s criterion for failure

Coulomb’s statement τ = C0 + Tanφ σN is the equation of a straight line for a graphical plot of shear stress against normal stress – also called the failure envelope or Mohr-Coulomb envelope. The slope of the line gives the value of (φ); the intercept on the shear stress axis ) is C0.

The two axes in the plot (shear stress τ and normal stress σ) are the same used to construct Mohr circles. Construction of the Mohr-Coulomb diagram for the failure conditions of a particular material makes use of experimental data obtained from the stress tests described above. The failure envelope makes a tangent to the Mohr circle at the point where the stress conditions for failure are represented (red dot in the diagram below). As noted previously, the orientation of the experimental fracture plane is designated θ – the angle measured from the normal to the fracture plane to σ1. On the Mohr circle this is plotted as 2θ. In a conjugate fracture set there will be two failure envelopes – one at or close to the maximum positive shear stress, and the other the minimum negative shear stress.
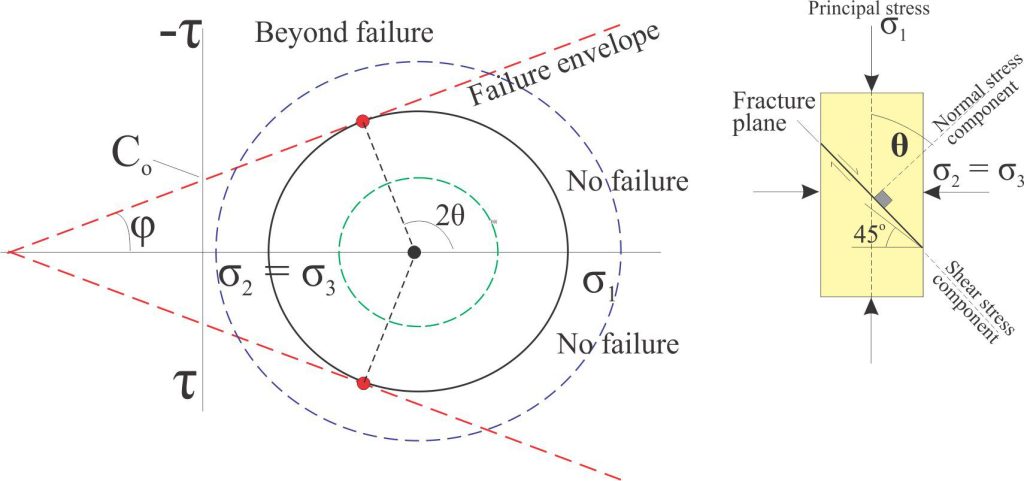
The Coulomb criterion for material failure, plotted as a straight line, is combined with a Mohr circle – in practice the stress values are determined experimentally. The straight line is a tangent to the circle at the point of failure. Co is cohesive strength, φ the internal friction angle, and θ-2θ the fracture plane orientation. The stress conditions below the line are insufficient to generate failure (green Mohr circle). Conversely, it is not possible for a Mohr circle (blue circle) to extend above the line because failure would occur before those stress conditions were reached. Note that the minimum and intermediate principal stresses are equal in both uniaxial and triaxial tests. The relationship between θ and σ1 is shown in the theoretical rock cylinder on the right.

The Coulomb criterion for material failure, plotted as a straight line, is combined with a Mohr circle – in practice the stress values are determined experimentally. The straight line is a tangent to the circle at the point of failure. Co is cohesive strength, φ the internal friction angle, and θ-2θ the fracture plane orientation. The stress conditions below the line are insufficient to generate failure (green Mohr circle). Conversely, it is not possible for a Mohr circle (blue circle) to extend above the line because failure would occur before those stress conditions were reached. Note that the minimum and intermediate principal stresses are equal in both uniaxial and triaxial tests. The relationship between θ and σ1 is shown in the theoretical rock cylinder on the right.


Constructing a Mohr-Coulomb envelope

The starting point is measurement of the principal stress (σ1) and confining pressures (σ2 = σ3) at the point of failure, and the experimentally derived fracture plane angle θ; the value of 2θ gives us the tangent to the Mohr circle. In practice, measurement of θ can be difficult because failure does not always occur along a single, coherent plane. To avoid this problem, it is common practice to perform several experiments on the same material and measure the principal stress (piston pressure) at different confining pressures. The rationale for this, as noted above, is that θ remains reasonably constant for different confining pressures. Mohr circles are constructed for each case and the line representing the best-fit tangent is drawn, giving us values of 2θ, φ, Co, and shear stress at each point of material failure.
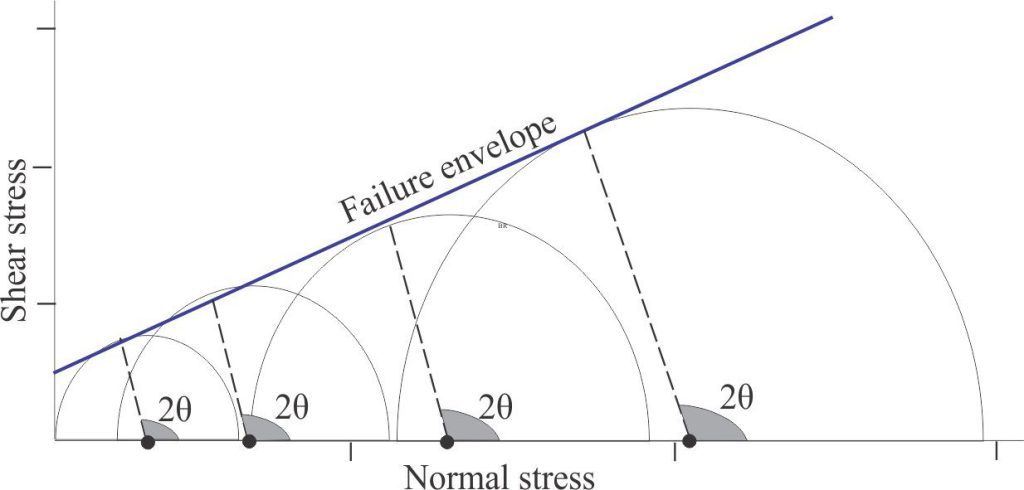
Construction of a best-fit tangent to Mohr circles that represent material failure at different confining pressures in a series of triaxial stress tests conducted on samples of the same rock type. The value of 2θ remains relatively constant in each stress test.

Construction of a best-fit tangent to Mohr circles that represent material failure at different confining pressures in a series of triaxial stress tests conducted on samples of the same rock type. The value of 2θ remains relatively constant in each stress test.

The non-linear case

For many cases of brittle deformation, the straight-line failure envelope is a good approximation of the conditions leading to fracturing. However, for some materials the failure angle is not a linear function of confining pressure – the result is a parabolic curve in which 2θ and φ are not constant with decreasing confining pressures. This is manifested as fracture planes that steepen towards σ1 (i.e., the angle between σ1 and the fracture plane decreases) whereas 2θ increases.
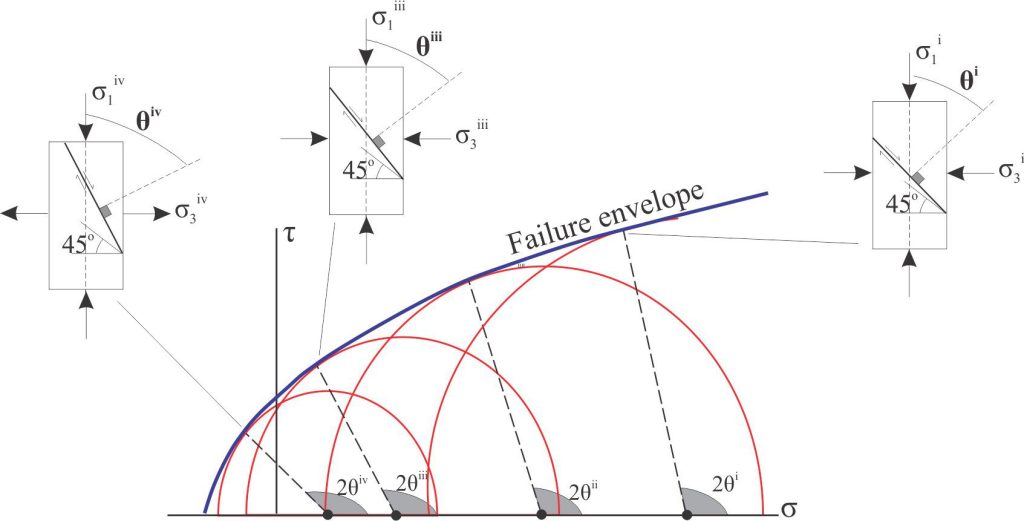
For some materials, the relationship between confining pressures (σ2 = σ3) and rock strength is nonlinear. In this example, the best-fit line is parabolic corresponding to fracture planes that steepen towards σ1 (2θ increases) as confining pressure decreases. Modified slightly from From R. Weijermars 2023, Principles of Rock Mechanics, Figure 6.20 op cit.

For some materials, the relationship between confining pressures (σ2 = σ3) and rock strength is nonlinear. In this example, the best-fit line is parabolic corresponding to fracture planes that steepen towards σ1 (2θ increases) as confining pressure decreases. Modified slightly from From R. Weijermars 2023, Principles of Rock Mechanics, Figure 6.20 op cit.


Other posts in this series

Mohr circles and stress transformation

Beds and bedding planes

Measuring dip and strike

Solving the three-point problem

The Rule of Vs in geological mapping

Plotting a structural contour map

Stereographic projection – the basics

Stereographic projection of linear measurements

Stereographic projection – unfolding folds

Stereographic projection – poles to planes

Folded rock; some terminology

Faults – some common terminology

Thrust faults: Some common terminology

Strike-slip faults: Some terminology

Using S and Z folds to decipher large-scale structures

Cleavage and cleavage-bedding intersections

The kinematics of deformed rock

Facebooktwitterlinkedininstagram
Facebooktwitterlinkedin

Mohr circles and stress transformation

Facebooktwitterlinkedininstagram
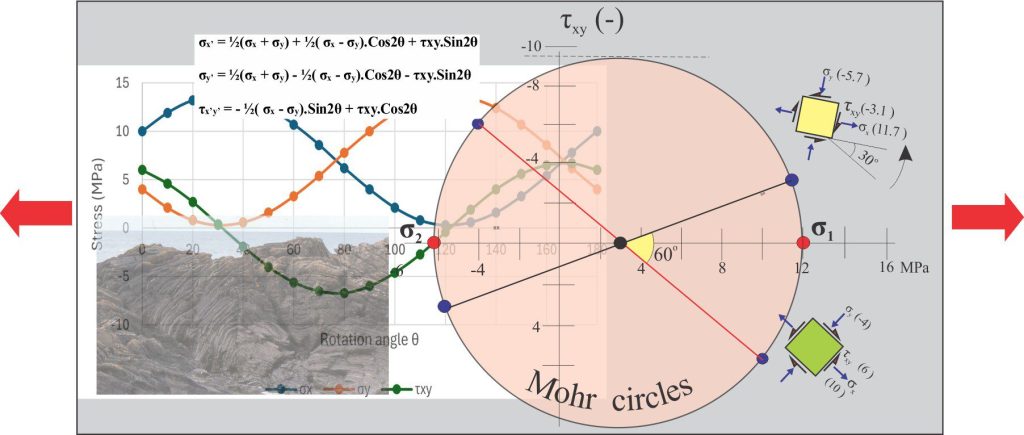
A montage of stress transformation paraphernalia and rock deformation

A montage of stress transformation paraphernalia and rock deformation

Calculating normal stress and shear stress using Mohr circles

Deformation of rock, sediment, and soil is usually manifested as a change in material location, shape, or volume. This means a change in the angular relationship between the original and final configuration of the rock body relative to some coordinate system – in other words, the rock body is rotated. Deformation involves both normal (tension, compression) and shear stresses and as deformation progresses the components of stress must change; in other words, their magnitude and angular relationship to the chosen coordinates changes (note that the ambient stress field is static, at least in the short term). Herein lies one of the more important tasks of structural analysis – calculating the values of the stress components at any stage during deformation. Some of the practical reasons for doing this include:

  • Determination of the principal stress axes (axes of maximum and minimum stress).
  • Determining the relationship between normal and shear stress acting on a plane (e.g., an engineered plane, or fault plane).
  • Calculating the shear stress acting on a body to determine its mechanical stability and potential for failure. This applies to loading or unloading of structural and geotechnical structures such as beams, foundations, bridge spans, the stability of tunnel walls, or soil strength in relation to constructed loads, and to natural surfaces where soil or rock failure can have catastrophic consequences (e.g., earthquakes, slope failures, landslides,).


Transforming the components of stress

The central problem involves calculation of the stress components within a rotating coordinate system. The mathematical expressions we use to calculate the components of stress were developed by the French mathematician-engineer Augustin-Louis Cauchy (1789-1857). The mathematics of continuum mechanics was central to his analysis of the problem. This approach assumes that matter in any material (steel, rock, soil) is continuous – in other words it ignores the real-world condition that most materials, particularly rock or sediment, are composed of discrete particles, grains, or crystals. Thus, the continuum assumes that material is homogeneous (e.g., its composition does not vary throughout) and isotropic – its physical properties, such as density, are continuous in three dimensions. From a mathematical perspective this approach is much simpler than attempting to map all the real- world complexities that exist in Earth materials.

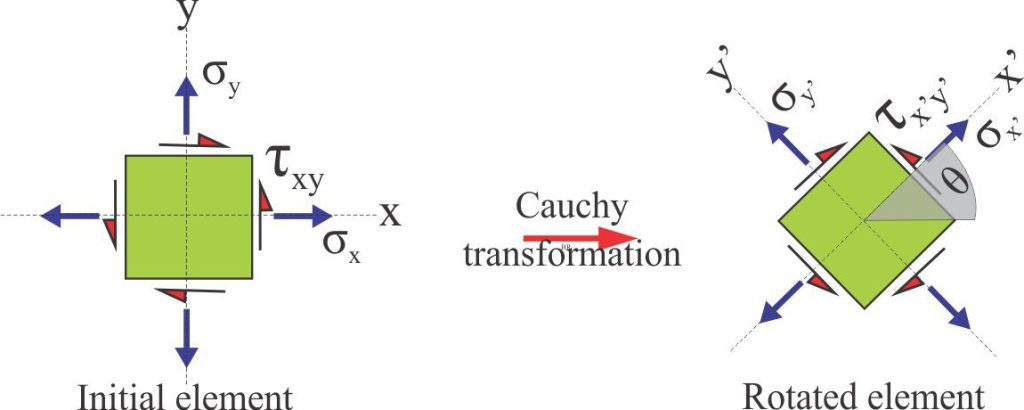
Cauchy began by defining a static 3D structural element within a material body. This element bears no relationship to grains or crystals – it is imaginary. The element is a cube having orthogonal faces that represent the components of normal and shear stress. The element is static which means that the stresses acting on it must balance – this is the initial condition of the element. It exists within a standard Cartesian coordinate system labelled σx, σy, and σz. (but note the choice of coordinates is arbitrary).

We can simplify the problem by assuming σz is zero and dealing with stress in 2D (the right panel below). Here, σx and σy can be either tensional or compressional. The element is also subjected to shear stress. Note that the shear vectors τxy parallel to the x axis are opposite those parallel to the y axis; this provides the required balance for a static structural element where the shear stresses sum to zero (this does not mean the actual shear stress value along a face is zero).

Cauchy’s 3D and 2D elements and coordinates showing the components of normal and shear stress defined for each face. The coordinates are the standard cartesian system. For a static element, the stresses must balance; this is most easily seen in the 2D element where the shear couples are oriented in opposite directions. Diagrams modified from The Efficient Engineer.

Cauchy’s 3D and 2D elements and coordinates showing the components of normal and shear stress defined for each face. The coordinates are the standard Cartesian system. For a static element, the stresses must balance; this is most easily seen in the 2D element where the shear couples are oriented in opposite directions. Diagrams modified from The Efficient Engineer.

If the 2D element is rotated through an angle θ, the normal and shear stress components will change, as will the coordinates.

Rotation of a 2D structural element through an angle θ and definition of the new stress components.

Rotation of a 2D structural element through an angle θ and definition of the new stress components and coordinates. Calculating the value of these components is central to Cauchy’s method of transformation.

Cauchy developed three equations to solve for the new components σx’, σy’, and τx’y’ for any value of θ (x’ and y’ are the new coordinates) (he did this using some fairly complex maths involving tensor calculus). The solution to these equations assumes we know the values of normal and shear stress in the initial element, i.e., σx, σy, and τxy.

                            σx’ = ½(σx + σy) + ½( σxσy).Cos2θ + τxy.Sin2θ

                            σy’ = ½(σx + σy) – ½( σxσy).Cos2θ – τxy.Sin2θ

                            τx’y’ = – ½( σxσy).Sin2θ + τxy.Cos2θ

Cauchy’s three stress transformation equations, where σx’, σy’, and τx’y’ are the transformed components of normal and shear stress in the new (rotated) set of coordinates. θ is the rotation angle. Commonly used solutions to calculate the 2θ values are Sin 2θ = 2 Sinθ. Cosθ and Cos 2θ = Cos2θ – Sin2θ.

For more detailed descriptions of stress fields and derivation of the Cauchy transform equations refer to Middleton and Wilcock, 1994, Chapter 4; and Davis and Reynolds, 3rd Ed. 2012, Chapter 3.


Rotating a structural element through 180o

We can calculate the normal and shear stress components on a structural element through any angle of rotation using Cauchy’s equations. In the example below, an element is rotated through 180o at 10o intervals; the initial and calculated values of σx, σy, and τxy are in units of MPa (megapascals). Plotting the stress values for each σx’, σy’, and τx’y’ against the rotation angle produces sinusoidal curves that contain the following information:

  • The structural element at 180o rotation is in the same orientation as at 0o – extending this through 360o will repeat the curves.
  • The maximum and minimum values for each stress can be read directly from the graphs.
  • The shear stress is zero when the normal stresses are at their maximum and minimum values.
  • The negative shear stress values refer to reversal of the stress vector directions.
Stress - θ plots of normal and shear stress components for a 2D element, using the initial values for σx, σy, and τxy shown in the left panel. The component values at 180o are the same as those at zero rotation (the initial condition). Maximum and minimum stress values are indicated. The calculations were made using the Civil Engineering Online calculator.

Stress – θ plots of normal and shear stress components for a 2D element, using the initial values for σx, σy, and τxy shown in the left panel. The component values at 180o are the same as those at zero rotation (the initial condition). Maximum and minimum stress values are indicated. The calculations were made using the Civil Engineering Online calculator.

Mohr’s circles

Cauchy’s method for stress calculation is accurate but a bit long-winded (although there are several handy-dandy online calculators that will do the job for you). Otto Mohr (1835-1918) a German engineer-physicist known for his studies on stress and strain, developed a simple graphical system that produces the same results as Cauchy’s equations. Mohr, along with other mathematicians and physicists recognized that the Cauchy equations could be rearranged to express the equation of a circle – having the general form:

(σx – a)2 + (σy – b)2 = r2

Where a and b are the coordinates of the centre and r is the circle radius.

Stress transformations can be represented by this circle – the eponymous Mohr circle, or Mohr diagram (published in 1882). The Mohr circle contains all the information presented in the graphical plots shown above.


Mohr circle coordinates and angles

The coordinate system used in Mohr’s diagram differs from that used in the element rotation plots shown above; conventionally:

  • The horizontal axis contains the values for BOTH σx and σy – σx on the right and σy the left.
  • Values of normal stress in tension are positive; in compression negative. Negative values lie to the left of the coordinate origin.
  • Axes σx and σy are 90o apart, but on the Mohr diagram they are plotted 180o . Thus, all angles on the Mohr circle are twice those of the measured angle of rotation (θ). For example, if θ is 30o the value on the Mohr circle will be 60o.
  • The vertical axis contains values for shear stress τxy – positive values below the x-y axis, negative above.
  • A counterclockwise sense of shear is positive; clockwise is negative (some engineers reverse this convention)
  • The x-y axis also corresponds to zero shear stress.


Constructing a Mohr circle

We will use the stress conditions for the initial state of the structural element illustrated above but the method applies to any transformed state. The normal and shear stress values on the x and y faces are plotted: (σx, τxy) and (σy, τxy). In this example both normal stresses are tensional and have positive values. On the x face, the shear stress τxy is positive (counterclockwise sense of rotation) and on the y face it is negative (clockwise).

Note that only the stress components change during rotation – the ambient stress field remains the same.

The x and y faces in the element are orthogonal (90o) but on the Mohr circle they are 180o apart. Therefore, the line joining the two points represents a diameter. The circle is drawn on these two points.

Mohr circle drawn for the initial element (green), based on the x face and y face stress values (blue dots). The line between these two points is the circle diameter. Maximum σx and σy values lie on the x-y axis (red dots); Maximum shear stress is read from the tangents to the circle (dashed lines); the horizontal axis represents zero shear stress. Stress values for any value of 2θ can be read on the at any point on the circumference – the actual rotation angle θ is half this value.

Mohr circle drawn for the initial element (green), based on the x face and y face stress values (blue dots). The line between these two points is the circle diameter. Maximum σx and σy values lie on the x-y axis (red dots); Maximum shear stress is read from the tangents to the circle (dashed lines); the horizontal axis represents zero shear stress. Stress values for any value of 2θ can be read on the at any point on the circumference – the actual rotation angle θ is half this value.

The diagram contains the following information:

  • The values and signs for σx, σy, and τxy for any rotation angle can be read directly from the graph.
  • In this example, the normal stresses are always positive, and therefore always in tension no matter the rotation angle. However, the shear stress values vary from positive to negative through rotation.
  • The maximum and minimum values for σx, σy, and τxy are read from tangents drawn parallel to either axis.
  • The principal stress values σ1 and σ2 lie along the line where stress values are zero – this coincides with the x axis.

Mohr circle example 2

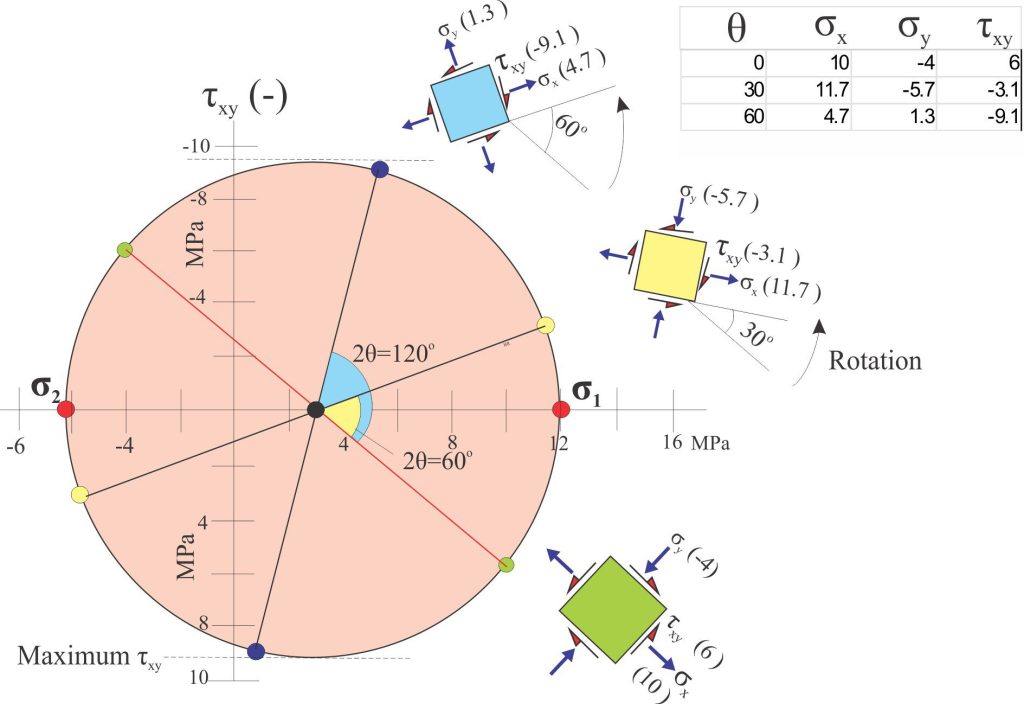
The initial 2D element in this example (green) has an x-face in tension (positive values) and a y-face in compression (negative values). Plotting the normal and shear stress components for each face gives us two points from which we draw the circle diameter (red line).  Note that the circle encroaches on the negative part of the normal stress axis.

Any point on this circle will give us the stress values and signs for the rotation angle relative to the initial element. Examples at 30o and 60o rotation are shown. Note that the 2θ angles (60o and 120o respectively) are measured from the line (diameter) determined from the initial element.

Mohr plot for an element having positive σx and negative σy. The initial element (green) is rotated counterclockwise 30o (yellow) and 60o (blue). Top right panel shows the rotation data. Maximum and minimum stress values, and the values for the principal stresses σ1 and σ2 (red dots) are highlighted.

Mohr plot for an element having positive σx and negative σy. The initial element (green) is rotated counterclockwise 30o (yellow) and 60o (blue). Top right panel shows the rotation data. Maximum and minimum stress values, and the values for the principal stresses σ1 and σ2 (red dots) are highlighted.

Important information contained in the plot:

  • As with the first example, we can read the maximum and minimum normal and shear stress values and identify the maximum and minimum principal stresses σ1 and σ2 respectively (red dots).
  • Importantly, we can visualize the changes in shear stress as the elements rotate – this is critical data if we are concerned about the stability or potential failure of some structure.
  • The locus of the y-face normal stress is interesting; initially it is in compression, but during rotation it becomes extensional (blue element).
  • It is important to remember that these elements are rotating within an ambient stress field that does not change – only the stress components of the elements change.


Other posts in this series

Beds and bedding planes

Measuring dip and strike

Solving the three-point problem

The Rule of Vs in geological mapping

Plotting a structural contour map

Stereographic projection – the basics

Stereographic projection of linear measurements

Stereographic projection – unfolding folds

Stereographic projection – poles to planes

Folded rock; some terminology

Faults – some common terminology

Thrust faults: Some common terminology

Strike-slip faults: Some terminology

Using S and Z folds to decipher large-scale structures

Cleavage and cleavage-bedding intersections

The kinematics of deformed rock
Facebooktwitterlinkedininstagram
Facebooktwitterlinkedin

Strike-slip analogue models

Facebooktwitterlinkedininstagram
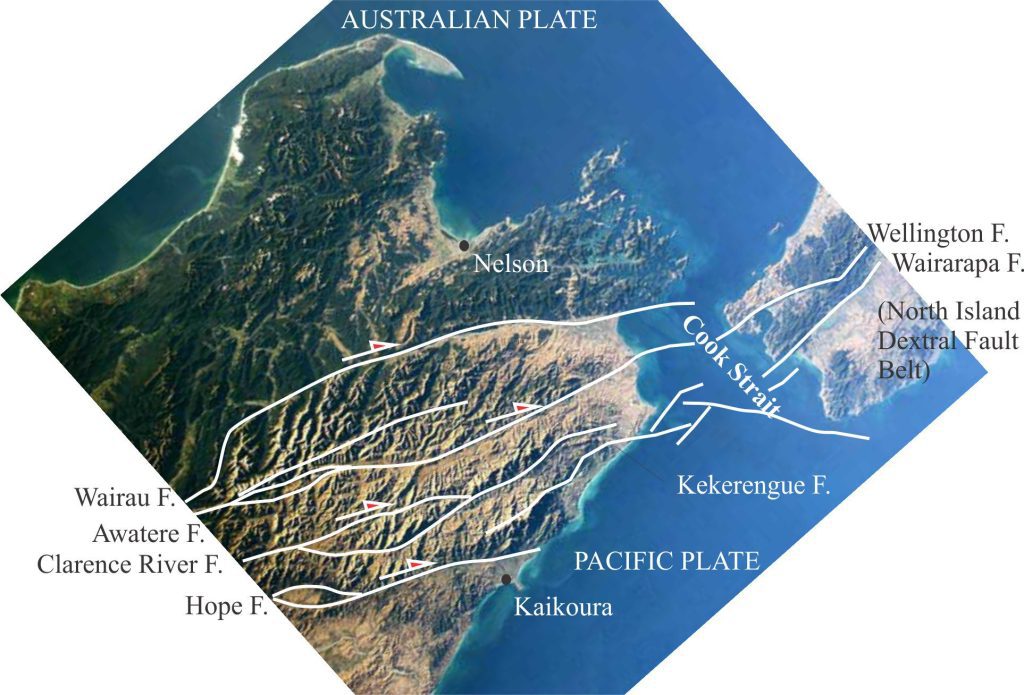
The Marlborough strike-slip fault array extends north from the dextral Alpine Fault transform; faults continue across Cook Strait to join the North Island Dextral Fault Belt in the Wellington region (central Aotearoa New Zealand). In Marlborough and beneath Cook Strait there are several pull-apart basins formed at releasing bend stepovers. Sandbox analogue models can help us decipher the mechanical and kinematic processes that produce structures like these. Base image from NASA – International Space Station 2003.

The Marlborough strike-slip fault array extends north from the dextral Alpine Fault transform; faults continue across Cook Strait to join the North Island Dextral Fault Belt in the Wellington region (central Aotearoa New Zealand). In Marlborough and beneath Cook Strait there are several pull-apart basins formed at releasing bend stepovers. Sandbox analogue models can help us decipher the mechanical and kinematic processes that produce structures like these. Base image from NASA – International Space Station 2003.

Sandbox analogue models of strike-slip basins and pop-up structures

How things have changed. It wasn’t that long ago that numerical and analogue structure and stratigraphy models were considered an interesting, sometimes useful add-on to empirical and theoretical studies. Now they are almost de rigueur, and for good reason. Both model methods provide unique views of the processes involved in rock deformation and stratigraphic architecture, so long as we account for model scaling and imposed boundary conditions.

The focus in this post is strike-slip analogue models, but the experimental methods, apparatus, and Earth materials can be used in any deformation analogue modeling.

Strike-slip structural domains

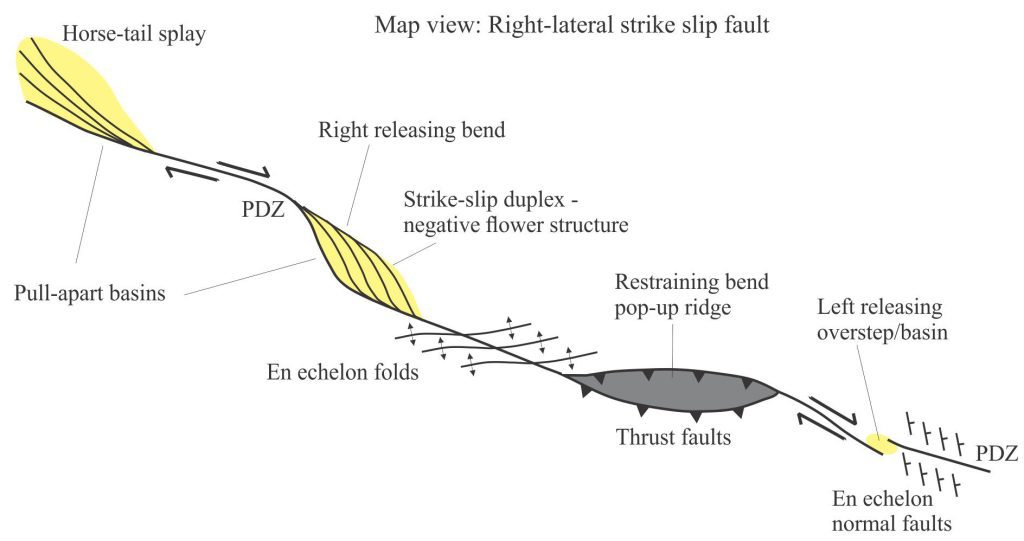
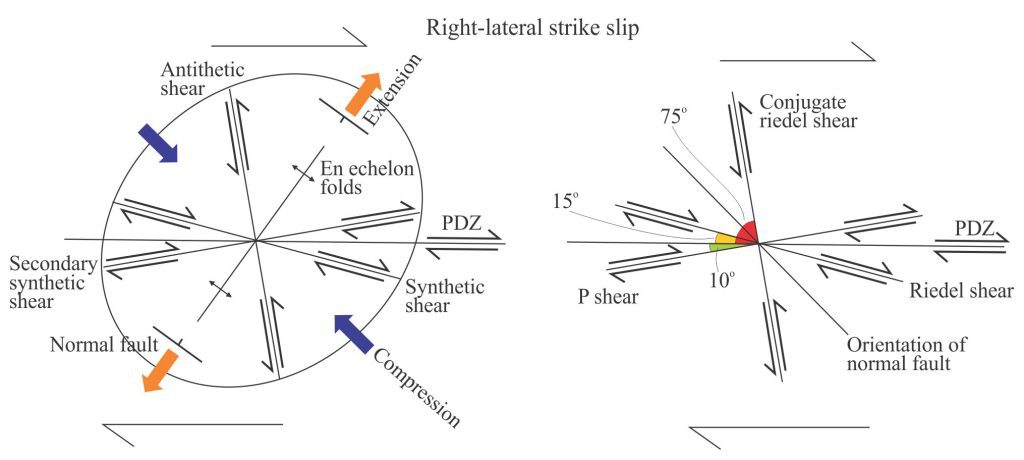
Deformation along a strike slip fault, or strike-slip – transform fault zone usually occurs at fault bends or splays in the principal deformation zone (PDZ).  Deformation is manifested as dip-slip and strike-slip fault splays (for example flower structures), secondary faults that are synthetic and antithetic to the PDZ, en echelon folds, uplifts at restraining bends, and pull-apart basins at releasing bends (see the seminal paper by John Crowell, 1974 on the San Andreas transform fault, and the SEPM volume edited by Biddle and Christie-Blick, 1985 for excellent descriptions). The general disposition of these structures and the stress-strain relationships amongst them are well documented from modern and ancient strike-slip domains.

Some of the more common structures associated with strike-slip faults, modified from Biddle and Christie-Blick, 1985, op cit., Fig.3.

Some of the more common structures associated with strike-slip faults, modified from Biddle and Christie-Blick, 1985, op cit., Fig.3.


The strain ellipse is a convenient way to show the relationship between structure and the principal axes of extension and compression, with respect to the master strike-slip fault (PDZ- Principal deformation zone). There are two terminological conventions: the general terms synthetic – antithetic apply to almost any conjugate fault system; the sense of displacement along synthetic faults is the same as the PDZ, and opposite for antithetic structures. The Riedel shear terms apply specifically to strike-slip faults. The examples here are for right-lateral (dextral) strike-slip displacements. Modified from Biddle and Christie-Blick, 1985, op cit.; Allen and Allen, 2013.

The strain ellipse is a convenient way to show the relationship between structure and the principal axes of extension and compression, with respect to the master strike-slip fault (PDZ- Principal deformation zone). There are two terminological conventions: the general terms synthetic – antithetic apply to almost any conjugate fault system; the sense of displacement along synthetic faults is the same as the PDZ, and opposite for antithetic structures. The Riedel shear terms apply specifically to strike-slip faults. The examples here are for right-lateral (dextral) strike-slip displacements. Modified from Biddle and Christie-Blick, 1985, op cit.; Allen and Allen, 2013.

Analogue models of strike-slip faults

There is now a broad selection of published models that represent variations on the general strike-slip theme:

  • Models with single and multilayered stratigraphy.
  • Models with strong and weak layers such as sandstone – shale (e.g., Zwaan et al, 2022, OA).
  • Models with basal ductile layers representing salt, or the basal crust – upper mantle transition (e.g., Smit et al., 2008, PDF).
  • Models representing pure strike-slip, transtension and transpression (e.g., Gabrielsen et al., 2023, PDF).
  • Models with evolving plate trajectories (strike-slip, extension, contraction – e.g.,Farangitakis et al., 2023, PDF).

Four examples that are representative of these model types are summarized in the following table.

Examples of the experimental setup and rheological conditions for basin- and crustal-scale strike-slip analogue models.Model 1: McClay and Bonora, 2001. Model 2: Wu et al., 2009. Model 3: Farangitakis et al., 2020, op cit. Model 4: Gabrielsen et al., 2023, op cit.

Examples of the experimental setup and rheological conditions for basin- and crustal-scale strike-slip analogue models.
Model 1: McClay and Bonora, 2001.
Model 2: Wu et al., 2009.
Model 3: Farangitakis et al., 2020, op cit.
Model 4: Gabrielsen et al., 2023, op cit.

I have chosen two published examples that are excellent representatives of basic strike-slip fault kinematics and basin formation: Pop-up topography formed during pure strike-slip restraining bend deformation (McClay and Bonora, 2001), and pull-apart basin formation during transtensional displacement (Wu et al., 2009) – model items 1 and 2 respectively in the table above.


Model apparatus

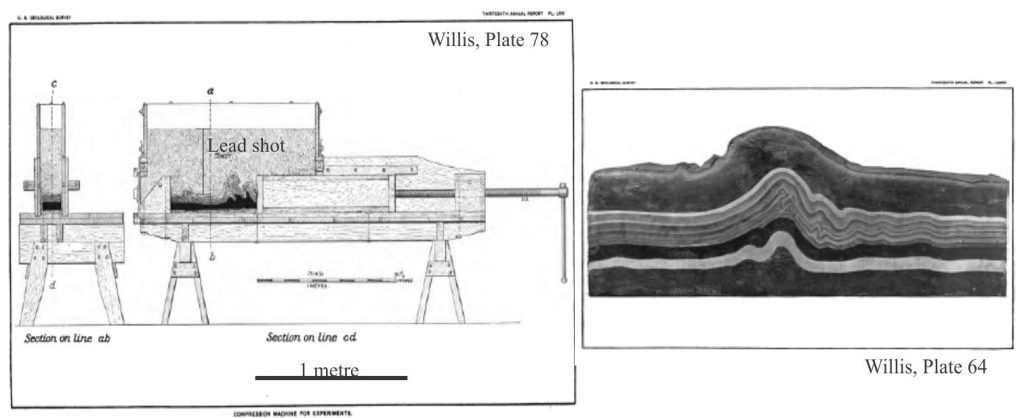
The sand box designs used today for structural analogue experiments are little different from those constructed by Cadell (1889, PDF) and Willis (1894, PDF) – rectangular, open-topped boxes with movable and/or fixed basal plates, and movable or fixed walls. The moving parts are usually driven by simple worm screws, that in modern experiments are computer controlled such that displacement and deformation rates can be varied and monitored accurately.

The geometry of the boundary between movable and fixed base plates predetermines the style of deformation produced. For example, in strike-slip systems, releasing and restraining fault step-overs are built into the contact between the two plates. The boundary in the Gabrielsen et al., model (diagram below) represents the transition between continental and oceanic crust – the boundary geometry determines the structural response to the stress regimes they impose on the model.

Three examples of analogue experiment ‘sand boxes’. Modern boxes are basically the same as the device constructed by Henry Cadell (Left). Cadell’s experiments investigated the formation of folds under compression, and in his model one of the walls was movable. In most strike slip experiments the walls are fixed. Strike-slip is generated at the boundary between movable and fixed base plates; the shape of the base-plate boundary determines the style of deformation. In the Wu et al., model the boundary is oriented at 5o to the direction of motion induced by the motors, to represent transtension. In the Gabrielsen et al., model, the boundary is shaped to approximate the real boundary between the Barents shear margin and oceanic crust.

Three examples of analogue experiment ‘sand boxes’. Modern boxes are basically the same as the device constructed by Henry Cadell (Left). Cadell’s experiments investigated the formation of folds under compression, and in his model one of the walls was movable. In most strike slip experiments the walls are fixed. Strike-slip is generated at the boundary between movable and fixed base plates; the shape of the base-plate boundary determines the style of deformation. In the Wu et al., model the boundary is oriented at 5o to the direction of motion induced by the motors, to represent transtension. In the Gabrielsen et al., model, the boundary is shaped to approximate the real boundary between the Barents shear margin and oceanic crust.

The choice of materials filling the boxes depends on the rheological behaviour being examined:

  • Dry sand represents brittle behaviour.
  • Silicone putty represents ductile behaviour (flow, folding), for example salt layers, or ductile lower crust – upper mantle lithologies.
  • PDMS (a more fluid silicone polymer than the putty) or syrup can also be used to represent ductile flow.
  • Sand mixed with PDMS (also called kinetic sand) will produce materials that are slightly more cohesive (viscous) and ductile than dry sand.

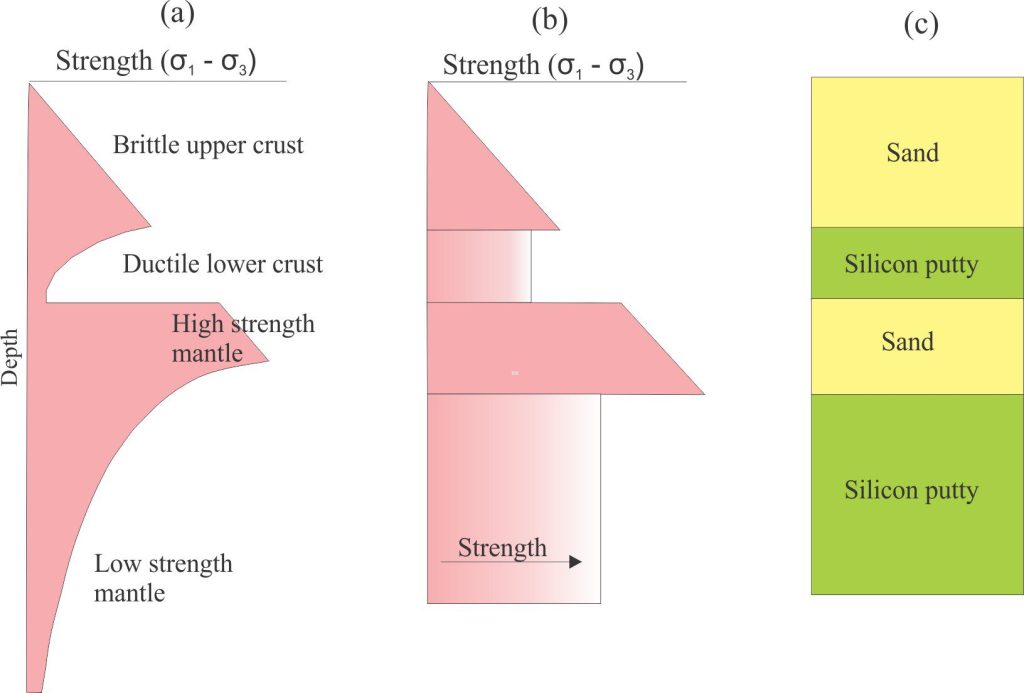
The layering order and thickness in which different materials are added to a sand box is also a strong determinant of structural style. For example, a single layer of sand will demonstrate only brittle failure, whereas interlayered sand and kinetic sand or silicone putty will also produce stretching or folding. Silicone putty is usually laid as a sheet. Dry sand is added by sieving to ensure an even distribution. Sand is commonly added to the top of the model as deformation progresses to represent synkinematic (syntectonic) sedimentation. Coloured sand layers are used as stratigraphic and structural markers. Markers can also be added to the model surface in grid patterns to provide real-time views of deformation and kinematic pathways.

Experiments are concluded by saturating the materials with a water-soluble gel so that the deformed mass can be serial sectioned for 3D reconstruction.


Restraining bend step-over model

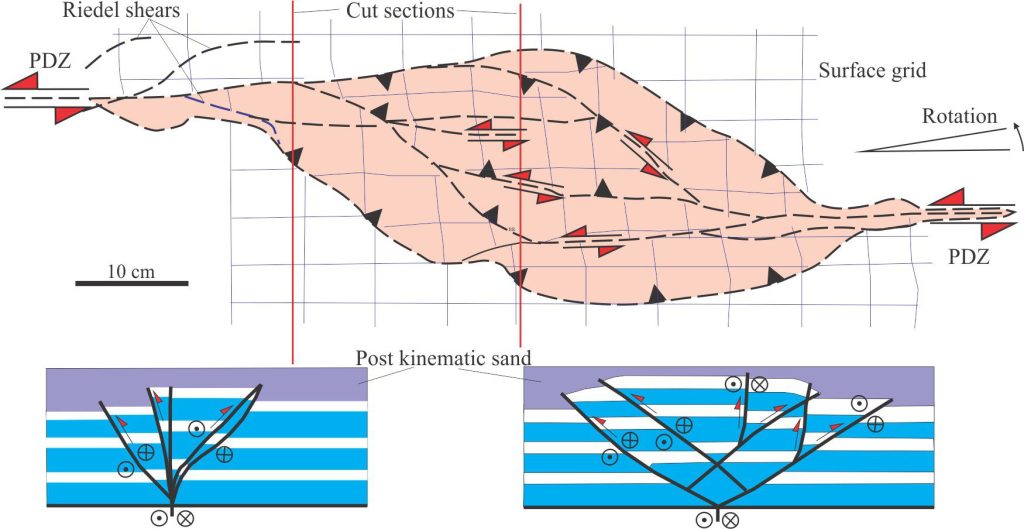
Ken McClay and colleagues were some of the first to experiment with strike-slip analogue models (McClay and Dooley, 1995). Their goal in the chosen example was to model the topographic and structural response to the compression generated at restraining bend step-overs during pure strike-slip displacement. The geometry and displacement vectors for the antiformal pop-up structures and faults were determined for three sets of experiments at step-over angles of 30o, 90o, and 150o. Fault displacement vectors were determined from the surface grid and cross-sections. Results for the 30o set of models are summarized, thus:

Sketch showing the topographic surface at the end of restraining bend deformation after 10 cm of pure strike-slip base plate displacement. The initial stepover angle was 30o. Resulting strain has been partitioned into several oblique slip, reverse faults – the strike-slip component of displacement is the same sense as the PDZs (sinistral). Larger faults are mechanically linked to the PDZs. The main part of the antiformal pop-up structure has been rotated 6o counterclockwise. Layering depicted in the two cross-sections has been simplified from the published examples. The faults form a characteristic positive flower structure close to the left PDZ and are more fan-shaped in the antiform popup centre. Both diagrams redrawn from McClay and Bonora, 2001 op cit., Figures 3e and 4.

Sketch showing the topographic surface at the end of restraining bend deformation after 10 cm of pure strike-slip base plate displacement. The initial stepover angle was 30o. Resulting strain has been partitioned into several oblique slip, reverse faults – the strike-slip component of displacement is the same sense as the PDZs (sinistral). Larger faults are mechanically linked to the PDZs. The main part of the antiformal pop-up structure has been rotated 6o counterclockwise.
Layering depicted in the two cross-sections has been simplified from the published examples. The faults form a characteristic positive flower structure close to the left PDZ and are more fan-shaped in the antiform popup centre. Both diagrams redrawn from McClay and Bonora, 2001 op cit., Figures 3e and 4.

  • Strike-slip displacement at restraining bends results in shortening, uplift, and oblique slip, reverse fault arrays.
  • Pop-ups have broad antiformal geometry. In map view they are sigmoidal to rhomb-shape.
  • Riedel shears formed early in the deformation, linked to the PDZ at both ends of the pop-up.
  • The pop-up structure is bound by two oblique slip reverse faults having sinistral displacement – the same as the main PDZ. They are the primary detachments for the pop-up, linking with the PDZ. Strain is also partitioned along several smaller, internal faults that have similar displacement vectors and are mechanically linked to these detachments.
  • Fault arrays near the transition with the PDZs have characteristic positive flower structures (and contrast with the releasing bend models). The arrays are more fan-shaped in the centre of the pop-ups.
  • The central part of the model rotated 6° counterclockwise.


Releasing bend step-over model

This set of experiments examined basin pull apart and faulting under pure and oblique extension (transtension) across a releasing bend stepover (Wu et al., 2009, op cit.).

In real pull-apart systems, strain is distributed through the crust and within the basin fill during fault displacement and basin subsidence. This is manifested as progressive shingling of sedimentary packages (see the original description of this process by Crowell, 1974, op cit.), and by folds and faults within the stratigraphic fill and basin margins (e.g., flower structures). These conditions are duplicated in the model using a thin rubber sheet beneath the plate boundary (to maintain extensional stress), and placement of a thin sheet of silicone polymer above the base plates to represent ductile lower crust. To generate oblique-slip in this model, the boundary between fixed and mobile base plates must also be oblique – i.e., at an angle to the extension direction induced by the motors. This configuration is shown in the diagram above (only the transtension model is shown here).

Left: Surface map view of the pull apart depocentre and fault arrays after 6 cm displacement, prior to post-kinematic sediment addition. The trend of the PDZ is 5o to the imposed displacement vectors. The main depocentre is segmented by a central oblique slip fault. The basin sidewalls are formed by linked, en echelon faults having sinistral displacement vectors - the same sense as the PDZ. The region between the sidewall and outer faults also shows a small amount of subsidence. Right: Cross-sections at locations A and C show the fault geometry for the PDZ and central basin respectively. The uppermost layer of sand (mauve) is post-kinematic. Both diagrams redrawn from Wu et al., 2009, Figure 7a panels A and C at 6 cm displacement, and Figure 7b.

Left: Surface map view of the pull apart depocentre and fault arrays after 6 cm displacement, prior to post-kinematic sediment addition. The trend of the PDZ is 5o to the imposed displacement vectors. The main depocentre is segmented by a central oblique slip fault. The basin sidewalls are formed by linked, en echelon faults having sinistral displacement vectors – the same sense as the PDZ. The region between the sidewall and outer faults also shows a small amount of subsidence. Right: Cross-sections at locations A and C show the fault geometry for the PDZ and central basin respectively. The uppermost layer of sand (mauve) is post-kinematic. Both diagrams redrawn from Wu et al., 2009, Figure 7a panels A and C at 6 cm displacement, and Figure 7b.

Summarizing the results:

  • The transtensional basins were wider than those developed during pure strike-slip.
  • Transtensional basin margins were cut by en echelon extensional faults.
  • The faults are either oblique slip or dip slip (cf. the predominance of reverse faults in the transpressional model).
  • Pure strike-slip pull-parts had a single depocenter, but the transtensional basins had two opposing depocenters.
  • Cross-basin strike-slip faults in the transtensional models separate the two depocenters.
  • In both sets of experiments, the first manifestations of deformation are Riedel shears above the PDZ, and with continued extension, these formed en echelon arrays that linked the PDZ step-over.
  • Oblique dip-slip basin wall faults continued to grow during extension– these formed the boundaries of basins in both the pure and oblique strike-slip experiments.
  • Sidewall faults in pure strike-slip models are a single strand; in the transtensional models they are segmented, consisting of low angle, en echelon arrays.
  • All major oblique dip-slip faults were mechanically linked to the primary PDZ.
  • In both the pure strike-slip and transtension model sets, the fault arrays formed negative flower structures – relatively simple in the pure strike-slip experiments, but more complex in the transtensional models.
  • Faults above the PDZs were close to vertical; those above the stepover were slightly shallower.
  • The overall configuration of displaced strata in 2D cross-sections is synformal (opposite that in the transpressional model).


Comparisons with modern basins

Overall, the modeled structural configurations at restraining and releasing strike-slip fault stepovers are remarkably similar to modern real-world systems. The comparison applies to basin shape and the mechanics of the fault arrays. Incorporation of synkinematic deposition in the releasing bend pull-apart models successfully reproduces the stratigraphic relationships with active faulting at the basin margins and within the basin fill.

Restraining bend popups tend to be rhomb-shaped and bound by oblique slip reverse faults that tend to flatten upwards into positive flower structures. Faulting produces broad antiforms that in some examples are doubly plunging (towards each PDZ).  Larger, through-going faults are mechanically and kinematically linked to the PDZs. Real world popup structures will be subject to erosion – this was not incorporated into the models.

McClay and Bonora (2001, op cit.) cite examples of restraining bend and thrust faulted popup structures along the San Andreas fault system and Atacama Fault System (northern Chile), where there are reasonable comparisons between modeled and real flower or palm tree fault arrays and antiformal stratal geometry.

Releasing bend pull-apart basin models also show good comparison between basin configuration and fault geometries with real world examples. The Gulf of Elat basin is located on the same transform as Dead Sea but displacement vectors change from one basin to the other – relatively pure strike-slip associated with Dead Sea, and sinistral displacement having 5o obliquity to the strike of the Elat basin. Like the modeled examples, the Gulf of Elat basin sidewall faults are partitioned into en echelon fault arrays. The Gulf example also has 4 main depocentres where the basin is partitioned by internal dip-slip faults.

The comparisons between pure and oblique strike-slip basins also appears to be compatible with the Marlborough Fault system in Aotearoa New Zealand, where strain on the Alpine transform is partitioned into several dextral strike-slip faults in the northern part of South Island. Here, examples of pure and oblique releasing bend basins occur and in general those undergoing oblique displacement are bound by arrays of overlapping faults, whereas basins associated with pure strike-slip are bound by single sidewall fault strands.


Model limitations

McClay and Bonora (2001, op cit.) note some of the limitations that model conditions impose on the resulting structures and basin form – most of these caveats apply to other analogue model types.

  • No account is taken of thermal effects, that potentially have a strong influence on material viscosity and ductility.
  • The isostatic effects of crustal loading and unloading are not incorporated into the models.
  • Most models are one or two layers thick. This usually means that models are rheologically isotropic. However, real world rock sequences usually show much greater rheological variability which means significantly greater variability in styles of deformation than those witnessed in the models.

Other posts in the series on geological models

Geological models: An introduction

Model dimensions and dimensional analysis

Analogue models

Analogue models of faults: scaling the materials


Facebooktwitterlinkedininstagram
Facebooktwitterlinkedin

Analogue structure models: Scaling the materials

Facebooktwitterlinkedininstagram
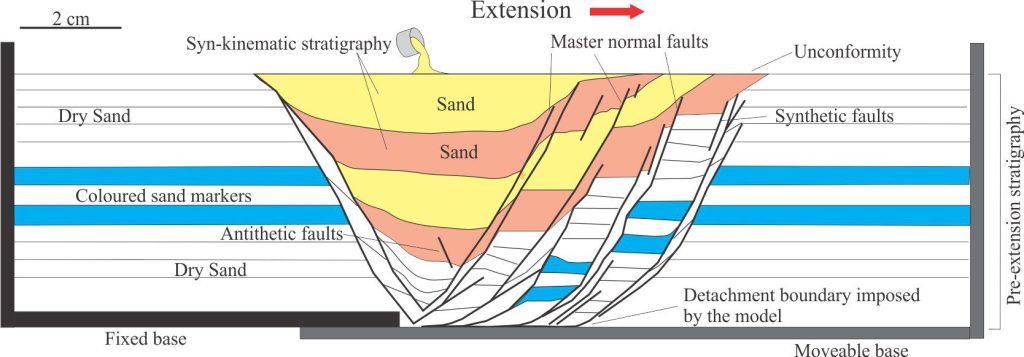
Scaled sand-box experiments are an ideal medium to observe rock deformation that, in this example, involves synkinematic deposition during rift-like crustal extension. The choice of model materials, in addition to imposed boundary conditions such as strain rates, will determine the outcome of the experiment. Dry sand was chosen for this model because its brittle behaviour under the model conditions is a good representation of natural rock failure. Diagram modified slightly from Eisenstadt and Sims, 2005, Figure 3a.

Scaled sand-box experiments are an ideal medium to observe rock deformation that, in this example, involves synkinematic deposition during rift-like crustal extension. The choice of model materials, in addition to imposed boundary conditions such as strain rates, will determine the outcome of the experiment. Dry sand was chosen for this model because its brittle behaviour under the model conditions is a good representation of natural rock failure. Diagram modified slightly from Eisenstadt and Sims, 2005, Figure 3a.

This post deals with the materials, their rheological behaviours, and scaling as they apply to analogue structure models.

Rock deformation

Two of the most common structures generated by rock deformation are faults (and fractures) and folds. The rheological conditions for each are fundamentally different: faults and fractures result from brittle behaviour, whereas folds require materials to act more like plastics with ductile behaviour. Both styles represent deformation conditions beyond the elastic limits of the material involved. For example, hard granite at near surface conditions will exhibit brittle behaviour at high strain rates (confining pressures will be low), but at depth may act in a ductile manner at lower strain rates and high confining pressures (and elevated temperatures). How rocks and sediments behave under stress depends on:

  • Lithology and grain/crystal composition and size. The compressive strength of limestone is commonly less than that for quartz arenites because of the propensity for calcite-dolomite crystal cleavage.
  • Stress magnitude and orientation. For example, is the principal stress due to lithostatic load, or are there deviatoric and differential stress components?
  • Confining pressures – compressive rock strength increases with depth and confining pressure.
  • Temperature.
  • Viscosity, that depends on lithology, temperature, and strain rate.
  • Preexisting anisotropies (fabrics or structures), such as older fracture networks, crystal or grain alignment, metamorphic foliation, and sedimentary stratification.

Rock strength is one measure that accounts for some of these variables; it is a measure of the maximum uniaxial stress at the point of material failure. Failure in this context is usually expressed as a function of the internal cohesion, or cohesive strength, and the internal angle of friction (φ)that for many Earth materials is about 30o to 35o. The SI unit of rock strength is the Pascal (Pa), or megapascal (MPa – dimensions ML-1T-2). Rock strength is defined for tensile and compressional conditions, but for most geological systems where deformation occurs at depth within the crust, compressive strength exceeds tensile strength. Furthermore, the dominant mode of failure is by shear.

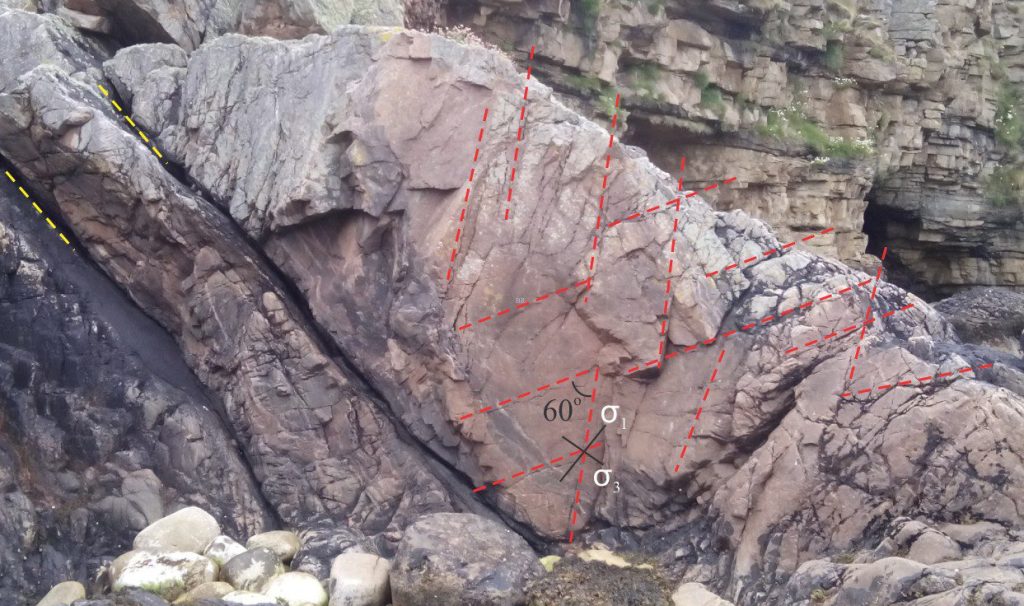
Fracture sets in Old Red Sandstone, Portskerra (N Scotland) – the outcrop face is almost vertical. Red dashed lines follow conjugate fracture sets at a reasonably consistent 60o separation. The dashed yellow lines indicate bedding plane parting that is approximately parallel to σ3 – bedding dips 50o. The point of rock failure in generating these fractures corresponds to the rock peak friction, with a friction angle of 30o (see discussion notes below).

Fracture sets in Old Red Sandstone, Portskerra (north Scotland) – the outcrop face is almost vertical. Red dashed lines follow conjugate fracture sets at a reasonably consistent 60o separation. The dashed yellow lines indicate bedding plane parting that is approximately parallel to σ3 – bedding dips 50o. The point of rock failure in generating these fractures corresponds to the rock peak friction, with a friction angle of 30o (see discussion notes below).

For almost two centuries, analogue modeling of fault (and fold) systems has focused on rifts and inverted rifts, fold – thrust belts and orogenic wedges at convergent plate margins, and strike-slip fault arrays at transcurrent or oblique transcurrent margins. Here are some excellent reviews of analogue models for geodynamic systems (Shellart and Strak, 2016),  rifting and salt mobilization (Zwaan and Schreurs, 2022), and orogenic wedges (Graveleau et al., 2012).


What are these structure models attempting to do?  

Fundamentally, the models allow us to glimpse processes that under normal geological conditions of time and space we cannot observe. If we scale the model variables correctly, there is a good chance we will answer some of the questions about how these systems operate. For example, the master extensional faults in rift systems are usually accompanied by networks of synthetic and antithetic fault arrays that form at different stages of rifting and sedimentation in fault-bound basins. Analogue models can help us visualize the overall distribution of strain by teasing out the relative timing, orientation, and magnitude of the fault arrays and the displacement of syn-rift stratigraphy. To do this, the model materials need to be appropriately scaled to natural examples.


Material rheology

Structure model construction requires materials that are scaled to represent brittle and ductile rheological behaviour, plus behaviours in between these two end-member types. Analogue models built to examine fault initiation and evolution are usually layered – layering can reflect broad stratigraphic ordering of a sedimentary basin, or at larger scales, the layering of lithosphere crust and mantle. The order in which layers of different rheology and thickness are laid down in a model will influence the style of deformation; ductile layers that are prone to folding or flow may affect the distribution of strain in underlying and overlying brittle layers.

The chosen materials must also suit the modeled deformation mechanism. Models that represent diapirism of salt or igneous melts will require viscous materials that flow and have buoyancy contrasts with surrounding rock-material. The reverse buoyancy problem exists for lithosphere-scale models that represent subduction. The energy required to drive these experiments comes from within the models and is manifested as positive or negative buoyancy.

Materials having fundamentally different rheologies are required to model rifted upper crust and synrift sedimentation, where compressive or tensile stresses dominate, and where buoyancy and inertial forces are negligible (although this generalization is complicated where synkinematic salt is deposited). In these experiments, the energy to drive compression-extension originates outside the model, for example, from a worm-screw driven plate at one end of the model container.


Common model materials

One of James Hall’s first experiments on folding of stratified rock used cloth layers (Hall, 1815). One can imagine Hall at his dinner table, watching the tablecloth deform as plates were moved from diner to diner, and intuiting the analogy with folded rock he had observed in the field. His later experiments used layers of granular and viscous materials, as did many subsequent experimentalists (Caddell, 1889 (see also Butler et al., 2020 ; Willis, 1894;   Hubbert, 1934).
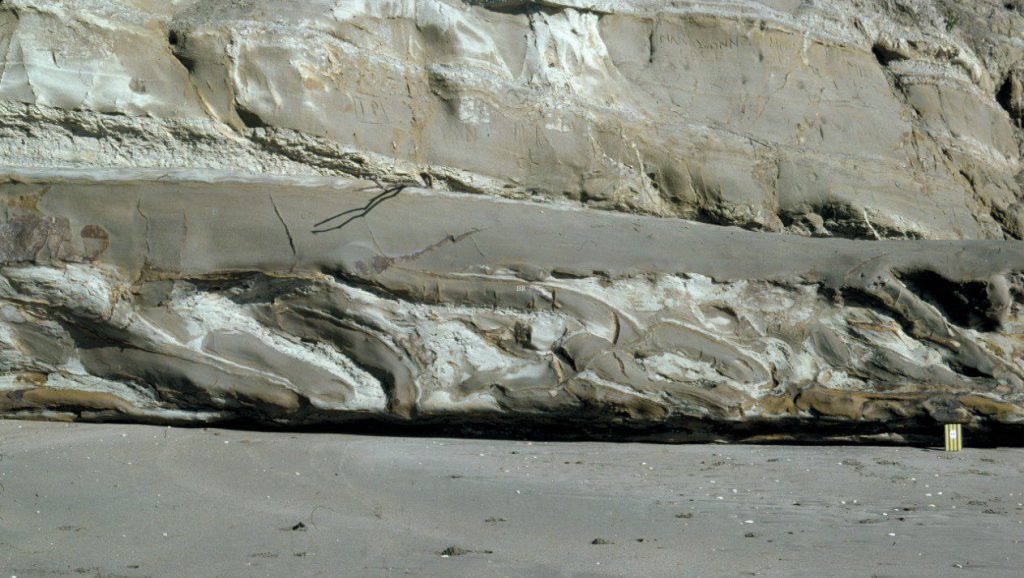
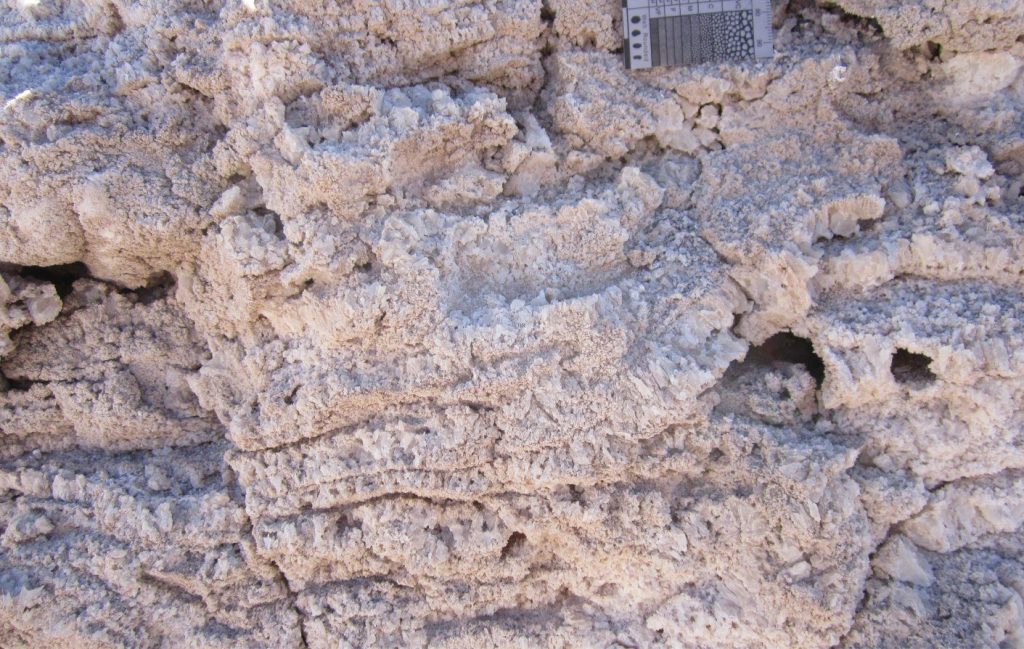
Except for the silicon polymers, the materials used by recent experimentalists have changed little from these early pioneering days – the difference is that we now have a good understanding of material properties in relation to their rheological behaviour.  Some commonly used materials and their properties include:

  • Well sorted, dry, quartz and feldspar sands (brittle behaviour, low cohesion). Bulk densities range from 1.56 g.cm-3 (quartz sand) to 1.3 g.cm-3 (feldspar) (bulk density is less than the mineral density). Mean peak friction coefficients are 0.5 – 0.6 and friction angles are 31o-36o. Some studies have assumed that dry sand is cohesionless, but repeated lab analyses show that mean peak cohesion ranges from 10-140 Pa.
  • Corundum/magnetite sands, commonly used as marker layers (brittle behaviour). Bulk density about 3.3 g.cm-3.
  • Wet clay – also used for brittle failure and has cohesive strength slightly higher than dry sand (Eisenstadt and Sims, 2005). Density depends on water content – commonly ~1.6 – 1.8 g.cm-3. Peak cohesion up to 100 Pa.
  • Kinetic sand (adding a touch of viscosity with 1% -2% silicon polymers). Either quartz or corundum mixtures. Viscosity varies with density (% polymer) and ranges from about 4 x 10⁴ to 105 Pa.s
  • Gelatins (visco-elastic to brittle rheology in the gel state depending on strain rates and confining pressures) (Kavanagh et al., 2013)
  • Silicone putty (a viscous polymer representing ductile behaviour). Viscosity 104 to 105s.
  • PDMS (polydimethylsiloxane) – a more fluid silicone polymer. Density 0.98 cm-3 and a viscosity around 1.6 x 10⁴ Pa.s.
  • Syrup (sugar, honey – low viscosity ductile flow). Viscosities <1 to 20 Pa.s.

Material properties

Faulting in the brittle upper crust generally obeys the Coulomb criterion for failure and frictional sliding, and is written as:

τ = C0  + Tanφ σN    where τ is the shear stress at the point of failure, C0 is the rock cohesive strength, φ is the internal friction angle, and σN  is the normal stress.
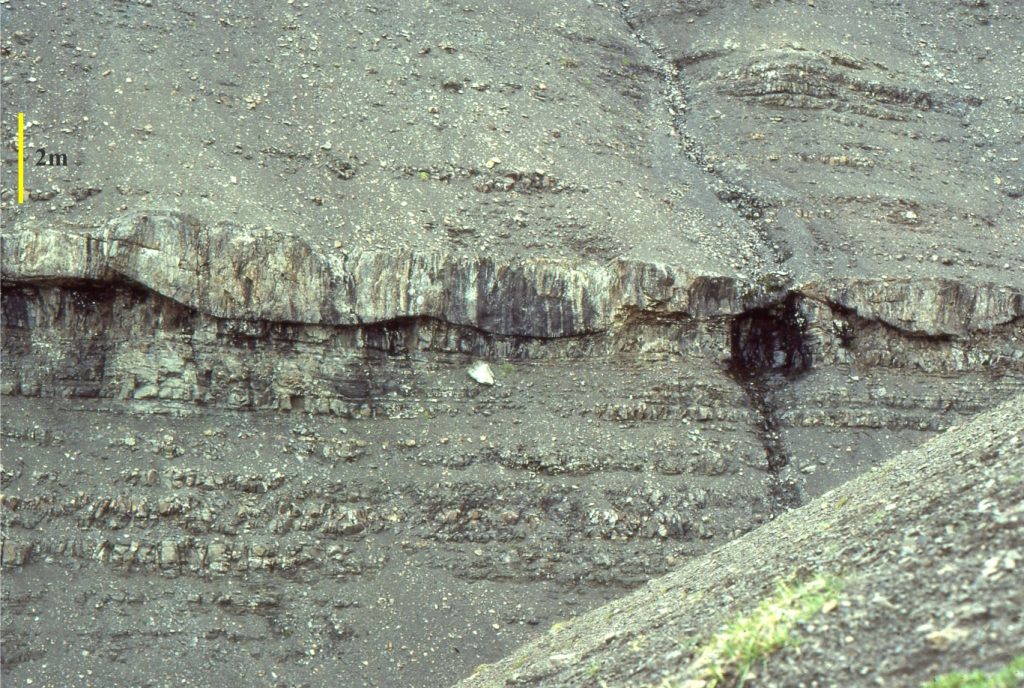
The same empirical relationship should also hold for models and model materials (to be consistent with the rules of similarity).  The Coulomb function emphasizes the variables we need to scale such that the ratios between model variables and natural variables are similar – for example, C0 model/ C0 real Lengthmodel/ Lengthnatural.


Model variables that map brittle behaviour

Tan φ: This is the friction factor, or friction coefficient – it is dimensionless, usually written as

                                   τ = C0  + γσN  where, for rock materials, γ is the coefficient of internal friction and is the ratio of the frictional force to normal force – it depends primarily on surface roughness. Thus, γ is zero for a frictionless, smooth, or lubricated surface. For most rock materials γ is 0.6 – 0.7. The presence of clays, or mica-lined schistose foliation will tend to lower the values of γ.
C0 – Cohesion (Cohesive strength): (Dimensions ML-1T-2). C0 is a function of material density, the acceleration due to gravity, and a length dimension. Bulk densities are well within an order of magnitude of real rock densities, the gravitation constant is the same for model and the real world, and lengths commonly scale from 10-4 to 10-6 (at 10-6 one cm scales to 10 km). If the Coulomb criterion is to apply to the models, then the cohesive strength must also scale to 10-4 to 10-6.
φ – friction angle: (dimensionless). A good analogy for representation of the internal friction angle (φ) is the angle of repose for dry, well-sorted sand; the actual value is about 34o. If the slope increases it becomes gravitationally unstable and grains will slide or tumble downslope until the repose angle is re-established – in other words, the granular material shears. This basically is the model applied to failure of harder rock where shear is caused by differential normal stresses.
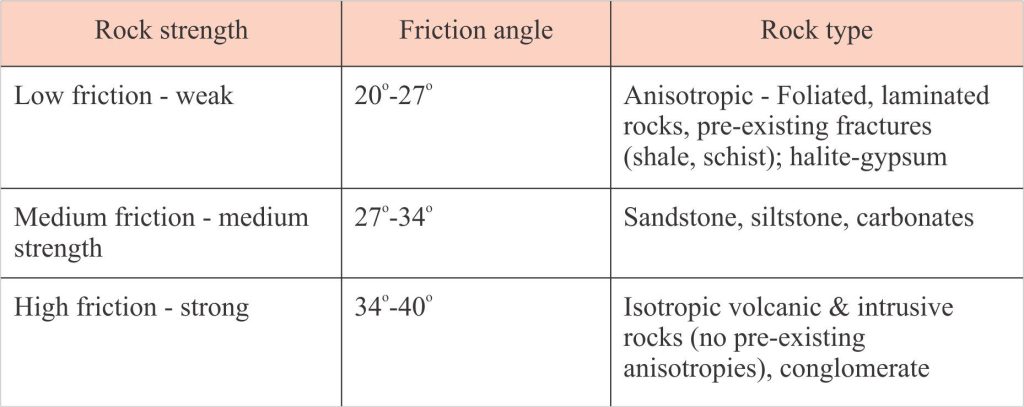
Friction angles for different rock types and rock strengths, from Wyllie and Norrish, 1996. Table 14-1.

Friction angles for different rock types and rock strengths, from Wyllie and Norrish, 1996. Table 14-1.

Viscosity – mapping ductile behaviour

 This is one of the fundamental measures for materials where ductile behaviour is important. Viscosity is dependent on temperature and strain rate, and testing is done at specified values of these variables. Silicone putty is commonly used in fault models to represent shale or salt that are inter layered with brittle lithologies. It is also used as a basal layer of models that represent salt flow or more ductile behaviour deeper in the crust and mantle lithosphere.

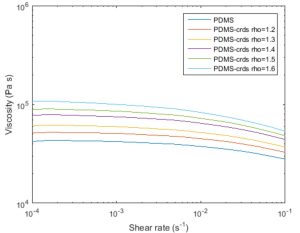
Kinetic sand is a mixture of either quartz or corundum/magnetite sand and about 2% silicone polymer (polydimethylsiloxane, or PDMS). The polymer adds a degree of cohesion and viscosity to the mix, that represents rheological behaviour somewhere between brittle and ductile. PDMS has a density of 0.98 g/cm3, its viscosity averages 3×10⁴  Pa.s at 23 °C (Konstantinovskaya et al., 2007). PDMS can also be used on its own to represent salt layers (e.g, Ferrer et al., 2023) or ductile mantle lithosphere.  An example of the PDMS viscosity- shear rate relationship is illustrated below.

Lab test plots of viscosity – shear rate for corundum sand – PDMS mixtures at different densities – pure PDMS density is 0.98 g/cm3 (top curve). From Zwaan et al., 2018, Figure 1.

Lab test plots of viscosity – shear rate for corundum sand – PDMS mixtures at different densities – pure PDMS density is 0.98 g/cm3 (top curve). From Zwaan et al., 2018, Figure 1.

Silicone putty (a kind of Silly Putty) is also a viscoelastic silicon polymer that has unique properties in that it reacts elastically if the strain rate is high (e.g., bouncing it off the floor), and as a viscous fluid at much lower strain rates. The latter property makes it ideal for models of deformation involving ductile behaviour. Some of the strain in the deformation models is taken up by folding of the ductile layers. It has a viscosity of about 4×10⁵  Pa.s at 23 °C depending on composition (a bit higher than PDMS). At the experimental strain rates of most models, silicone putty behaves as a Newtonian fluid (i.e., it has no inherent strength and begins to deform immediately stress is applied). Newtonian properties are important in analogue modeling because the behaviour of the materials doesn’t change during the experiment.

Sugar syrups are also used in lithosphere-scale models to represents the asthenosphere-lithosphere boundary. Syrup is also used in experiments where isostatic compensation is modeled (Schmid et al., 2022). Average measured viscosity, depending on composition, ranges from  about 7 Pa to 64 Pa.s


Material scaling

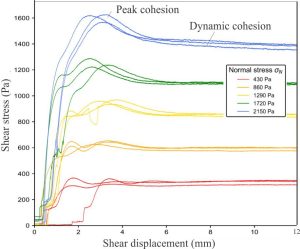
The average values for C0, m, and γ for granular materials used in the models have been determined from repeated lab determinations. Both the friction coefficient and cohesion have measured values that record peak stress conditions at the point of failure – these are recorded as peak cohesion (peak cohesive strength) and peak friction respectively. Dynamic cohesion and dynamic friction represent the plateau on the shear stress curves, that reflect the forces opposing continued motion along a fracture plane; their values are generally lower than those for peak conditions. The example below of shear stress-strain illustrates this relationship.

The average lab determined peak friction coefficients (dimensionless) for quartz sands are about 0.6 – 0.7, which is consistent with measured rock values.

Internal friction angles for the sands are commonly 27o-35o, also consistent with natural rock values.

Lab test results for determining cohesive strength and friction coefficient for quartz sand, at different normal stress values (Pa). The peak and dynamic domains for each quantity are well defined. Note that shear displacement has the same dimensions as strain (L). Modified from Zwaan et al., 2018, Figure 2.

Lab test results for determining cohesive strength and friction coefficient for quartz sand, at different normal stress values (Pa). The peak and dynamic domains for each quantity are well defined. Note that shear displacement has the same dimensions as strain (L). Modified from Zwaan et al., 2018, Figure 2.

Cohesive strengths for most granular materials used in these models range from about 50 Pa to 200 Pa, depending on mean grain size and standard deviation (sorting), and to some extent on the variability of grain shape in natural sands – the use of microspheres can reduce this type of uncertainty. In contrast, the cohesive strength for Earth materials ranges widely from less than 0.1 MPa for soft soils, to >200 MPa for rocks like isotropic granite, marble, and basalt. The range for sandstones is about 50-100 MPa, and < 25 MPa for chalk and salt. If we assume an average value of 60 MPa for sandstones, and 60 Pa for sands used in the models, then the scale ratio is 10-6, which is consistent with the upper end of our length scale.

Viscosity scaling is less obvious, because the scaling factor between ductile materials like silicone putty or PDMS (viscosities in the range 104 to 105 Pa.s) and the average crustal rocks (1018 – 1020 Pa.s) is 10-14 to 10-16. This is hugely different to the 10-5 – 10-6 commonly used for the other scaled variables.

[Scaling factor is the ratio between model variable and natural variable, and hence is dimensionless). It is usually indicated by an asterisk. Dimensionless quantities established for natural systems can be applied directly to analogue models.]

We can solve this apparent dilemma by going back to basic Newtonian mechanics. Newton was the first to demonstrate the empirical relationship between shear stress and the rate of shear deformation, or strain rate, in a fluid. This is expressed as:

                                τ = μ (v/d) where

τ is shear stress, μ is dynamic viscosity, v is velocity and d a length such that v/d is the velocity gradient for shear, also called the strain rate (dimensions of T-1). If the relationship between stress and strain rate is linear, then the fluid is Newtonian. Under the experimental conditions for most analogue models, materials like silicone polymers behave as Newtonian fluids.

We can rearrange this function for viscosity (μ = τ/ (v/d)) and write dimensionless quantities for its variables using scaling factors – a model/natural stress scaling factor (τ *) and a model/natural strain-rate scaling factor ((v/d)*)  and compare the ratio between these two factors and a viscosity scaling factor (i.e., viscositymodel/viscositynatural, or μ*). If the stress factor – strain rate factor ratio equals the viscosity factor, and d is scaled according to other variables in the model, then viscosity is considered to be scaled appropriately (i.e., μ* = τ */(v/d)*). Most modellers who employ ductile materials in their experiments use this method to check the scaling for viscosity (e.g., Davy and Cobbold, 1991; Caniven and Dominguez, 2021; Zwaan et al., 2022.


Afterword

Accounting for variable scaling is an essential part of analogue modeling – get the scaling correct increase the chances of producing model results that mean something, that answer fundamental questions about processes. However, the choice and scaling of model materials doesn’t necessarily ensure model success. Other imposed boundary conditions influence the result:

  • The geometry of the model container, particularly its moving parts that drive extension, compression, translation.
  • The rates of processes like deformation, sedimentation, or base-level change imposed on the model; should rates be linear or variable?
  • Accounting for temperature and geothermal gradients in analogue models is notoriously difficult, and yet for many crustal processes these variables are fundamental. For example, oceanic and continental rifts are commonly accompanied by volcanism and high heat flow. Can we find model materials that are compatible with such conditions where rock viscosity and cohesive strength are scaled appropriately?

Is there value in combining analogue modeling with numerical modeling to help solve some of these problems? At its heart, modeling is a creative scientific exercise that can lead us in unforeseen directions of discovery. Charles Lyell’s dictum The present is the key to the past is an invitation to recreate that past using all the tools at our disposal including using analogue, numerical, and conceptual models. We should continue to RSVP and accept the invitation.

Other posts in the series on geological models

Geological models: An introduction

Model dimensions and dimensional analysis

Analogue models

Strike-slip analogue models

Facebooktwitterlinkedininstagram
Facebooktwitterlinkedin

Model dimensions and dimensional analysis

Facebooktwitterlinkedininstagram
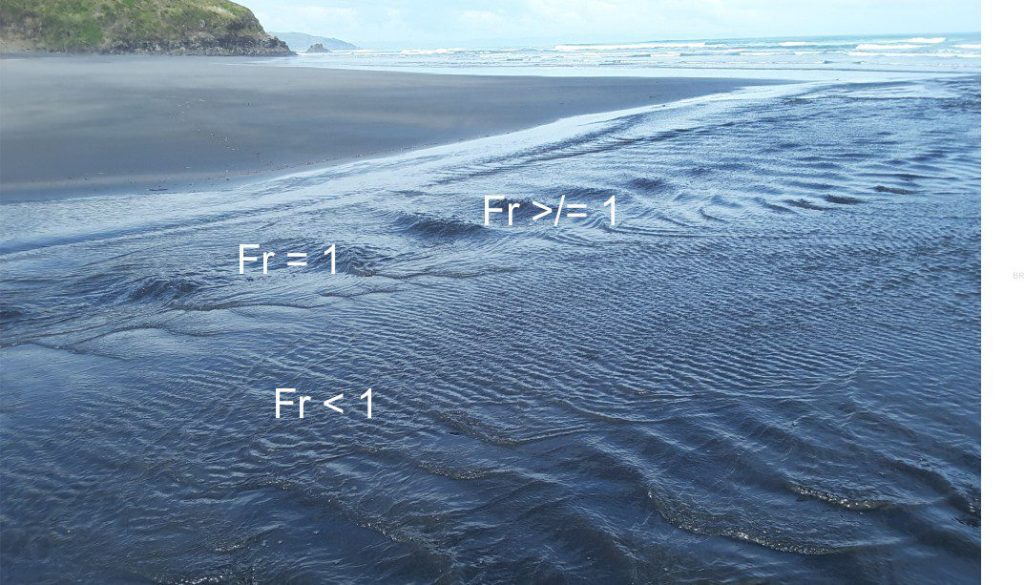
The relationship between inertial and gravitational forces expressed by the Froude number (Fr) is reflected by the changes in surface flows and the formation-decay of stationary (standing) waves. Fr < 1 reflects subcritical (tranquil) flow; Fr>1 supercritical flow. Although the Froude number can be determined experimentally, it can also be eased out of a dimensional analysis of the relevant hydrodynamic variables.

The relationship between inertial and gravitational forces expressed by the Froude number (Fr) is reflected by the changes in surface flows and the formation-decay of stationary (standing) waves. Fr < 1 reflects subcritical (tranquil) flow; Fr>1 supercritical flow. Although the Froude number can be determined experimentally, it can also be teased out of a dimensional analysis of the relevant hydrodynamic variables.

The correct scaling of geometric, dynamic, and kinematic system variables is a critical part of any useful analogue model.

Most physical systems operate with a multitude of variables. The interplay amongst these variables is complicated. System models help us organize the various processes and responses in a way that gives us some understanding about how the systems work. The modeling process itself requires us to reduce the number of variables to some manageable level. Dimensional analysis identifies the important groups of variables and, according to the rules of algebra, express these relationships as equations. Dimensional analysis can help us discover new relationships (as equations) or, if the equations are known a priori, help check their validity.

In any discussion of physical processes there will be inevitable reference to measurable or theoretical quantities such as volume, acceleration, or force. Each of these quantities, or variables has two properties that are independent of their actual numerical values:

  • Units of measure that comply with some recognised system, such as metric (centimetres, grams), imperial (feet, pounds), SI (metres, kilograms) or Babylonian (cubits), and
  • Fundamental dimensions that for most dynamical and mechanical systems includes mass [M], length [L], and time [T]. In some cases, force [F] may be used instead of mass because it is a combination of all three dimensions. Systems that involve other physical or chemical parameters include dimensions like temperature and electrical charge in this list. For our discussion, the [MLT] triad will suffice.

The standard presentation of dimensions is to enclose them in square brackets [ ]. The variables most commonly used in dynamic and kinematic problems include:

Length                         l                       [L]       (e.g., depth, distance, grain diameter)

Area                            A                      [L2]

Volume                        V                     [L3]      (NB. If we define a volume cross-section as unit area, V can be expressed as height or depth [L]

Mass                            m                    [M]

Time                            t                       [T]

Specific weight           γ = ρg             [ML-2T-2]

Density                        ρ = m/V          [ML-3]

Velocity                       v = l/t, or dx/dt  [LT-1]

Acceleration                a = l/t2            [LT-2]

Force                           F = ma             [MLT-2]

Pressure/stress          P = F/A            [ML-1T-2]

Momentum                 p = mv            [MLT-1]

Viscosity          the coefficient μ in the function  μ.dV/dl   [ML-1T-1]


Some rules and advantages governing dimensional analysis

  • Dimensional homogeneity: This applies to equations, where the dimensions must be the same on either side of the equality. This condition was probably first stated by French mathematician Jean-Baptiste Fourier (1768-1830). In a standard algebraic equation, each term must have the same dimensions. For example, the equation of a straight line                 y = mx + c   where gradient m is dimensionless [L/L], and x, c both have dimensions [L], therefore y must also have the dimensions [L].
  • The dimensions of the numerator and denominator in a ratio must be the same.
  • Dimensional integrity must be maintained when converting a variable from one unit system to another system. For example, the SI unit of pressure is the Pascal (Pa) expressed as kg/m.s2 [ML-1T-2], and the imperial unit is pound force/square inch, or force per unit area – with dimensions [MLT-2].L-2, or [ML-1T-2].
  • Some quantities are dimensionless. Angular quantities like degrees and radians have no dimensions – they are numbers. All ratios are dimensionless – porosity is a ratio of volumes, physical strain is a ratio of lengths or volumes.
  • Dimensional analysis gives us a logical way to scale experiments on real world systems and processes in a way that allows us to answer questions about how things work.

The Buckingham pi () theorem

Newton’s laws are fundamentally empirical and expressed in mathematical form as equations. Newton and his contemporaries must have considered the concept of dimensions given the paramount importance of these equalities. However, the utility of dimensional analysis is a relatively modern advance, first encouraged by the British physicist Baron Rayleigh and others in the late 19th C (Bramwell, 2017). The rules of dimensional analysis and scaling are encapsulated in the Buckingham pi theorem. Formal definition of the pi theorem as a set of algebraic rules is attributed to American physicist Edgar Buckingham (On physically similar systems: Illustrations of the use of dimensional equations, The Physical Review Ser.2 v.3-4, 1914),   although some of his predecessors, like Joseph Bertrand may have formulated the procedure as early as 1878. The theorem provides a mathematical method for simplifying the number of variables in a system, so that the system analysis is manageable. The method is an important part of analogue modeling.

The pi theorem is a procedure for identifying dimensionless groups, or products from the system variables. A more formal statement is commonly quoted thus: If there are x variables in a problem and these variables contain y primary dimensions, the algebraic function relating all the variables will have (x-y) dimensionless groups (a procedure also known cumbersomely as nondimensionalization). Each group is a ratio consisting of two or more variables. Buckingham named these pi groups (π1, π2, π3… not to be conflated with the quantity pi). One of the primary goals of dimensional analysis is to establish these pi groups, the procedure for which is best illustrated by an example.


The example of fluid flow through a pipe

We want to derive an expression for the pressure drop that enables fluid flow through a straight pipe. This is a classic problem that in the late 19th C led to an important discovery.

The pipe is straight, with circular cross-section of diameter D. We simplify the problem by assuming the inside of the pipe is smooth (so we don’t have to account for surface roughness). There is a pressure drop (ΔP) over a length l.

  1. We first identify the relevant system variables and their dimensions: D [L], l [L], ΔP [ML-1T-2], mean velocity v [LT-1], fluid density ρ [ML-3], and fluid viscosity μ [ML-1T-1].
  2. We can write the general function for this system as f(D,l, ΔP,v,ρ,μ) = 0
  3. The list contains 6 variables and 3 dimensions. According to the pi theorem (xvariables – ydimensions) there are three dimensionless groups (π1, π2, π3). From the list of variables, we need to identify three that are independent (because we have three dimensions) – such quantities are called repeating variables – repeating variables have dimensions. Independence here means that each variable must not be a multiple or power product of others in the set (e.g., the square or square root). Middleton and Wilcock (1974) also advise that we should not chose variables that are of most interest to the problem – in this case we should not chose ΔP as an independent variable because we want to determine what it is actually dependent on. For example, if we choose D, v, and ρ, the possible combinations (like D/v, ρ/D or v/ρ) do not produce dimensionless quantities. Therefore, all three variables are independent of each other. Note we cannot choose both D and l because the ratio of these two variables will always be dimensionless.
  4. As noted above, the system we have defined has three possible dimensionless groups. To find the dimensionless groups, we need to combine the three independent variables with each of the remaining variables ΔP, l, and μ in turn. For the first pi group we try

            D, v, ρ and ΔP.

  1. Note that the dimensions of any quantities have exponents. For nondimensionality to apply, the sum of the exponents of each dimension (M, L, and T) must be zero. To evaluate the pi groups, we need to assign exponents to the dimensions of each independent variable (exponents a, b, c); we arbitrarily assign the exponent of the dependent variables as 1.

The first pi group is written as:

      π1 = Da vb ρc ΔP1 that, expressed as dimensions is:

      π1 = [L]a [LT-1]b [ML-3]c [ML-1T-2]1

  1. We can now write three algebraic equations that sum the exponents of each dimension in this pi group (each must sum to zero):

For M              c + 1 = 0

For L               a + b -3c -1 = 0

For T               -b -2 = 0

Solving, c = -1,  b = -2,  a = 0 (π1 does not contain an L dimension).

We can now write the π1 in terms of actual exponents:

            π1 = [LT-1]-2 [ML-3]-1 [ML-1T-2]1  that, in terms of the variables is 

           π1 = ΔP/ρ v2

  1. We perform the same calculations for π2 and π3 and get:

          π2 = μ/ρvD and

         π3 = L/D

  1. We can now rewrite the general function for the system as f2 (π1,π2,π3) = 0, that expressed as variables and rearranged is:

ΔP/ρ v2 = f2 (μ/ρvD, L/D) which states that the pressure drop is a function of π2 and π3.

         π2 is usually inverted and becomes ρvD/μ which is the Reynold’s number.

Thus, the pressure drop in the pipe is a function of the Reynold’s number and the ratio of its   length to its diameter.

Dimensional analysis has not only answered the question about the fluid flow pressure drop, it is also capable of generating and verifying important dimensionless quantities such as Reynolds’, Froude, and Stokes numbers.


Some common physical dimensionless quantities in Earth Science

Bagnold number                      Ratio of stresses – grain collisions to viscous fluid stresses

Froude number                        v/√ g.D

Hydraulic gradient                  Hydraulic head h1/h2

Pi                                               3.14159…

Poisson’s ratio                        dε transverse strain / dεaxiak strain

Porosity                                   pore volume/total volume

Reynolds number                  ρvD/μ (laminar vs turbulent flow)

Refractive index                     n1 sin θ1 = n2 sin θ2

Relative humidity                   PH2O Vapour / PH2Osaturation

Shields parameter                 τc.D2/(ρs – ρw)gD3

Stokes number                       3πμvD (D is particle diameter)

Strain                                       L1/L0


Other posts in the series on modeling

Geological models: An introduction

Analogue models

Analogue models of faults: scaling the materials

Strike-slip analogue models

Facebooktwitterlinkedininstagram
Facebooktwitterlinkedin

Geological models: An introduction

Facebooktwitterlinkedininstagram

The posts in this series focus on Earth science models, particularly the soft-rock kind.

I have an abiding memory of my grandfather’s workshop. It was accessed through a trapdoor from the living room then a ladder to the basement. The entrance reflected his past as a sailor and shipwright. You knew you had arrived – the smell of cut timber and glue welcomed one to a world in miniature. Every shelf, nook and cranny filled with dozens of sailing boats in glass containers – bottles of all shapes and sizes (including a 5-gallon flagon), light bulbs, and even pharmaceutical glassware. Ships in bottles, modelled on historical and imagined vessels. A space primed to set a kid’s imagination free. He once showed me how he got these impossibly large models through the neck of a bottle, but he told me to keep it secret so there you have it.

One of my grandfather's model ships - a 3-masted barque

One of my grandfather’s model ships – a 3-masted barque

Models are descriptions of complex worlds, at scales that engulf the entire universe to the smallest atomic particle. Model descriptions are written in many different languages: discursive, mathematical-numerical, physical (the kind you can touch), conceptual-theoretical, and imaginary. We use models in all spheres of activity – politics, economics, as social organization, philosophy, and science.

Scientific models, like theories and hypotheses, are embedded in our daily discourse. As a sedimentologist, stratigrapher, general basin analyst, hydrogeologist, and sometime geochemist, I am surrounded by models that inform me about lithofacies, stratigraphic sequencing, the dynamics of basin subsidence, sediment provenance, the consequences of evolution, volcanic eruptions, and chemical equilibria. Sometimes these models are explicitly expressed in my observations and interpretations; more often they are implicit, or embedded, unseen in my cogitation of Earth science problems. Models guide me in my observations, but they also remind me to think outside the box, to look for the unusual, to question the boundaries that all models impose, and where necessary modify or replace them with new versions.


Models as representations

I’ve borrowed this heading from Frigg et al., (2020; Open access).  As these authors comment, there are models for just about everything in science – “Probing models, phenomenological models, computational models, developmental models, explanatory models, impoverished models, testing models, idealized models, theoretical models, scale models, heuristic models, caricature models, exploratory models, didactic models, fantasy models, minimal models, toy models, imaginary models, mathematical models, mechanistic models, substitute models, iconic models, formal models, analogue models, instrumental models…” (Frigg et al., 2020, page 1). Most models in science, particularly the Earth sciences,  are representational; they represent things, processes, and concepts. Familiar examples in science include the billiard ball model of Newtonian action-reaction (that might also double as a model for frictional losses and conservation of energy); this model is touchable – it can be observed directly. Or the iconic Bohr Model of the atom (1913) where Bohr’s theory envisages a central nucleus surrounded by electrons having orbital diameters dependent on their energy levels, analogous to the solar system. In a sense, we can also touch this model via direct observation of planetary motions around the sun. Schrödinger’s cat on the other hand is the quintessential thought experiment that is neither experimentally possible nor observable. But it does allow us to glimpse the consequences of quantum mechanics and the problem of quantum uncertainty.

Modeling in the sedimentological and stratigraphical disciplines probably began in earnest in the mid-20th C, although the products of enlightened minds like Leonardo da Vinci’s experiments, sketches, and notes on hydraulics of channel flow tells us that inquisitive individuals have been cogitating about representation of the physical world for centuries past. And not just in the geological realm. The Renaissance and Enlightenment surge of interest in Armillary spheres as models of a geocentric universe, graced the living rooms and libraries of many well-heeled Europeans, and no doubt caused at least a few to ponder the similarities and differences between model and their night skies (and keeping their ponders to themselves for fear of conflagration).

Sedimentological and stratigraphical modeling covers the gamut of model types in Frigg et al’s., list – quantitative and qualitative; numerical and conceptual, theoretical, experimental, and analogical. Chris Paola (2000) provides an excellent reminder of the status of models  at the end of the millennium. Other reviews over the next 2 decades capture the advances in general geological models (Turner and Gable, 2007), plus more focused topics like geodynamics  (Shellart and Strak, 2016), rifting (Zwaan and Schreurs, 2022), orogenic wedges (Graveleau et al., 2012), and numerical modelling of sedimentary systems (Burgess, 2012; Soto, 2023).

And central to my own work, lithofacies models are fundamentally conceptual. They describe and organize data and observations into coherent structures that paint pictures of the relationships among strata, the environmental conditions that force lithological, biological, and chemical associations, and their spatial-temporal relationships. Lithofacies models are commonly expressed in written language, as 2D and 3D diagrams, time-series animations, and numerical functions. Lithofacies models are not ‘touchable’ in the normal sense of the word (unless we create scale models), but they illustrate nicely the property that many models possess – they represent crossovers among model types, for example conceptual – analogical – mathematical.


Models and analogies

The concept of analogy is intrinsic to representation in models. In very general terms, an analogy is the correspondence, similarity, likeness, or comparison of one thing to another. Analogies are NOT exact copies of the phenomena in question. Analogies can be observable, theoretical, or conceptual. In Earth science we use analogy in nearly all our deliberations concerning past events or processes – we cannot observe these events directly, but we can propose suitable analogues to help explain the geological past. For example, the commonly used expression ‘rock record’ is itself a linguistic analogy to human histories. The maxim ‘the present is the key to the past gives us permission to pursue analogy to explain the rock record. The phrase was coined by Charles Lyell in his 1830-1833 Principles of Geology, based on earlier statements by James Hutton (1788) who proposed that “all past changes on the globe had been brought about by the slow agency of existing causes.” (Lyell, 1837, Volume 1, p. 92).

Thus, a modern beach becomes a realistic and useful analogue for ancient beaches; our observations of recent pyroclastic density currents permit us to model the rheology and dynamics of ancient pyroclastic flows; the organization of microbial mats and laminates in modern sabkhas and saline lakes gives us useful analogues for ancient stromatolites.    Analogies like these are direct and easy to envisage. However, there are ancient geological phenomena that defy the application of obvious or direct analogy.

In some cases, the appropriate analogies for the rock record can prove difficult to establish. A good example is banded iron formations (BIF) that were a hallmark of many Proterozoic and Archean sedimentary basins – there are no modern environments that even come close to what we think the BIFs represented. In this case, possible analogues need to account for:

  • Ocean water masses that were saturated or supersaturated with respect to iron (II).
  • Waters that were saturated with respect to silica and conducive to chert precipitation.
  • Widespread anoxia to account for the abundance of reduced Fe(II) – Fe2+ oxidizes rapidly at even low oxygen concentrations (modern oceans are depleted in soluble iron).
  • Conditions where Fe (III) can precipitate (as hematite) but prevent the oxidation of Fe (II).
  • Application of these conditions to entire basins.

There is no single, all-encompassing analogy that can be applied to BIF models. We are forced to look at several possible candidates that account for different components of the model – some of the candidate analogues will seem reasonable, some may seem a bit of a stretch because they appear to be unrelated to the problem at hand. But whichever analogies are chosen, they must allow us to extend our thinking about the central problem – how did BIFs form?

For example, consider the problem associated with chert deposition.   Modern, deep-sea siliceous oozes are dominated by radiolaria and diatoms which were not present during BIF formation. The physical conditions for ooze deposition are certainly compatible with BIF formation (low-energy, suspension-dominated deposition), but the biological components are not. Thus, we either reject this analogy completely or modify it by, for example, invoking the participation of Precambrian microbes. There is evidence for cyanobacterial polymerisation of silica in modern geothermal hot springs (e.g., Yee et al., 2013). Although there is no evidence for geothermal conditions in the BIFs, microbe-mediated silica precipitation might have been possible in seawater saturated with respect to silica and where cyanobacteria were abundant. Therefore, a reasonable analogue for BIF cherts might include elements of both the ooze and hot springs examples of silica precipitation.

A model of BIF formation presented by Konhauser et al., (2017) and described briefly in the text, modified here to include platform and nearshore microbial biotas, plus a few extra labels. The red ticks indicate reasonable modern (and/or Phanerozoic) analogues for different components of the model.

A model of BIF formation presented by Konhauser et al., (2017) and described briefly in the text, modified here to include platform and nearshore microbial biotas, plus a few extra labels. The red ticks indicate reasonable modern (and/or Phanerozoic) analogues for different components of the model.

Similar arguments apply to the precipitation of iron. One model reviewed by Konhauser et al., (2017), places the precipitation of Fe (III) in the photic zone of Precambrian ocean water- masses, where photosynthetic microbes (principally cyanobacteria) produced dissolved molecular oxygen; precipitated Fe (III) oxides then sink to the sea floor. Fe (II) oxides precipitated in more anoxic bottom waters beneath the photic zone. In this scenario, dissolved Fe (II) and Fe (III) acted as sinks for oxygen. In addition to the BIF requirements noted above, this model uses multiple analogues that describe:

  • The geochemical stratification of ocean waters.
  • The photic zone.
  • Microbes capable of mediating or promoting iron precipitation.

All three conditions are reasonably satisfied by modern analogues.


Models and theories

Are models also theories? From a philosophical perspective the answer seems convoluted: on one hand, models are considered dependent on theories, and on the other independent (Frigg et al., op cit.; Sterrett, 2015).   Some describe theories as collections of models. The all-encompassing plate tectonic theory can be thought of as a rational collection of models, each describing a part of the general theory. For example, there are models of seafloor spreading, lithospheric subduction, rifting and transform deformation, plus a range of models that describe the kinds of sedimentary basins that form at different plate boundaries.

In this section I take the philosophically lazy approach and consider only representational models, because most models in science are of this type. Most models in Earth science are not theories in themselves, but they do contain embedded theories and laws, and in many cases other models. Inclusion of these cognitive structures may be stated explicitly or assumed. For example, in fluid mechanics, if we use Froude numbers in our deliberations then we employ the gravitational constant ‘g’ and in consequence, Newtonian theory of gravitational and inertial forces. In this case the embedded theory is written in mathematical language.

In the two examples that follow, I have listed a few of the theoretical structures that are the foundations of the models (the lists are not exhaustive!):

Foreland basin models:

  • At its most basic, it is a consequence of plate tectonic theory although this is commonly unstated.
  • Laws of gravity and thermodynamics are always assumed, and commonly stated in numerical functions.
  • Hooke’s Law that describes the elastic response of the lithosphere to external loads.
  • Models that use (analogue) elastic beams to represent the lithosphere.
  • Airy or Pratt isostasy
  • Models of the geotherm and the theory of heat transfer.
  • Theories and models of viscosity.
  • Models of lithosphere rheology.
  • Theories and models of stress and strain partitioning, applicable to deformation in the thrust belt, but also to fluid flow and compaction during sediment burial.
  • Theories and models that relate to different modes of sediment dispersal and deposition.

Depositional models of detrital sediment:

  • Theories and models of sediment dispersal; Ficks Law of diffusion might be applied here (e.g., Paola et al., 1992).
  • Theories of cohesion and friction, in the context of bedload transport of sediment.
  • Stokes settling velocities Reynold’s theory that separates turbulent from laminar flow, and Froude numbers that rationalise bedform and surface wave configurations. All of these are included in any numerical and analogue modeling of sediment transport and fluid flow.
  • The theory of viscosity.
  • Boundary layer models.
  • Laws of gravity and thermodynamics (e.g., the conservation of energy) are always assumed, and commonly stated in numerical functions.
  • Facies models.

Models as predictors and pigeon holes

An important consequence of a model is that it should predict other and new phenomena. From a philosophical perspective, models may be structured according to the rules of deductive logic, but their import lies in their inductive and creative possibilities. A recent example of momentous import is the discovery of interstellar gravity waves, predicted by Relativity Theory but not measured until 2015, a century after Einstein’s prediction. The measurements were possible because of technological advances in space exploration and data analysis. Gravity waves can now be incorporated as empirically verified elements of revamped models of black hole collisions, pulsars, and other stellar interactions.

Back on Earth, one of the earliest facies models was J.R.L. Allen’s fluvial point-bar model (1965).   The model provided sedimentologists with a new way to look at fluvial rocks and consequently there was a flurry of publications doing just that, many reinterpreting older explanations of fossil fluvial systems. Allen’s model applied to meandering channel systems (high sinuosity channels). The model showed the progression from channel thalweg to flood plain via sedimentation across an accreting point-bar. It was adopted enthusiastically, so much so that in some cases, even when parts of the model were not present in the actual rocks, the interpretations still insisted on high sinuosity channel point bars – in other words, forcing the rocks into some preconceived idea, an intellectual process commonly referred to as pigeon-holing.

An example of a fluvial point-bar that is reasonably consistent with a J.R.L.Allen’s 1965 model – reasonable in the sense that it contains most of the ingredients specified by the model. This example is from the Cretaceous Dunvegan Formation, northern Alberta.

An example of a fluvial point-bar that is reasonably consistent with a J.R.L.Allen’s 1965 model – reasonable in the sense that it contains most of the ingredients specified by the model. This example is from the Cretaceous Dunvegan Formation, northern Alberta.

Fortunately, common sense did respond to what geomorphologists had known for decades, that high-sinuosity river channels are one part in a spectrum of channel geometries and morphologies, and that a one-size model for ancient fluvial systems does not fit all. Consequently, after 6 decades of learning since Allen’s seminal publication, sedimentologists have developed multiple models for modern and ancient fluvial systems that recognise their inherent variability in time and space.

Pigeon holing is a real and present danger when applied to models. Models might be thought of as a convenience, something to trot out to reinforce our ideas, our biases. Forcing data into some preconceived model does not advance science, but it does underpin intellectual laziness. Models and the processes of modeling have immense value in science, but they should never be static. A rational model that is changed or even discarded because new information renders it no longer fit-for-purpose, does not mean the earlier version was ill conceived, but that it has successfully advocated for advancement.


Other posts in the series on modeling

Model dimensions and dimensional analysis

Analogue models

Analogue models of faults: scaling the materials

Strike-slip analogue models

Facebooktwitterlinkedininstagram
Facebooktwitterlinkedin

Analogue models

Facebooktwitterlinkedininstagram
A sand-box size analogue model of thrust-fault propagation folds in layered stratigraphy, at 44% horizontal shortening. A new, embryonic thrust is forming at the frontal edge of the “thrust belt”. These experiments, although not fully scaled geometrically or dynamically, retain considerable heuristic value for students. The image was generously provided by Prof. Sandra McLaren, Melbourne University.

A sand-box size analogue model of thrust-fault propagation folds in layered stratigraphy, at 44% horizontal shortening. A new, embryonic thrust is forming at the frontal edge of the “thrust belt”. These experiments, although not fully scaled geometrically or dynamically, retain considerable heuristic value for students. The image was generously provided by Prof. Sandra McLaren.

Analogue models are physical objects; we can touch them and observe represented systems directly. As such, they allow us to map the interactions between processes and the physical responses to those processes. Analogue models permit quantitative analysis of a system’s properties.

As noted in an earlier post, the word ‘analogue’ means the correspondence, similarity, likeness, or comparison of one thing to another. Analogies are NOT exact copies of the phenomena in question. Analogies can be observable, theoretical, or conceptual. In Earth science, analogue models are designed to represent some geological system and the processes that govern or control that system. In most cases the systems or objects we want to model are very large – too large and too complex to experiment with directly. Thus, models are scaled-down versions of these systems.

Most analogue models are also scale models where they relate to real world systems by size, geometry, and process, according to some predetermined scale. There are the familiar toys, that are scale replicas of things like ships, dinosaurs, or Barbie-like people. They can be fun to build and to some extent have heuristic value. At a more technical level, wind tunnels and wave tanks are used to observe the aerodynamic or hydrodynamic response of scaled-down versions of planes and ships to fluid flow, turbulence, and waves. Scale models that have figured prominently in geology are those that attempt to unravel the complexities of structural deformation, such as mountain belt folds and fault systems, and the stratigraphic architecture of depositional systems like deltas and fluvial channels.


The limitations of analogue models and decision making

Real world dynamic, biological, and chemical systems react in multifarious ways to the large number of variables acting on the systems. It is not the role of analogue models to replicate or duplicate all these system variables. We must decide on a manageable number of variables that can be tested individually or in small combinations, that will answer the questions we have about how the system works. Chris Paola said it best “Simplification is essential if the goal is insight. Models with fewer moving parts are easier to grasp, more clearly connect cause and effect, and are harder to fiddle to match observations (Paola, 2011).

Analogue models have been used in geology for more than two centuries. One of the earliest attempts to model the structural deformation of stratified rock was by James Hall (Royal Society of Edinburgh presentation,1815). Hall initially experimented with layers of cloth compressed laterally between two pieces of wood, the experiments progressing to pliable clay layers in a more sophisticated mechanical box. Horizontal shortening produced folds that Hall considered analogous to those he had seen in the field – notably he had accompanied James Hutton and John Playfair to field exposures in 1788.

A now iconic contribution by M. King Hubbert (1934) was one of the first publications to examine the philosophical and methodological basis for analogue models; his paper changed the rationale of analogue modeling from descriptive to analytical – it still stands as a good introduction to the topic.

Bailey Willis’ attempts at modeling Appalachian structures serves as a good introduction to the kind of thinking behind the design and execution of the model experiments (Willis, 1894, The Mechanics of Appalachian Structure). The initial questions Willis posed were:

  • What is the influence of stratigraphy on deformation (bed thickness, variable bed thicknesses in vertical and horizontal extent)?
  • What is the influence of load?
  • Is the influence of rock plasticity the same as that as load?

Decisions about the model apparatus and materials that represent layered rock needed to account for (his diagram is reproduced below):

  • Changes in the plasticity of the constructed stratigraphy such that it was analogous to the rheology of real strata (Willis used plaster of Paris and waxes).
  • Accounting for overburden load (he used a layer of lead shot as a vertical confining load, for which he calculated the pressure applied over the model layers).
  • Methods to generate uniform, horizontal compressive stress.
  • Recording each experiment as it progressed (photos, sketches – these days we would use videos).

Willis’ methodology also illustrates the central problem faced by all analogue models – how do we scale not only the objects used in the model (their geometry, shape), but the processes we wish to investigate? Willis attempted to reconcile the rheology of the materials used (beeswax, plaster of Paris, and Kerosene) with Appalachian rock properties such as strength (failure limits), but scaling problems meant he had to add an additional layer to act as a burial load. This is illustrated in his experiments where the lead shot layer was required to prevent brittle failure through the top of the layered sequence, but this layer was equivalent to about 160 km of cover rock at the scale he was using. The scale problem is nicely encapsulated by Middleton and Wilcock (1994, p. 83) “The design problem for the model is then to set all the other scale factors so that the model is dynamically similar to the original”. In other words, models must be geometrically, dynamically, and kinematically similar to the real-world systems we are attempting to understand.

Left: The apparatus used by Willis for his “Appalachian” experiments. The length scale is one metre. Note the excessive thickness of the lead shot layer compared with the stratigraphy. Right: Experimental folds. The stratigraphy was created out of beeswax and plaster of Paris, including mixtures of the two to produce varying hardness and ductility. This was a bold and creative attempt to create similarity between model and Appalachian deformation. Both figures from Willis, 1894, USGS Thirteenth Annual Report.

Left: The apparatus used by Willis for his “Appalachian” experiments. The length scale is one metre. Note the excessive thickness of the lead shot layer compared with the stratigraphy. Right: Experimental folds. The stratigraphy was created out of beeswax and plaster of Paris, including mixtures of the two to produce varying hardness and ductility. This was a bold and creative attempt to create similarity between model and Appalachian deformation. Both figures from Willis, 1894, USGS Thirteenth Annual Report.

Model scaling problems

M.K. Hubbert’s iconic analysis of model scales focused on physical, dynamical systems. One of the first problems we encounter is that scaling of individual variables or quantities is not always linear. For example, if we scale down the measured length of an object by 50%, then the numerical value of the scaled length is obviously half the original length. If, however, we scale volumes by reducing a characteristic length by 50%, the resulting volume is 8 times smaller than the original. If we scale the same length by a third, then the scaled volume is 27 times smaller than the original.

If we now consider the cubes as rock volumes, the mass of each scaled volume will be 8 and 27 times smaller respectively, than the original mass. However, the pressure, or vertical compressive stress exerted by each scaled rock volume on a surface will only decrease by a factor of 2 and 3 respectively.

Hubbert’s lessons in these examples were:

  • Variables in dynamic systems can scale differently.
  • Dynamical or kinematic analysis of an analogue model will not produce sensible results if the materials used have not been correctly scaled.
  • Scaling any variable or quantity requires that the appropriate dimensions are maintained.

Analogue modeling, if it is to be analytically useful (i.e., answering questions) is all about determining the similarity of scaling factors for the important variables that govern processes and their responses – and this is where our problems begin. For his experiments to work, Bailey Willis’ had to add a layer of lead shot over the uppermost model layer – at this experimental scale, the shot layer was equivalent to about 160 km of cover rock which is 3-5 times the thickness of the crust! Thus, Willis’ experiment was qualitatively attractive (i.e., the folds look good) but it could not generate useful data on fold mechanics.

In dynamical and mechanical geological models, we consider scaling similarity in the context of:

  • Geometry (characteristic lengths, areas, volumes).
  • Kinematics – how do we scale a geological event that takes 10 million years?
  • Motion (e.g., velocity, acceleration, direction).
  • Forces (e.g., body, surface, elastic, viscous forces).

Scaling geometric quantities is relatively straight forward; scaling models for dynamic and kinematic similarity is not. How do we accomplish this?


Model scaling and dimensional analysis

Dimensional analysis and scaling are described briefly in a previous posted article where the procedure is illustrated using the example of fluid pressure drop in a pipe – the analysis results in formulation of the Reynold’s number – an important quantity in any study of fluid dynamics. The result also illustrates the value of dimensional analysis:

  • Evaluate the Dimensional homogeneity of equations, where the dimensions must be the same on either side of the equality.
  • The dimensions of the numerator and denominator in a ratio must be the same.
  • Dimensional integrity must be maintained when converting a variable from one unit system to another system.
  • Some quantities are dimensionless. Angular quantities like degrees and radians have no dimensions – they are numbers. All ratios are dimensionless (e.g., porosity, Reynold’s number, Froude number).

Geometric scaling

The geometric scale of a model is expressed as ratios – of lengths, areas, and volumes. For complete similarity, the proportions of each geometric measure for the model must all be the same as the original object or system. The dimensions for each variable must also be the same (in terms of mass M, length L, and time T). Dimensional analysis helps us maintain the correct ratio of dimensions in the ratio numerator and denominator. The simple case for similar triangles is shown below.

Maintenance of length proportions in similar triangles produces different ratios for scaled areas.

Maintenance of length proportions in similar triangles produces different ratios for scaled areas.

The second example has historical significance. We want to find the relationship between the circumference (c) of a circle and its diameter (d). The lengths c and d have a single dimension – L. There are two variables and one dimension [L] and according to the pi theorem, one dimensionless product – c/d or d/c, but the two ratios are reciprocals so in effect there is only one dimensionless product. We can measure both c and d, as folks have been doing since Babylonian times (more than 4000 years ago). Historically the product c/d has precedence – it is the value pi (π); Pi is dimensionless and invariant – its value 3.14159…etc. does not change regardless of the value of d. Note that this is not the same pi as the pi theorem.


Dynamic scaling

The same rules apply to the dynamic and kinematic variables of a system. Dimensional analysis provides us with a method to identify the relevant variables and determine appropriate, measurable ratios – these ratios are dimensionless. Critically, the set of ratio products, or pi groups, must be invariant between the model and original object or system for the principle of similarity to apply. Furthermore, for the system being modeled, products in the set must be independent of each other – in other words, each product must not be a multiple of other products in the set. And this is the foundation upon which analogue models should be constructed because the dimensionless quantities remain valid no matter the scale of the model.

A couple of examples.

  • Froude number scaling: For any analogue model that investigates the dynamics of fluid flow, the model Froude number must equal the real-world value, which can be written:

(v/ g.D)Model = (v/ g.D)Real

Because g is the same in the model and the real-world system we can rearrange (and remove the square root):

(vmodel / vreal)2 = Dmodel\ / Dreal

that allows us to set the scale for both velocity v and water depth D.  For example, if our depth scale is 1/25, then the model velocity should be 1/5 of the real-world velocity, or close to this value if we are to extract answers to questions about the dynamics of stream flow.


  • Scaling Earth deformation: Scaling deformation at the crustal or lithosphere scale is orders of magnitude different to that in most flume models. There have been many attempts to model Earth deformation, ranging from mountain-scale folds and faults to lithosphere-scale plate tectonic processes such as rifting and subduction. These modeling attempts require establishing a degree of variable similarity between bench-top models (~1 m) and real rifts (10s of km) that means length scaling on the order of 10-6. Critical variables include stress, rock failure, strain rate, viscosity, density, and gravitational forces. Unlike the flume experiment, inertia can be neglected because rifting proceeds at a relative snail’s pace.

For rift models (Brun 1999, Fort et al., (2004), Smit et al., (2008), and a more recent review by Zwaan and Schreurs (2022), the materials commonly used to represent a layered crust and mantle lithosphere included cohesionless sand (representing brittle rheologies) and silicon putty for ductile regimes. Other products like wet mud and wheat flour have also been used to represent brittle theologies. Silicon putty has also been used in experiments involving salt mobilization and diapirism.

Strength envelope for a simplified 4-layer crust and lithosphere mantle (a), and the strength envelope applied to the analogue models (b). Panel (c) shows the sand and silicon putty layers that correspond to brittle and ductile rheology respectively. Modified slightly from Brun op cit, Fig. 3.

Strength envelope for a simplified 4-layer crust and lithosphere mantle (a), and the strength envelope applied to the analogue models (b). Panel (c) shows the sand and silicon putty layers that correspond to brittle and ductile rheology respectively. Modified slightly from Brun op cit, Fig. 3.

One of the critical scaling relationships is rock strength (a function of σ1 – σ3) that is expressed as model/rift ratios for brittle and ductile layers (the diagram shows a highly simplified lithosphere structure – a necessary simplification to achieve modeling success). For these models it was also determined that the stress ratios and length ratios are approximately equal (~10-6) (Brun, op cit.) allowing for a more practical approach to model construction. In contrast, the viscosity ratio between ductile crust-mantle lithosphere (viscosity is about 1021 pascal seconds) and silicon putty (103 – 104 pa.s) is on the order of 1017, which is near impossible to maintain in a model that is measured in 10s of centimetres.

The choice of model material for experiments like these is critical to maintain dynamic similarity in terms of viscosity and density.  A few other materials commonly used in dynamic experiments include (all at 20oC):

A few other materials commonly used in dynamic experiments like these include (all at 20oC)

Analogue models have boundaries

All analogue models have physical boundaries. Flumes and sand boxes have a solid base and walls that are essentially impenetrable – there is no sediment or fluid transfer; in dynamic structural models there is no transfer of deformation beyond the walls.

Model walls are necessary, but they can also influence the processes being modeled. For example, fluid flow and sediment dispersal can be deflected in the immediate vicinity of a wall, and in experiments involving deformation, the walls can induce drag. As a general rule, the larger the model, the easier it is to neglect near-field boundary-wall effects.

Boundary conditions also arise from the way in which processes are initiated. The ignition of turbidity currents in flumes commonly occurs with the sudden ‘dumping’ of sediment-water mixtures from a holding tank at the flume head. This determines the initial energy in the flow system and will influence flow momentum (these are energy boundaries). In the same experiments, the dynamics of the density current will also be affected by the degree of initial turbulence in the overlying flume water mass because of drag effects and enhancement of fine sediment elutriation from the turbulent mixture. The initial boundary between density current and overlying water is relatively abrupt, but this changes with the development of an overlying sediment plume behind and above the flow head.

Different boundary conditions are put in place when modeling the effects of gravity on deforming crust or lithosphere. In this case, two popular methods are used:

  • A simple sand box where gravity acting on the model is the same as that acting on the real system.
  • A centrifuge where compression and extension are generated by centrifugal forces in a rotating apparatus that mimics gravity.

Numerical analyses of the dynamic conditions observed in analogue models also require boundary conditions – in this case to limit the behaviour of numerical functions at model boundaries. Such boundaries may be constant numerical values, such as the rate of subsidence in a model of basin stratigraphy, or a function that defines the rate of change of basin subsidence.

In all cases, boundary conditions, whether physical or numerical, are applied deliberately and systematically because they help constrain the model to a limited number of process variables. In other words, they are important tools used to simplify real world systems so that the models have a better chance of producing sensible results.


Other posts in the series on modeling

Geological models: An introduction

Model dimensions and dimensional analysis

Analogue models of faults: scaling the materials

Strike-slip analogue models


Facebooktwitterlinkedininstagram
Facebooktwitterlinkedin

Beds and bedding planes

Facebooktwitterlinkedininstagram
Parallel bedding in a Paleocene turbidite succession, Point San Pedro, California. The thickness of individual beds varies little along their lateral extent, at least within the confines of the outcrop; our view of bedding planes is limited to their 2D extent. The thickest bed is about 50 cm.

Parallel bedding in a Paleocene turbidite succession, Point San Pedro, California. The thickness of individual beds varies little along their lateral extent, at least within the confines of the outcrop; our view of bedding planes is limited to their 2D extent. The thickest bed is about 50 cm. Geologist’s shoe on the bottom right.

The primacy of beds, bedding, and bedding planes

Beds are the fundamental units of stratigraphy and sedimentology. They are the first things we identify and measure in outcrop, core, and borehole geophysical logs. Beds are the foundations of stratigraphic successions.

Etymologically, the words strata (plural) and stratum (singular) predate the anglicised synonym bed.  Leonard da Vinci (1452-1519) and Nicolas Steno (1638-1686) made frequent reference to stratum. The word stratification and its variations are derived from this Latin root. The word bed, in the sense of a resting place or dug plot goes back to Proto-Indo-European roots (about 5000 years back). The context of a sea-bed, where things come to rest, derives from the 16th C Old English bedd. The geological context, as in a stratum, dates from late 17th C although frequent use in scientific literature probably had to wait for James Hutton’s opus (1788), William Smith’s regional geological maps (1819-1824), and Charles Lyell’s ‘Principles’ (1st editions 1830-1833).


Definition of bedding

Beds are sedimentary layers. They usually have observable boundaries top and bottom, referred to as bedding planes. These bounding surfaces are either abrupt where the bedding  plane is well defined (you can put your finger on it), or gradational where the compositional or textural change from one bed to the next occurs over some thickness of sediment. Bedding planes demark changes in sediment texture, structure, and/or composition that signify a change in the depositional conditions. The upper bedding plane, if preserved intact, represents a depositional surface – a sediment-air or sediment-water interface. Beds form in all types of sediment: carbonate, siliciclastic, volcaniclastic, chemical. Deposition takes place within a broad spectrum of environmental conditions.


Original orientation

Nicholas Steno (1669) introduced the concept of ‘original horizontality’ where the deposition of sediment at its inception (and therefore bed formation) is approximately horizontal. In reality, the original orientation of a bed will be determined by depositional slope, or paleoslope. This orientation may change during burial compaction, disruption and displacement during soft-sediment deformation, or later tectonism.


Measurable quantities of beds

Thickness: Bed thickness is measured between and at right angles to bedding planes. Thickness can vary from millimetres to many 10s of metres depending on the depositional conditions, such as he continuity of sediment supply. For example, slow deposition from suspension in a lake or deep sea can produce millimetre thick laminae, whereas deposition from a debris flow or pyroclastic density current may be metres thick.

Bed geometry: This is usually identified by the 2D and 3D shape of the bedding planes. The scale of observation, particularly in terms of lateral extent, is not codified but is commonly taken to be at least at outcrop scale. As a general rule, bedding is most easily identified at distance from an outcrop – the closer you get, the more complicated it becomes; the point bar deposits shown below illustrate this problem. Common geometric forms include:

  • Parallel bedding where bedding planes are parallel at outcrop scale and beyond. Laterally extensive parallel bedding can often be observed in cliff and mountain side exposures. Classic examples occur in flysch-turbidite successions where parallel beds are stacked 100s of metres thick.
Well-developed parallel bedding in an Early Miocene turbidite-debris flow succession. There is a huge range of bed thicknesses here, from 1-2 cm to about 300 cm. Individual beds can be trace laterally for a few hundred metres. Goat Island Marine Reserve, New Zealand.

Well-developed parallel bedding in an Early Miocene turbidite-debris flow succession. There is a huge range of bed thicknesses here, from 1-2 cm to about 300 cm. Individual beds can be trace laterally for a few hundred metres. Goat Island Marine Reserve, New Zealand.

  • Wedge-shaped bedding where bedding planes are not parallel and meet at a pinch out. Theoretically, all beds are probably wedge shaped. At a local scale, examples of this type of bedding include sandstone wedges on a fluvial point bar, and gravel bars in flood-dominated channels on the active portion of an alluvial fan.
  • Scour shaped bedding: This type is analogous to wedge-shaped beds, but the lower bounding surface is concave upwards. Examples of this type are commonly attributed to channels and channel-forming processes.
Lateral accretion in this Carboniferous point bar is characterised by discontinuous wedge-shaped sand beds interleaved with siltstone-mudstone layers. From a distance, (left) the inclined lateral accretion beds look quasi-continuous, but their complexity becomes apparent on closer inspection (right). Kentucky, Highway I64.

Lateral accretion in this Carboniferous point bar is characterised by discontinuous wedge-shaped sand beds interleaved with siltstone-mudstone layers. From a distance, (left) the inclined lateral accretion beds look quasi-continuous, but their complexity becomes apparent on closer inspection (right). Kentucky, Highway I64.


An amalgamation of sandstone beds filling a fluvial channel – the lowest bed has a distinctive concave-upward bedding plane. Dunvegan Formation (Cretaceous), Alberta.

An amalgamation of sandstone beds filling a fluvial channel – the lowest bed has a distinctive concave-upward bedding plane. Dunvegan Formation (Cretaceous), Alberta.

Internal organization:

  • Massive bedding – relatively homogenous and structureless throughout.
  • Graded bedding – a change in grain size from bottom to top (e.g., normal, reverse).
  • Crossbedded – a variety of bedforms are possible depending on sediment grade and current velocity.
  • Event beds: Within any succession, there may be beds that stand out because of an abrupt change in thickness, geometry, or composition – they signify a unique event. For example, a succession of bedded sandstone may be interrupted by a bed containing large mud rip-up clasts, signifying an unusual event such as a storm deposit, or beds that record slumping and soft-sediment deformation, or clasts of different composition that may indicate a change in sediment source (provenance).
  • Marker beds: A bit like event beds except they can be traced over large distances across a sedimentary basin. Common examples are volcanic ash beds that represent single eruptions. Minerals in the ash are also potentially useful for radiometric dating the event. Beds like these are important because they approximate chronostratigraphic surfaces and can be used to correlate widely distributed successions.
  • Crystal size grading: This applies to chemical sediments. Notable examples include bottom-precipitated evaporite minerals like gypsum and halite, and bedded chert.
  • The internal organization of all bed types can be modified by bioturbation, compaction, and post-depositional soft-sediment deformation.
A very distinctive event bed in the Lower Miocene Waitemata Basin, Auckland, consisting of slumped, pulled-apart, folded, and partially liquified sandy turbidite beds. The basal contact is an undeformed glide-plane – a surface over which the entire mass transport deposit moved. The upper bedding plane is irregular, reflecting the relief on top of the slump package, and over which the next sediment gravity flow was deposited.

A very distinctive event bed in the Lower Miocene Waitemata Basin, Auckland, consisting of slumped, pulled-apart, folded, and partially liquified sandy turbidite beds. The basal contact is an undeformed glide-plane – a surface over which the entire mass transport deposit moved. The upper bedding plane is irregular, reflecting the relief on top of the slump package, and over which the next sediment gravity flow was deposited.


Thin wavy, undulating and discontinuous beds of gypsum that precipitated at the interface between a salt lake (salar) floor and the overlying brine. Each bed is about 20 mm thick. The gypsum crystals grew vertically from the salar floor. Chilean Altiplano. Probably Late Pleistocene.

Thin wavy, undulating and discontinuous beds of gypsum that precipitated at the interface between a salt lake (salar) floor and the overlying brine. Each bed is about 20 mm thick. The gypsum crystals grew vertically from the salar floor. Chilean Altiplano. Probably Late Pleistocene.

Bedding plane geometry: How a bedding plane is described depends on the resolution of our observations. From a distance, a bedding plane may appear relatively flat or featureless. On closer inspection of the same plane, we might observe undulations that result from large-scale variations in thickness, for example the upper surface of dune bedforms, or large clasts that protrude into the overlying bed; in both cases the departures from ‘flatness’ are produced during the underlying event. However, in many depositional settings, bedding planes are scoured – in this case the scouring is usually associated with the succeeding event. Indeed, erosion and scouring can remove entire beds. Bedding plane irregularities can also result from post-depositional compaction.

The channel-like, lower bounding surface of a crossbedded fluvial sandstone bed has eroded the underlying shelf deposits, in places removing several beds. The fluvial sandstone was deposited during a sea level lowstand when terrestrial drainage extended across the exposed shelf. Jurassic Bowser Basin, northern British Columbia.

The channel-like, lower bounding surface of a crossbedded fluvial sandstone bed has eroded the underlying shelf deposits, in places removing several beds. The fluvial sandstone was deposited during a sea level lowstand when terrestrial drainage extended across the exposed shelf. Jurassic Bowser Basin, northern British Columbia.


Andesite boulders up to 40 cm across protrude through the upper bedding plane of a lahar where they are draped by later, airfall ash and lapilli (white to red-brown layered beds near the top of the exposure). Pliocene Karioi volcano, Raglan, New Zealand.

Andesite boulders up to 40 cm across protrude through the upper bedding plane of a lahar where they are draped by later, airfall ash and lapilli (white to red-brown layered beds near the top of the exposure). Pliocene Karioi volcano, Raglan, New Zealand.

The significance of bedding planes

  • Chronostratigraphic significance of a bed: Every bed represents a period of mechanical or chemical deposition; they are depositional events. The duration of an event can be measured in seconds through millennia. Except under controlled experimental conditions (e.g., flumes), we do not know the duration of these events. We can attempt to find an average duration for a succession, by dividing the number of events (a bed count) by the total time (assuming we can measure the total time represented by the succession), but even this method is woefully inadequate because of…
  • Bedding planes as hiatal surfaces: Bedding planes represent the cessation of depositional events. What is unknown is the length of time between the end of one event and the beginning of the next event. A couple of examples: A bed deposited during a river flood is overlain abruptly by a second, similar bed. Was the second bed deposited during a different period of river flooding, or does it represent a very short- duration shift in depositional locus during the same event (maybe the channel axis shifted laterally, or perhaps there was a surge in flow)? In comparison, turbidity currents leave a well-defined and identifiable depositional record, such as the Bouma sequence. Deposition of coarse-grained intervals (A and B) is probably rapid (minutes, hours, days) but the finer-grained parts of the depositional event may take years to complete. The hiatus between this event and the next could well be measured in 100s or 1000s of years.
  • Dip and strike: Any description of beds requires us to position them geographically (e.g., latitude-longitude, UTM grids) and to orient them in 3D space.  Dip and strike provide unique measures of bed attitude.
A tilted bedding plane covered with current ripples. The strike, true dip, and apparent dips of are indicated. Paleocene, Ellesmere Island, Arctic Canada.

A tilted bedding plane covered with current ripples. The strike, true dip, and apparent dips of are indicated. Paleocene, Ellesmere Island, Arctic Canada.

Things that are not beds

  • Metamorphic layering: Original bedding can be preserved in low grade metasedimentary and metavolcanic rocks (e.g. subgreenschist to low greenschist grade). High grade rocks (upper greenschist, amphibolite) commonly present compositional layering and through-going foliation that result from alignment of recrystallized sheet silicates like muscovite and biotite. In most cases, original sedimentary bedding has been obliterated.
  • Igneous dykes (dikes) and sills: Both represent intrusion of igneous melts into an existing pile of rock. They are not beds.
  • Sedimentary dykes: These too are intrusive bodies (of fluid sediment) that are insinuated into an existing pile of sedimentary beds.
  • Stratiform iron pans: Bands of nodular limonite and goethite commonly precipitate within existing beds of porous sediment, in response to groundwater infiltration and watertable fluctuations. The iron bands commonly mimic bedding because of the permeability advantage, but can also cross-cut bedding.
Discontinuous limonite iron pans superficially mimic the left-dipping bedding in these Pleistocene sand dune deposits, but the pans also crosscut the dune bedding (arrows). The iron pans post-date dune deposition and formed as subsurface precipitates of iron oxide during older, fluctuating watertables. Kariotahi, New Zealand.

Discontinuous limonite iron pans superficially mimic the left-dipping bedding in these Pleistocene sand dune deposits, but the pans also crosscut the dune bedding (arrows). The iron pans post-date dune deposition and formed as subsurface precipitates of iron oxide during older, fluctuating watertables. Kariotahi, New Zealand.

Other posts that introduce basic methods of rock description, mapping, and structural analysis

Measuring dip and strike

Solving the three-point problem

The Rule of Vs in geological mapping

Plotting a structural contour map

Stereographic projection – the basics

Stereographic projection of linear measurements

Stereographic projection – unfolding folds

Stereographic projection – poles to planes

Folded rock; some terminology

Faults – some common terminology

Thrust faults: Some common terminology

Strike-slip faults: Some terminology

Using S and Z folds to decipher large-scale structures

Facebooktwitterlinkedininstagram
Facebooktwitterlinkedin

Miller indices in crystallography

Facebooktwitterlinkedininstagram
Minerals are defined by their chemical composition and their crystal forms. Miller, and Miller-Bravais indices are the standard where every face on a crystal is given a unique description that in general notation are written as (hkl) and (hkil). Two of the most common forms are prisms (the tourmaline crystal on the left), and pyramids as shown in the tourmaline crystal termination and the volcanic quartz.

Minerals are defined by their chemical composition and their crystal forms. Miller, and Miller-Bravais indices are the standard where every face on a crystal is given a unique description that in general notation is written as (hkl) and (hkil). Two of the most common forms are prisms (the tourmaline crystal on the left), and pyramids as shown in the tourmaline crystal termination and the volcanic quartz.

Miller, and Miller-Bravais indices are the standard where every face on a crystal is given a unique description.

Crystals are structured solids made up of an ordered arrangement of ions, atoms, or molecules. At the atomic scale this three-dimensional array is called a lattice. The smallest, and most basic lattice representation of any crystal is its unit cell. The shape and symmetry of the crystals we observe and the arrangement of their faces, mimic the geometric properties of their unit cells.

The type of structure we see, specifically the outward appearing form of the crystal (shape, size, symmetry), depends on several factors:

  • First and foremost, the composition of the ordered components; their atomic dimensions and charge (for cation and anions).
  • Environmental factors such as the concentration, activity, or fugacity of their constituent atoms, ions, or molecules in fluid, molten or gas phases,
  • Temperature and pressure conditions,
  • Biological mediation of precipitation at Earth’s surface, for example aragonite in seawater whitings, ooids, and microbialites.
  • Kinetic factors that determine the rate of chemical reactions and crystal formation (precipitation). A classic, and still problematic example in sedimentary geology is the precipitation of dolomite.

Crystallography was in its infancy in the late 18th and early 19th centuries. An important advancement at this time by Christian Weiss (1780 – 1856) was the recognition that crystals could be thought of as collections of similar planes arranged symmetrically around three axes.  Weiss devised the three-axis system a, b, c, and determined that any single crystal face will intersect one, two or all three axes. Other faces of the same crystal could then be described according to the proportions of their intersections with the three axes.

William Hallowes Miller (1801-1880) took this a step further. Miller was a Welsh mineralogist who eventually assumed the role of Professor of Mineralogy at Cambridge University (replacing William Whewell). His contribution, published in A Treatise on Crystallography (1834), applied spherical trigonometry to a numerical system of crystal nomenclature; Millers systematic approach stands today.


Crystal axes, crystal systems, and crystal face intersections

Definition of the seven crystal systems is based on the relative lengths of the axes (labelled a, b, c) and their angular relationships. Five systems have three axes and two have four axes (hexagonal, trigonal):

  • Isometric; a = b = c, all at 90o. This class has the greatest degree of symmetry.
  • Tetragonal: a1 = a2 ≠ c, all at 90o.
  • Orthorhombic: a ≠ b ≠ c, all at 90o.
  • Monoclinic: a ≠ b ≠ c, ab = bc = 90o, ac ≠ 90o.
  • Triclinic: a ≠ b ≠ c, ac ≠ bc ≠ ab ≠ 90o.
  • Hexagonal: a1 = a2 = a3 at 120 o, ≠ c at 90o. One 6-fold axis of symmetry.
  • Trigonal: a1 = a2 = a3 at 120 o, ≠ c at 90o. One 3-fold axis of symmetry.

Note that we label each axis according to whether it is positive or negative; by convention, the negative labels place the minus sign above the letter.

Eighteenth and 19th C crystallographers did not have the luxury of X-ray radiography to identify unit cells. Instead, they described crystal forms by measuring the interfacial angles of real crystals and determining their relative intersections with the crystal axes. The phrase ‘relative length’ is important; identification of a class does not depend on some standard axial length or crystal size. This also means that the intersection of a crystal face with any of the axes will also be relative; if a face moves parallel to itself, the relative intersections will remain the same. Every crystal face will intersect one, two or three axes.


Christian Weiss crystal face parameters

The crystal face labeling system Christian Weiss devised was based on the relative axis intersections determined by measuring interfacial angles. If we are to describe all faces comprising a crystal, we need a standard face against which all other faces are measured. The intersections on this standard face are assumed to have a value of one.


Intersection with one axis

For crystals having faces that intersect only one axis, the intersection value is assigned 1; intersections on the other two axes are at infinity. For example, if the face intersects the c axis it will be labelled ∞a, ∞b, 1c. ( means intersection of an axis at infinity).

Examples of crystal faces intersecting one and two axes. The isometric system crystal is a cube of equal sides and equal axis intersections (left). The prism is another common crystal form that in this case intersects two axes.

Examples of crystal faces intersecting one and two axes. The isometric system crystal is a cube of equal sides and equal axis intersections (left). The prism is another common crystal form that in this case intersects two axes.

Intersection with two axes

Likewise, for crystals with faces intersecting two axes, one of the faces is assigned the value 1, and the other will be a fraction (or multiple) of one. The third axis intersection is infinity. In the example shown below, the prism face notation is 1a, 1b, ∞c.


Intersection with three axes

Faces having three intersections are treated in the same way, but in this case the largest face on any crystal that intersects all three axes (not necessarily the largest face on the crystal) is chosen as the unit face. The intersections are all given a value of unity, so that the unit face can be described as 1a, 1b, 1c. All other faces in the same crystal can now be described with reference to the unit face.

The orthorhombic crystal shown here consists of a prism and two sets of pyramid terminations (each set is a mirror image). All faces in the pyramids intersect the three axes, but the faces on the middle pyramid are the largest so we assign one of these as the unit face. The values of the three intersections on the unit face are 1, so the face is labelled 1a, 1b, 1c.

With the unit face as our standard for this crystal, we can now tackle the other faces. Note that the actual intersection point may need to be extrapolated. For the small set of pyramid faces the intersections with ‘a’ and ‘b’ are extrapolated – their (approximate) values relative to the unit face are indicated. Thus, the face can be labelled 2a, 2b, 2/3c. Because these values are relative, we can divide by 2, so that the terminal pyramid face can be assigned 1a, 1b, 1/3c.

A schematic of crystal face intersections with two and three axes in an orthorhombic crystal, from which Weiss intersection ratios and Miller indices are calculated. The unit face is the large pyramid face that intersects all three axes (diagram centre).

A schematic of crystal face intersections with two and three axes in an orthorhombic crystal, from which Weiss intersection ratios and Miller indices are calculated. The unit face is the large pyramid face that intersects all three axes (diagram centre).

William Miller intercedes

Weiss’ method is certainly workable, but it is regarded as cumbersome. Miller’s modification was quite simple, a simplicity that has survived. It has four parts:

  1. Identify the Weiss parameters for each face.
  2. Determine the reciprocal for each axis value.
  3. Normalize the values so that each face is described by integers only (i.e., clear the fractions).
  4. The axes are always described in the order a, b, and c; therefore, the label can omit these. Convention also requires the Miller Indices to be enclosed in brackets.

For crystal systems with three axes, the general notation for any crystal face is (hkl).

For the examples shown above, the reciprocal of the single face intersection with the axis c becomes:

1/∞a, 1/∞b, 1/1c which simplifies to 0a, 0b, 1c, or in the Miller indices convention, (001).

For the two axis intersections (tetragonal prism), the reciprocal is 1/1a, 1/1b, 1/∞c and the Miller designation (110).

For the orthorhombic crystal, the reciprocals of the unit face intersections are 1/1a, 1/1b, 1/1c, and the Miller designation is (111); for the smaller pyramid face (113), and the prism face (110). For axis intersections that are negative, the number has a minus sign above the integer.

Miller indices for crystals having faces that intersect one (left), two, and three axes (right).

Miller indices for crystals having faces that intersect one (left), two, and three axes (right).

Miller-Bravais indices

The hexagonal/trigonal groups of crystals are the odd ones out in the crystal classification system; they have four axes, three equal axes at 120o labelled a1, a2, and a3, that are at right angles to the c axis. Trigonal crystals are frequently described in terms of hexagonal geometric properties. The general form of a hexagonal crystal face is (hkil). Quartz is the ubiquitous mineral in this group, commonly forming prisms with pyramid terminations and in some cases, bipyramids like the example shown below (this quartz habit is common in felsic volcanic rocks). Labeling hexagonal crystal faces follows the same method for both the Weiss and Miller indices.

There is an additional rule that the sum of h + k + i = 0. Prism faces that intersect two of the ‘a’ axes but not the c axis have Weiss parameters like 1a1, ∞a2, -1a3, ∞a4, and a Miller-Bravais index like (1010). Likewise, pyramid faces that intersect two ‘a’ axes and the ‘c’ axis will have indices like (1011) (the sum of hki is 0). For crystals having pyramid faces that intersect 3 ‘a’ axes, the middle axis intersection will be a fraction of that for the other two.

Miller-Bravais notation for pyramid faces intersecting two ‘a’ axes and the c axis in a slightly abraded grain of bipyramidal quartz (scanning electron micrograph).

Miller-Bravais notation for pyramid faces intersecting two ‘a’ axes and the c axis in a slightly abraded grain of bipyramidal quartz (scanning electron micrograph).

Twin and cleavage planes

The Miller and Miller-Bravais notations are also applicable to the description of cleavage and twin planes because they generally parallel certain crystal faces. For example, the prominent rhombohedral cleavage in calcite is (1011), in gypsum the perfect cleavage is (010) and less perfect (100) and (111). The prominent basal cleavage in biotite and muscovite is (001) – the common form of detrital mica flakes in sediments. Albite twinning is across the (010) plane – this can also be a cleavage plane, along with (001).


A couple of good resources

Online mineralogy lectures by Prof. Stephen A. Nelson at Tulane University

Introduction to mineralogy: Tark Hamilton, Camosun College.

There are lots of YouTube presentations on the topic.


Other posts on this topic

The polarizing microscope

Optical mineralogy: some terminology

Sliced thin; kaleidoscopes with a geological purpose

Sliced thin; time and process recorded in igneous rocks

Sliced thin; the unfolding story of sandstone

Sliced thin; the universe revealed in microfossils


Facebooktwitterlinkedininstagram
Facebooktwitterlinkedin

Salt marsh lithofacies

Facebooktwitterlinkedininstagram
Several generations of salt marsh have formed along Fundy Bay coasts during the Holocene post-glacial, eustatic rise in sea level. At this location the seaward edge is bound by marsh cliffs that define at least three platforms at different elevations, each representing marsh development at different stages of sea level rise. Vegetation here is dominated by Spartina. Small, shallow pannes, or ponds (centre right) are recharged during precipitation and spring tide flooding.

Several generations of salt marsh have formed along Fundy Bay coasts during the Holocene post-glacial, eustatic rise in sea level. At this location the seaward edge is bound by marsh cliffs that define at least three platforms at different elevations, each representing marsh development at different stages of sea level rise. Vegetation here is dominated by Spartina. Small, shallow pannes, or ponds (centre right) are recharged during precipitation and spring tide flooding.

This is the fourth post in a series on vegetated coastal lithofacies – see also:

Seagrass meadows and ecosystems

Seagrass lithofacies in the rock record

Mangrove ecosystems

Mangrove lithofacies


Salt marshes, along with mangrove and seagrass communities, occupy a unique position along many coasts, at the transition from intertidal to terrestrial environments. All three ecosystems also occupy a unique position in the stratigraphic convergence of marine and non-marine lithofacies. The locus of each ecosystem is generally defined as:

  • Seagrasses occupy intertidal to shallow subtidal zones where there is daily or permanent submergence by tides.
  • Mangroves thrive in the upper intertidal zone that is regularly flooded by tides, but where the vegetation is not submerged.
  • Salt marshes occupy a more landward position where they are flooded, but not necessarily submerged, only during spring tides and storm surges.

Modern mangrove and seagrass ecosystems are restricted to tropical – subtropical-temperate latitudes, a situation that appears to have persisted in the rock record.  In comparison, modern salt marshes are widely distributed globally, as far north as Greenland and Iceland and south to the Sub-Antarctic Auckland and Campbell islands. Thus, the salt marsh ecosystem may have greater paleogeographic and stratigraphic value.


Salt marsh ecosystems

Like mangrove ecosystems, salt marshes accumulate in low-energy estuaries, embayments and lagoons, and wetland areas behind beaches (the beaches themselves may be high energy, wave dominated but the back-beach area is sheltered). They occupy supratidal zones where seawater flooding only occurs during spring tides and storm surges. Soils are saline, but the degree of saturation alternates from fully saturated during tidal floods, to partly drained and even desiccated during exposure (Allen, 2000). There is little competition from mangroves under these conditions, but at the landward limits of the marshes there is increasing competition from non-halophytic coastal flora.

The most obvious characteristic of salt marshes is their flora, dominated by salt-tolerant (halophytic) plants like Spartina (cord grass) and Juncus, and succulents such as Salicornia. The variation and extent of different plant species depend on temperature and precipitation, the frequency of tidal inundation that also is related to marsh elevation and distance from tidal channels, the degree of desiccation, and soil drainage (Townend et al., 2010, PDF).

Salicornia is a common salt marsh inhabitant. Succulent plants like these are salt tolerant and well adapted to extended periods of soil drying. They also develop dense root tangles that help stabilise the marsh soils.

Salicornia is a common salt marsh inhabitant. Succulent plants like these are salt tolerant and well adapted to extended periods of soil drying. They also develop dense root tangles that help stabilise the marsh soils.

Sediment infaunal activity can be intense but is restricted to invertebrate species that can tolerate variable salinity and relatively long periods of exposure and potential desiccation. Worms and crabs are most common. Rampant bioturbation by these critters can have a major impact on soil drainage. Foraging birds are common; at some locations grazing by four-legged critters (particularly cattle) can seriously damage the flora and soil structure.


Salt marsh sedimentation

Salt marshes are flat, seaward-dipping platforms that either merge ramp-like with tidal flats or are in abrupt contact defined by micro-cliffs. The marshes are usually transected by branching tidal creek networks that tend to merge seaward to a single waterway. The channels are filled during normal flood tides, but only overtop during spring tides. Channel extent and depth is strongly correlated with tidal range and the magnitude of the tidal prism (the volume of seawater exchanged during a tidal cycle).

Small cliff-like structures are a common feature along the seaward margins of salt marshes. Most are centimetres to decimetres high. They are erosional structures usually associated with marsh retreat.

Allen (2000, op cit.) identified two main types of salt marsh based on sediment composition: organic-dominated and mineral-dominated. Organic marshes derive sediment primarily from local halophytic vegetation; accretion rates in this case are relatively low. Organic matter can accumulate during and between flood events, but it may be subject to aerobic or anaerobic degradation.

Mineralogical marshes derive sediment from the adjacent estuary or lagoon, consisting mostly of mud and silt that is carried in suspension by channel overbank flow; coarser-grained sediment may be introduced to the platform during storm surges. Local ponds, or pannes, dot the marsh surface and may harbour additional invertebrates because of extended periods of inundation. Panne sediment may contain high concentrations of organic matter, including that derived from macroalgae. Prolonged exposure of marshes and pannes can produce a variety of desiccation structures including mud cracks and curled or disrupted microbial mats.

An extensive salt marsh has formed behind coastal dunes near Freeport, Texas. The swaths of Spartina are separated by supratidal, mixed sand-mud flats that are covered by microbial mats in various states of desiccation.

An extensive salt marsh has formed behind coastal dunes near Freeport, Texas. The swaths of Spartina are separated by supratidal, mixed sand-mud flats that are covered by microbial mats in various states of desiccation.

Mineralogical accretion of a marsh only occurs during spring tide inundation. Accretion rate and thickness depend on:

  • The local accommodation space.
  • The suspended sediment load concentration.
  • Proximity to tidal channels and creeks,
  • The length of time the platform surface is inundated – commonly referred to as the hydroperiod, and,
  • The settling rate of suspended sediment.

Sedimentation on modern salt marshes is strongly influenced by local vegetation; tidal flow velocities are attenuated by the tangle of plants that trap sediment. Root tangles help bind the sediment. For net accretion to occur, the sedimentation rate during flood tides must exceed erosional losses during the subsequent ebb tides. Salt marsh vegetation can also attenuate storm waves.


Accommodation space

The importance of spring-tide flooding to salt marsh viability means that these ecosystems are strongly influenced by even subtle changes in relative sea level – specifically the dynamic relationship between changes in accommodation space and sediment supply. Such changes may be autocyclic, for example resulting from variations in local sediment supply, local tidal amplification, changes in the tidal channel network, or autocompaction of marsh sediment. Salt marsh platforms will also respond to allocyclic processes such as glacio-eustatic forcing of sea level rise and fall, or basin-wide tectonic subsidence or uplift.

Salt marsh survival based on its response to sea level rise is analogous to that commonly applied to the fate of coral reefs:

  • Marsh accretion keeps up with sea level rise and is in equilibrium with the creation of accommodation space. Accretion in this context is based primarily on sedimentation rate, but also means that halophytic vegetation must be able to regenerate to maintain the essential character of the salt marsh.
  • If sea level rise accelerates the marsh will need to catch up. This implies a time lag for sedimentation and regrowth to adjust to the new base level. Recent numerical modelling suggests that this lag may be a few decades (Kirwan and Temmerman, 2009, PDF).
  • If it is unable to catch up, vegetation will not survive and the marsh will give up.

If sea level rise exceeds the sediment supply rate, then marsh accretion will not keep up. The marshes will eventually drown and, depending on the extent of transgression, may be subjected to ravinement as the shoreline and shoreface shifts landward. Shoreface ravinement has the potential for removal of some or all the salt marsh and associated paralic deposits; the deeper parts of tidal creeks may survive these erosional episodes.

If sediment supply exceeds the rate at which accommodation space is created (i.e., the rate of sea level rise is low, at still-stand, or decreasing), then the marsh will probably expand seaward in concert with the progradation of laterally associated coastal depositional systems (such as mangrove wetlands, lagoon, barrier island, beach, and shoreface).

A swath of beach gravels driven by storms over the adjacent salt marsh. Cobequid Bay, an inlet in Fundy Bay, Nova Scotia. Landward migration of the beach can potentially remove all or some of the underlying salt marsh deposits.

A swath of beach gravels driven by storms over the adjacent salt marsh. Cobequid Bay, an inlet in Fundy Bay, Nova Scotia. Landward migration of the beach can potentially remove all or some of the underlying salt marsh deposits.

The history of modern salt marshes begins with the post-glacial, eustatic rise in sea level that continued through the Holocene. The global trend in sea level rise will be offset by local or basin-scale differences in subsidence/uplift (particularly the isostatic response to melting ice sheets), local steric effects, sediment supply, tidal amplifications, and storminess. For example, marsh aggradation rates as high as 25.9 cm/century for the past 1400 years have been determined for some Fundy Bay salt marshes, where tidal amplification has been a major forcing factor (Shaw and Ceman, 1999).


Lithofacies associations

Two lithofacies are described: salt marsh and tidal creek. Tidal flats, mangrove wetlands, beaches, and lagoons are important as lateral and stratigraphic associations, but most of these have been dealt with in other posts.

Salt marshes and their deposits rarely occur in isolation – they are usually associated with other paralic depositional settings. Two examples of these facies associations are shown here: Left: Whitford, south Auckland, and Right: Freeport, Texas. Laterally associated lithofacies have the potential to be represented in stratigraphic successions.

Salt marshes and their deposits rarely occur in isolation – they are usually associated with other paralic depositional settings. Two examples of these facies associations are shown here: Left: Whitford, south Auckland, and Right: Freeport, Texas. Laterally associated lithofacies have the potential to be represented in stratigraphic successions.


Table of common sedimentary structures in salt marshes and tidal creeks.


Salt marsh lithofacies

In the foreground, Salicornia-dominated, temperate climate salt marsh and intervening supratidal, mud-sand flats. In the background, pale brown sedges have taken over the marsh at slightly higher elevations. Kaiua, Hauraki Gulf, N.Z.

In the foreground, Salicornia-dominated, temperate climate salt marsh and intervening supratidal, mud-sand flats. In the background, pale brown sedges have taken over the marsh at slightly higher elevations. Kaiua, Hauraki Gulf, N.Z.

Salt marsh deposits can be thought of as soil profiles – they accumulate mineral sediment and organic matter, they support vegetation, an invertebrate biota and microbiota (e.g., bacteria, fungi), and are subjected to the vagaries of periodic wetting and drying. They consist predominantly of mud and silt, siliciclastic and carbonate, deposited under low energy conditions where intermittent flooding and wave activity are attenuated by the vegetation. The organic content may be concentrated in specific ‘top soil’ layers or distributed through the entire profile depending on sediment supply rates and the duration of the hydroperiod. Like fully terrestrial soils, the plant material is degraded to greater or lesser extents by anaerobic and aerobic bacterial processes, as well as grazing and foraging by invertebrate critters. Wood fragments and the roots of coastal shrubs may also be present, including the roots of mangroves in tropical and subtropical settings.

A 30 cm deep section of salt marsh consisting of silty clay (pale brown) and capping carbonaceous ‘top soil’; the contact between the two layers is gradational. There is no obvious stratification. Root structures from Salicornia and sedges abound. The large holes contain remnants of mangrove roots. Coin (lower left) is 32 mm diameter). Whitford, south Auckland.

A 30 cm deep section of salt marsh consisting of silty clay (pale brown) and capping carbonaceous ‘top soil’; the contact between the two layers is gradational. There is no obvious stratification. Root structures from Salicornia and sedges abound. The large holes contain remnants of mangrove roots. Coin (lower left) is 32 mm diameter). Whitford, south Auckland.

A consequence of these depositional conditions is that traction current bedforms are usually absent. Many salt marsh profiles contain little evidence for stratification within depositional units. In others, lamination can develop – good examples from Fundy Bay, identified using X-ray radiography, are illustrated by Dashtgard and Gingras (2005) who interpret the laminae as the products of seasonal variations in sediment supply. The laminae are commonly disrupted by roots and burrows. Laminated muds may develop preferentially in pannes. Pannes that dry out will develop mud cracks and desiccated microbial mats.

Salt marsh profiles may contain multiple episodes of marsh termination resulting from storm flooding or rising in sea levels. Each episode may be bound by:

  • A low-relief truncation surface (in the case of storm wave encroachment).
  • Truncation of roots and burrows.
  • Scattered pebbles or shell lags and lenses derived from laterally associated tidal flats and beaches.
  • An organic-rich carbonaceous layer where vegetation is re-established.
A 45 cm thick, salt-marsh cliff section reveals stacked marsh-aggradation episodes. Each episode is bound by a thin, dark brown carbonaceous band (white arrows); for each episode the overlying marsh deposits consist of clay and silt. Each episode contains root structures that penetrate the deposits of earlier deposits (e.g., yellow arrow). Larger wood fragments were probably derived from nearby coastal shrubs and trees. Coin (lower right) is 24 mm diameter. Bay of Fundy, Nova Scotia (same locality as shown in the image at top of the page).

A 45 cm thick, salt-marsh cliff section reveals stacked marsh-aggradation episodes. Each episode is bound by a thin, dark brown carbonaceous band (white arrows); for each episode the overlying marsh deposits consist of clay and silt. Each episode contains root structures that penetrate the deposits of earlier deposits (e.g., yellow arrow). Larger wood fragments were probably derived from nearby coastal shrubs and trees. Coin (lower right) is 24 mm diameter. Bay of Fundy, Nova Scotia (same locality as shown in the image at top of the page).

Tidal creek lithofacies

A small tidal creek just beyond the downstream limit of salt marsh, Whitford, south Auckland (about 60 cm deep). Ebb tidal flow is from image bottom to top. The sediment here is soft, grey mud that becomes dark green and anaerobic a few centimetres below the surface. The surface is littered with Amphibola crenata gastropods. Burrowing by crabs is intense – also responsible for the mottle appearance of the muds in the exposed creek margin. Small rotational slumps occur on the cut-bank (image centre). Slumped material in the creek bed is gradually dispersed by successive tidal flows.

A small tidal creek just beyond the downstream limit of salt marsh, Whitford, south Auckland (about 60 cm deep). Ebb tidal flow is from image bottom to top. The sediment here is soft, grey mud that becomes dark green and anaerobic a few centimetres below the surface. The surface is littered with Amphibola crenata gastropods. Burrowing by crabs is intense – also responsible for the mottle appearance of the muds in the exposed creek margin. Small rotational slumps occur on the cut-bank (image centre). Slumped material in the creek bed is gradually dispersed by successive tidal flows.

Tidal creeks that intersect and drain salt marshes receive regular tidal flow but only to bank-full levels during spring tides. Most of the creeks terminate over the marsh surface and there is no continuous through-flow like that in larger tidal inlets and estuarine channels. Consequently, creek sediment is dominated by muds and silts, with the introduction of some sand and gravel during high energy storm events.

Deposition in small creeks, like that shown above, will be dominated by massive or weakly laminated muds and pockets of chaotic blocky muds derived from rotational slumping of creek margins. Burrowing by a variety of invertebrates may completely obliterate any pre-existing sedimentary structures. Roots may extend into the channel margins.

Larger channels show a more diverse array of sedimentary structures including:

  • Large-scale, shallow dipping laminae consisting primarily of silty muds and thin sandy beds; the dipping beds are analogous to point-bar foresets.
  • Ripples and small pebble-filled scours.
  • Thin organic-rich layers, possibly with root structures.
  • Dipping beds merge with slump packages that form on the steeper cut banks.
A schematic tidal creek profile oriented normal to the channel axis, based partly on the Whitford creek image above, and partly on inference. The dominant lithofacies is clay and silty clay, with some thin sandy veneers along point-bar foresets. The rotational slump glide-planes terminate at the creek floor.

A schematic tidal creek profile oriented normal to the channel axis, based partly on the Whitford creek image above, and partly on inference. The dominant lithofacies is clay and silty clay, with some thin sandy veneers along point-bar foresets. The rotational slump glide-planes terminate at the creek floor.

Regular tidal flooding in the creeks means that they can support a more diverse invertebrate fauna – not only burrowing crabs, worms, and shrimp, but also bivalves and gastropods. For example, Holocene creek deposits in Fundy Bay contain passively filled Mya arenaria and Macoma balthica bivalve burrows several centimetres deep. Worms and shrimp can construct more complex U-shaped burrows with meniscate fills and linings (Dashtgard and Gingras op cit.).


Stratigraphic trends

A stratigraphic section through shell-sand tidal flat and overlying salt marsh clay-silt deposits, capped by a plant-rich organic layer. Root structures in the marsh deposits extend into the top of the shell-sand. The marsh also contains simple vertical burrows, probably excavated by crabs. The tidal flat molluscan fauna is dominated by venerid bivalves. The deposit is late Holocene in age. The section is exposed in a dug canal. Whitford, south Auckland.

A stratigraphic section through shell-sand tidal flat and overlying salt marsh clay-silt deposits, capped by a plant-rich organic layer. Root structures in the marsh deposits extend into the top of the shell-sand. The marsh also contains simple vertical burrows, probably excavated by crabs. The tidal flat molluscan fauna is dominated by venerid bivalves. The deposit is late Holocene in age. The section is exposed in a dug canal. Whitford, south Auckland.

Salt marshes, like other coastal paralic depositional settings, occur at the intersection between marine shelf or platform and terrestrial environments. Their preservation and stratigraphic representation depend on whether the depositional system is regressive and prograding, or transgressive and retrogradational. A typical stratigraphic profile for normal regression and progradation is shown below.

A typical coarsening-upward lithofacies motif that can develop during normal regression and coastal progradation (deeper shelf not included). The upper part of the column represents common paralic depositional environments at the transition from marine to non-marine conditions, culminating with salt marsh deposits. Shoreface ravinement during transgression may remove all or some of these deposits.

A typical coarsening-upward lithofacies motif that can develop during normal regression and coastal progradation (deeper shelf not included). The upper part of the column represents common paralic depositional environments at the transition from marine to non-marine conditions, culminating with salt marsh deposits. Shoreface ravinement during transgression may remove all or some of the marsh deposits.

Stratigraphic trends that indicate progradation are commonly represented by coarsening upward or bed-thickening upward successions that record the progression from relatively deep water (for example below storm wave-base) to shoreface, and culminating with the deposits of paralic environments that in this case includes salt marsh. The stratigraphic trend is exemplified by an upward- progression in grain size and bedforms (particularly ripples, subaqueous dunes, HCS) that reflect increasing wave and current energy across the sea floor, and changes in biota – invertebrates and their trace fossil record. Ideally, the upper part of the succession might include evidence for subaerial exposure (e.g. scour surfaces, desiccation structures, beach rock).

[paralic here refers to any depositional system at the junction of marine- terrestrial environments: beach, barrier island, coastal dunes, lagoon, estuary, tidal flat, coastal plain, delta interdistributary bay].

Shoreline retreat during a rise in relative sea level will drive the landward excursion of salt marshes – the survival of the marsh system will depend on whether they can keep up, catch up, or give up as a consequence of inundation. Marsh cliffs will retreat under constant attack by waves. The preservation potential of salt marshes during transgression (like most other paralic depositional systems) is also reduced by erosion beneath the shoreface as it migrates in tandem with the shoreline. Shoreface ravinement can remove all or some of these deposits.


Here’s the link to posts on other lithofacies

Facebooktwitterlinkedininstagram
Facebooktwitterlinkedin