A series on clay minerals – their crystal chemistry, identification, formation
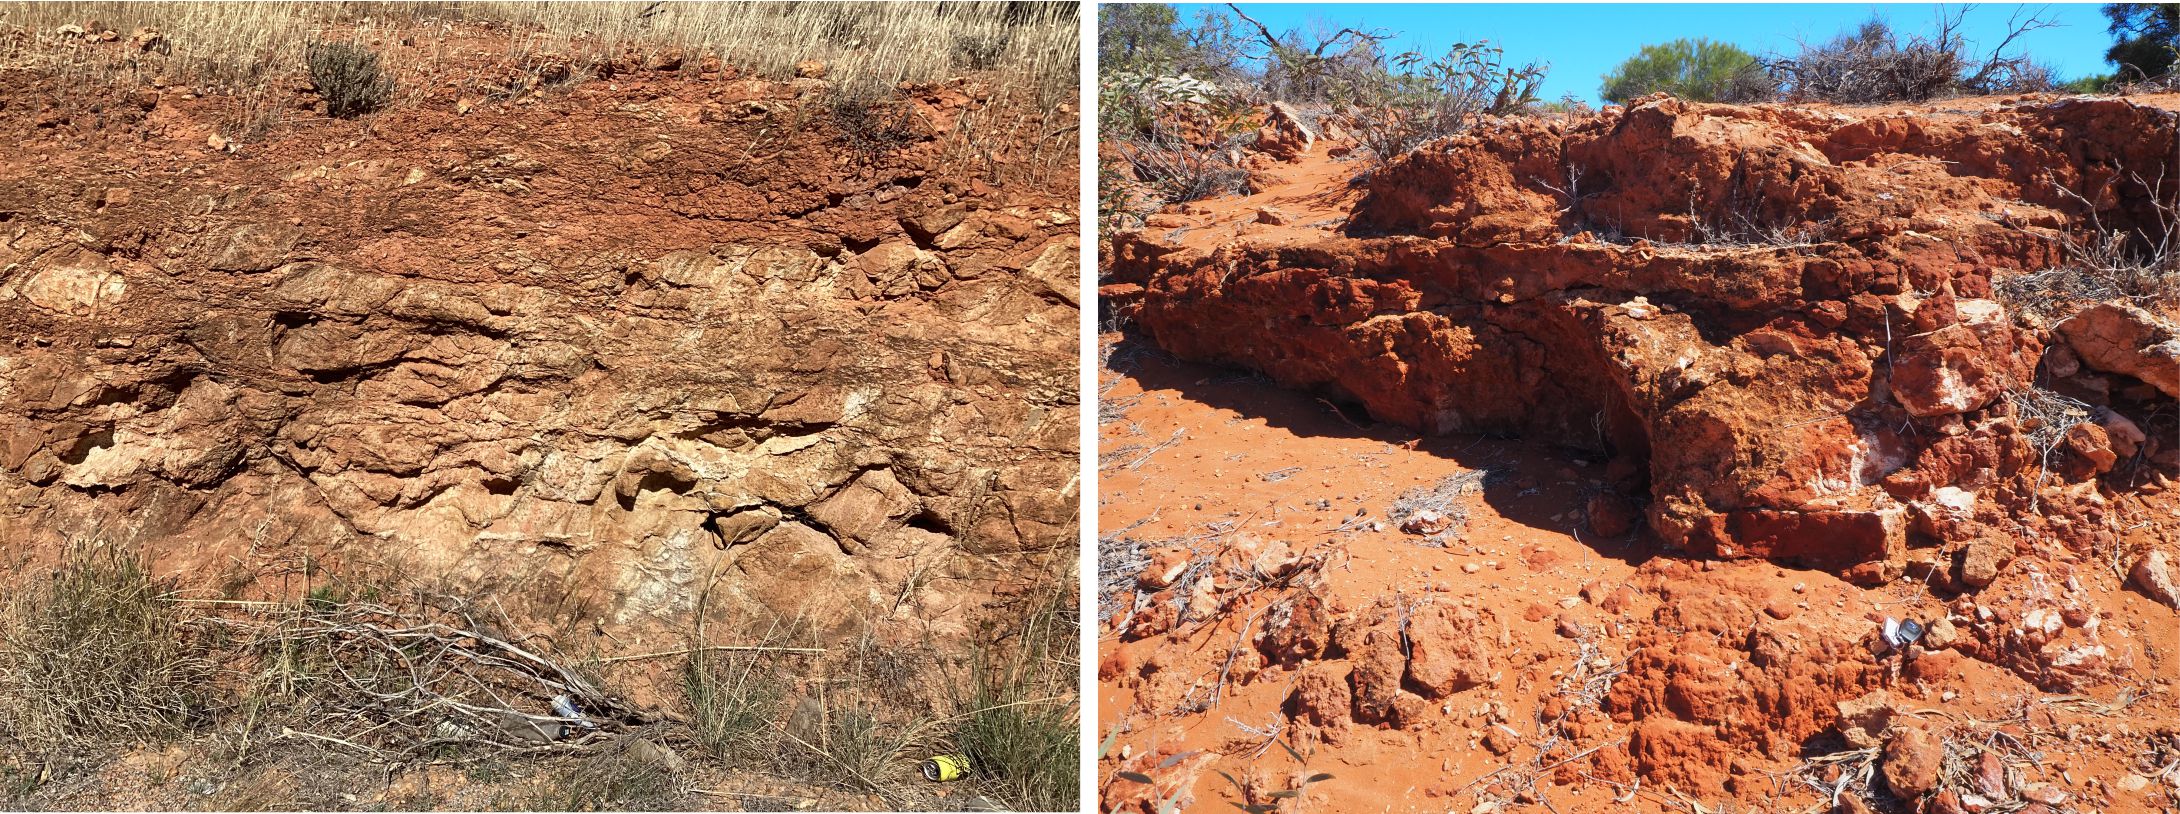
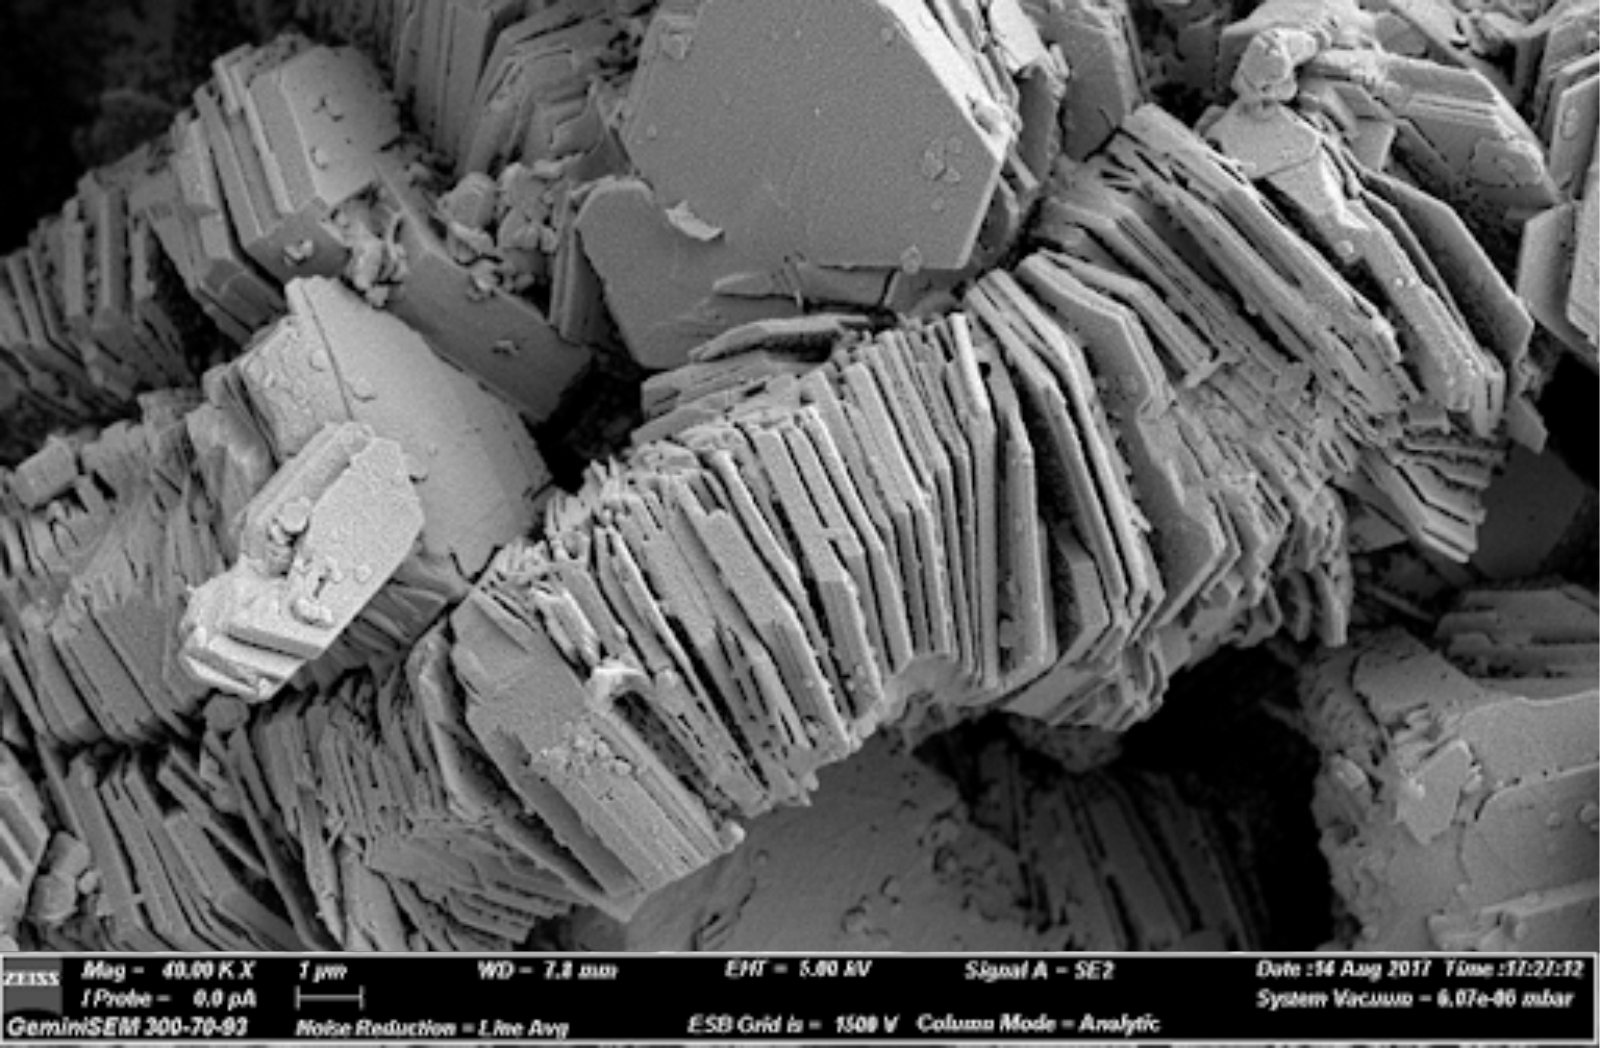
Sedimentary clays are tiny. The Udden-Wentworth upper grain-size limit is 4μm; the common granulometric size for analytical methods is ≤ 2 μm (0.002 mm). Clay crystal size coupled with their complex mineralogy underscores the inadequacy of standard microscope methods of identification. It may be possible to recognize the general presence of clays in thin section but extending that observation to specific mineral species identification is next to impossible.
The standard analytical method is X-ray diffraction (XRD), supplemented by infra-red (IR) spectroscopy. X-ray methods provide information on crystal lattice structure, with emphasis on the 1:1 and 2:1 layers normal to (001) crystal faces. IR spectra provide information on crystal structure and cation composition; clay mineral differentiation is based largely on the spectra generated by energy absorption of O-H, Si-O, and Al-O bond groups.
Sample preparation for both methods requires the initial separation of clays from their host sediment or rock – a non-trivial operation that, if done incorrectly, can result in misidentification of mineral species. Several publications have been devoted to this topic, including flow charts of the preparation-identification procedures (a good example is the USGS Lab Manual and flow chart by Poppe et al., 2001). The summary herein is based on these accounts (listed at the end of the article).
This post focuses on X-ray diffraction of clays.
XRD identification
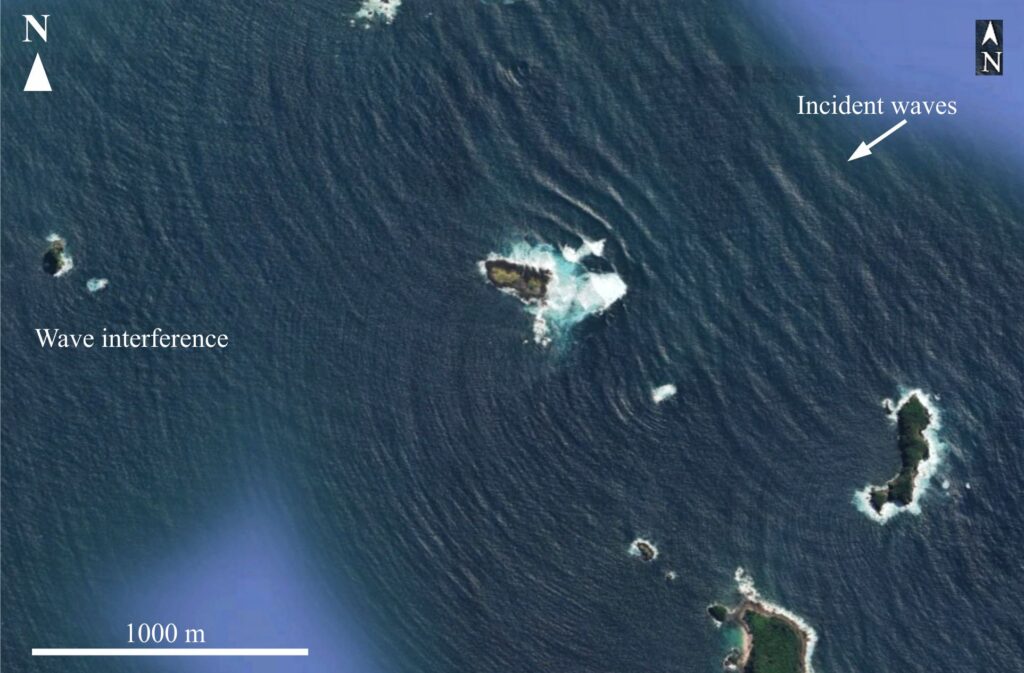
Diffraction involves the behaviour of transverse waves when they pass through a narrow slit, aperture, or around a solid edge. The fundamental requirement for diffraction is that the wavelength of the incident waves is greater than the aperture of the opening. Diffracted waves that exit an aperture expand radially, regardless of the direction of the incident waves. Wave diffraction applies to light, sound, and gravity waves like those generated by wind shear over water or atmospheric clouds.
When a focused X-ray beam enters a crystal, it is scattered in multiple directions by the atomic planes that comprise the lattice. Some reflections are cancelled by destructive interference; others are enhanced – these are the diffracted rays. Because the atomic structure of a crystal is unique, the pattern of diffracted rays will also be unique. The relationship between the X-ray wavelength and the characteristic spacing that separates atomic planes (for example 001 planes) is known as the Bragg Law, expressed as:
2d (Sin θ) = λ
Where d is the lattice spacing between specific atomic planes (measured in angstroms; one Å = 10-10 m); θ (theta) is the incident angle of the X-ray beam to the crystal plane, usually expressed as 2θ (two theta); and λ is the wavelength of the X-rays. ‘d’ is usually stated as the d-spacing for a particular set of crystal planes.
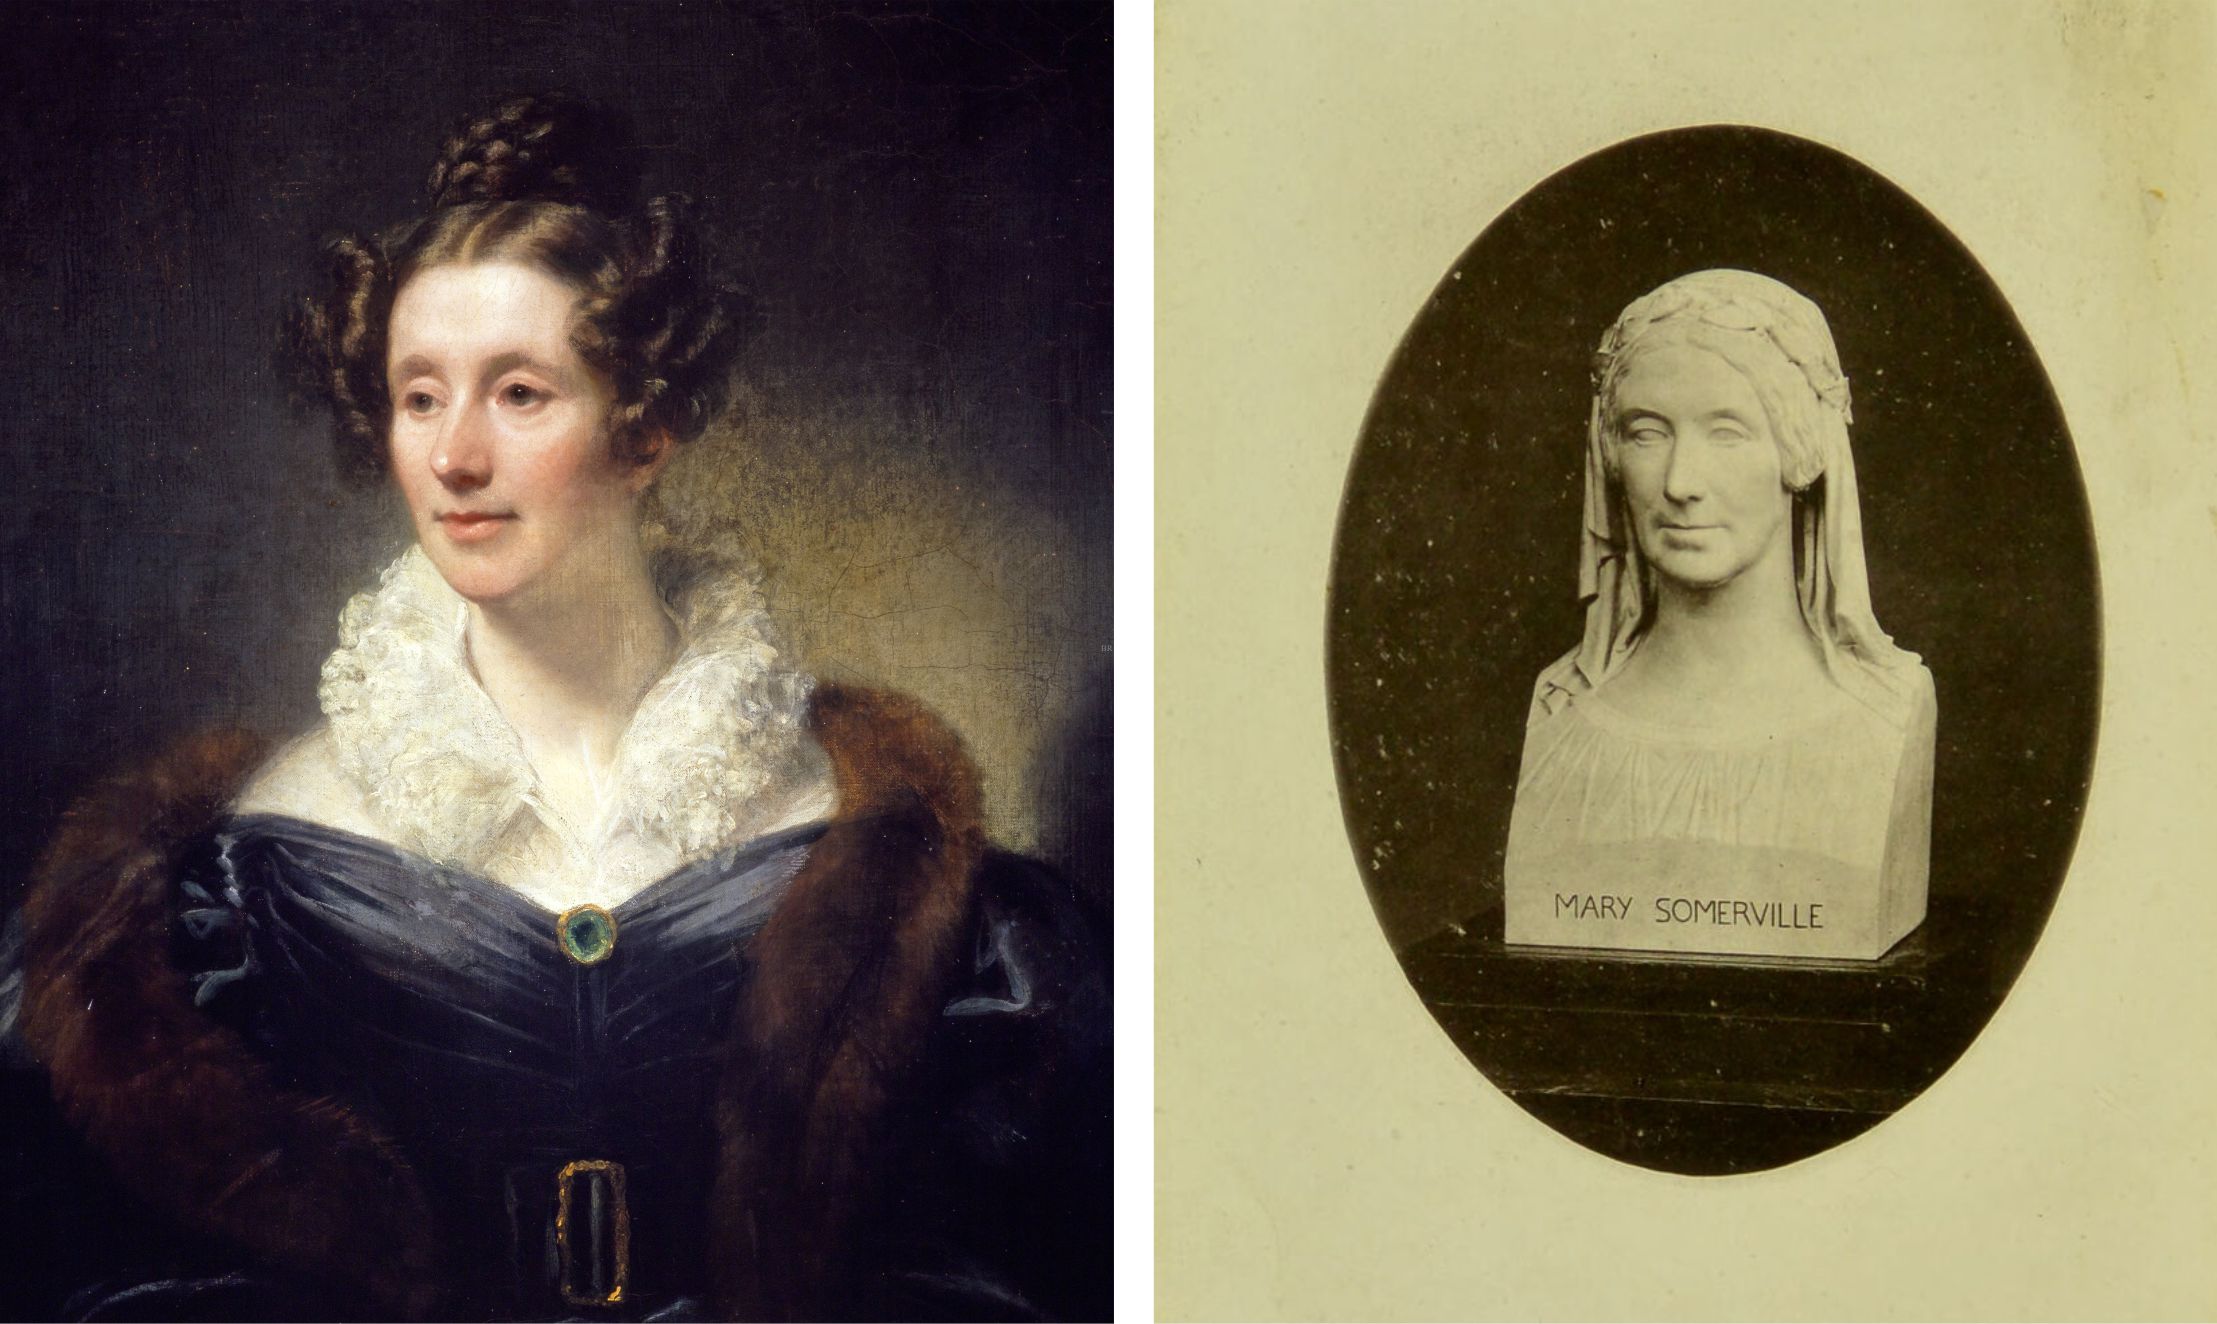
[Lawrence Bragg and his father William Henry Bragg worked together on the physics of crystals and XRD identification, for which they jointly received the Nobel prize in 1915]

Clay separation
The standard size fraction for clay analysis is ≤2 μm. Separation of the clay fraction is beset with two main problems; dilution of the clay fraction by other minerals (particularly framework minerals), and alteration of clay composition and crystal structure introduced by changes in pH and reactions with electrolytes.
Separation in unconsolidated sediment or soil requires gentle physical breakage, or breakage generated by repeated freeze-thaw of a water-saturated material. Ultrasonic treatment is also useful for breaking down clay aggregates. Separation of the 2μm fraction is done by gravity settling in a water column and/or centrifuge.
Indurated rock requires different treatment. Induration of sediment is caused by compaction and precipitation of cements – primarily silica, carbonates, iron oxides, sulphates, and clays. The method used to separate clays under these conditions depends on the composition of the parent material. Acetic acid and hydrogen peroxide are used to disaggregate respectively, carbonate- and organic-bearing rocks. Weak acid treatment can cause some damage to clay structures, but the effects are reasonably documented and can be accounted for.
The problem with these chemical methods is the release of cations (Ca, Mg, Na) that can act as electrolytes, promoting clay flocculation. In addition, cation exchange can alter clay mineral composition and the spacing between tetrahedral and octahedral sheets. Electrolytes introduced during the separation process also need to be removed before the clay separates are dried. Common methods include repeated dilution of the clay-electrolyte dispersion, or repeated dialysis in distilled water (a method that depends on the different diffusion rates through a porous membrane).
Sample preparation
XRD analyses require deposition of the clay separates on a glass slide (glass is noncrystalline and doesn’t mask crystal diffraction patterns). It is common practice to produce slides with randomly oriented crystals, and a second sample with oriented crystals. Random orientations allow X-rays to interact with all crystal faces (hkl). This sample type is prepared by spraying the slide with wet dispersed clay, or by physically packing dry clay onto the slide (also called loading). Random-oriented mounts are preferred for quantitative clay analysis.
Slides prepared with oriented crystals are particularly useful for clay analysis because tetrahedral and octahedral layers are parallel to the basal (001) crystal face. Oriented samples can be prepared from slurries, or by centrifuge of clay dispersions.
Sample treatment
Identification of clay minerals is improved using three treatments that are applied to oriented clay mounts; each treatment induces changes to crystal structure and components of their composition, producing predictable changes to the diffraction peak position and intensity for specific minerals. The sample treatment progression from untreated to 550o C heating provides a logical pathway for distinguishing the different clay minerals in multimineral samples (i.e., an average sedimentary rock), and from other framework and diagenetic minerals like quartz, feldspar, and the carbonates.
- Initial air dry
Drying at 60o C removes excess water that remains after sample processing; there are no significant compositional or structural changes to clay minerals at this temperature.
- Ethylene glycol treatment
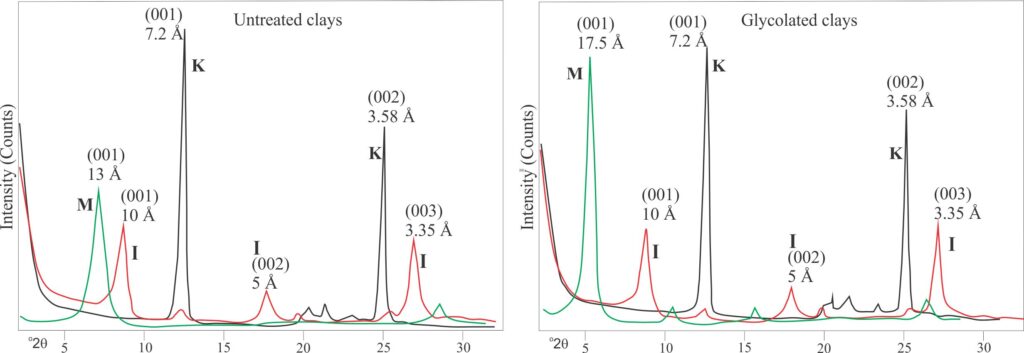
Ethylene glycol (antifreeze) or glycerol are used to expanding the lattices of swelling clays such as the smectites, vermiculite, and mixed layer clays that incorporate either of these groups. The organic compounds form complexes in the spacings between 2:1 layers, replacing some of the water molecules. The larger molecular complexes force the (001) lattice faces farther apart. Lattice expansion is represented in diffractograms as enhanced peaks. Glycolation is usually done at temperatures of 60o C to 80o C.
- Heat to 400o C
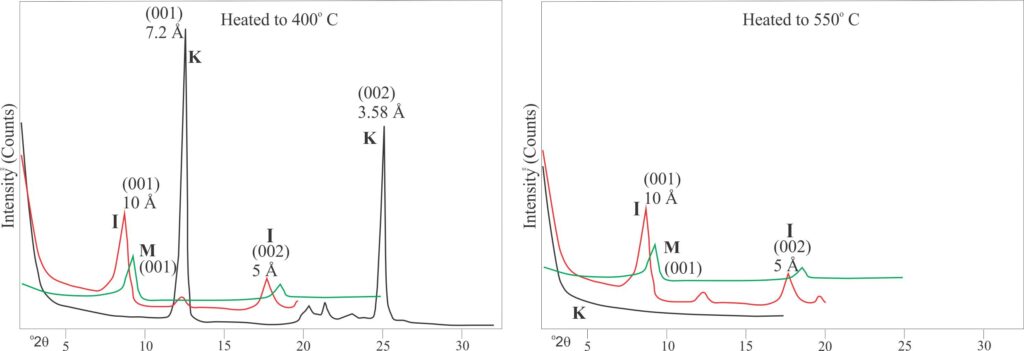
Heating of clays can result in dehydration, such as the loss of interlayer water in smectites and vermiculite, and in some cases dehydroxylation where OH– anions are removed from tetrahedra and octahedra. Smectites at 400o C loose much of their interlayer water resulting in lattice collapse and a reduction in the (001) d-spacing. At this temperature, kaolinite also begins to break down because of dehydroxylation, whereas illite and chlorite are unchanged.
- Heat to 550o C
Additional heating to 550o C may completely disrupt the kaolinite lattice such that most of its peak reflections disappear. Dehydration of smectites and vermiculite continues, further reducing the interlayer spacing, and structural changes to chlorite can also affect the (001) spacing. Illite on the other hand remains unchanged.
XRD characteristics of clays
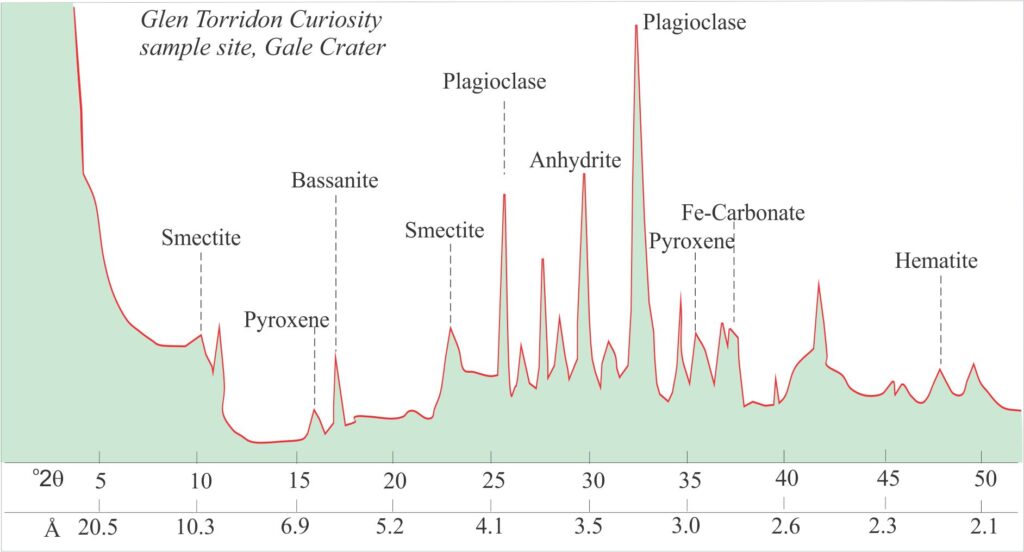
A typical XRD plot shows reflections at their respective 2θ angles (x axis), against peak intensity (measured as the number of counts recorded by the X-ray detector). The d-spacing for any peak is calculated using the Bragg Law. Examples for kaolinite, illite, and montmorillonite from the USGS Manual (see previous link), illustrate the effects of sample treatment on the 2θ value and peak intensity (all oriented mounts). In all clays the most prominent peak corresponds to the (001) basal plane. The effects of glycolation and heating on this and other peaks, for example peaks corresponding to (002) and (003) planes, form the basis for distinguishing among different clay species.
Characteristic patterns
- Kaolinite and illite are unchanged by glycolation and heating to 400o C. At 550o C the kaolinite lattice collapses, but illite is unchanged.
- The addition of glycol to montmorillonite expands the lattice d-spacing from 13 Å to 17.5 Å. Heating reduces the d-spacing to about 10 Å because of dehydration.
- Heating vermiculite (not shown here) produces effects similar to the smectites, with significant reduction in d-spacing.
- D-spacings of chlorite 001 peaks are in the range 14-14.4 Å (not shown here). Chlorite is stable during glycolation and heating to 400o C, but at higher temperatures the (001) peaks commonly become more intense.
- The main illite peaks at 10 Å, 5 Å, and 3.3-3.5 Å are unchanged during glycolation and heating; these are the main criteria used to differentiate illite from kaolinite and smectites. However, they are also the main peaks for dioctahedral muscovite and glauconite and differentiation of the three minerals can be difficult. Other useful characteristics such as crystallinity and habit can be seen in scanning electron micrographs, and the thin section appearance for glauconite (typically bright green and microcrystalline). Detrital muscovite may show wear and tear under scanning electron microscopy, and deformation from compaction. The distinction between illite and muscovite in low grade metamorphic rocks is more problematic, in part because of diagenetic-metamorphic reactions where illite converts to the higher ordered muscovite form. A method that has proved successful is to heat the sample above 550o C at which point illite loses hydroxyl anions; dehydroxylation of muscovite begins about 800 C, and for biotite 1000 C (biotite is a trioctahedral mica).
Other posts in this series
Mineralogy of the common clays
Texts and Manuals on clay analysis and identification
Brindley, G.W., Brown, G. (Eds.), 1980. Crystal Structures of Clay Minerals and their X-ray Identification. Mineralogical Society, London. Volume 5.
L.J. Poppe, V.F. Paskevich, J.C. Hathaway, and D.S. Blackwood. 2001. A Laboratory Manual for X-Ray Powder Diffraction. U. S. Geological Survey Open-File Report 01-041.
D. M. Moore and R. C. Reynolds, Jr., 1997. X-ray Diffraction and the Identification and Analysis of Clay Minerals. 2nd Ed. Oxford University Press, New York.
Srodon, J. 2006. Identification and Quantitative Analysis of Clay Minerals. Chapter 12. Handbook of Clay Science, Developments in Clay Science, Vol. I, Elsevier.
Srodon,J. 2013. Identification and Quantitative Analysis of Clay Minerals. Chapter 2.2. Handbook of Clay Science, Developments in Clay Science, Volume 5, pp. 25-49, Elsevier.
