This is the second of two posts on scale-independent, experimental stratigraphic modeling using the Experimental EarthScape (XES) facility at St. Anthony Falls Laboratory, Minnesota University. The first post describes the experiment design and boundary conditions.
Images of the experiment were generously provided by Chris Paola (now emeritus professor at Minnesota University).
Preamble
The experiment conducted by Martin et al., (2009) was designed to evaluate the geometry and chronostratigraphic significance of sequence stratigraphic discordances in a scale-independent model sedimentary basin in which the only variable was cyclical change of base level (an analogue for sea level).
Significant sequence stratigraphic surfaces
The criteria commonly used to identify significant sequence stratigraphic surfaces include:
- Diagnostic sedimentary criteria: for example, field recognition of subaerial unconformities using paleosols and vadose-zone diagenetic features.
- Stratigraphic trends; well-tested examples include the transition from shoreface-lagoonal to overlying subtidal deposits across a ravinement surface, or shallow marine deposits (above wave-base) overlain by deeper water deposits on a maximum flood surface.
- Surface topography, focusing on the correlation between subaqueous and subaerial topographic surfaces and their chronostratigraphic significance.
- Lapout geometry of strata packages in laterally extensive outcrop, 2D reflection seismic and ground-penetrating radar profiles. The observational basis for identifying lapout signatures was derived from seismic profiles.
The last of two methods are ideally suited to experimental physical stratigraphy where topography can be imaged over the duration of the experiment, and where 2D and 3D sectioning of deposits is possible.
The chronostratigraphic significance of experimental topographic surfaces
Topographic surfaces, whether subaerial or beneath the waves (marine, lacustrine), can be viewed as surfaces in time. During deposition they represent instants of time; between periods of deposition or erosion they can represent longer time intervals. From a stratigraphic perspective we recognize two kinds of time-related surface: chronostratigraphic or isochronous surfaces that represent instants in time (or perhaps from a practical standpoint very brief intervals of time), and surfaces that are time-transgressive. Time-transgressive surfaces can be thought of as a bundle of chronostratigraphic surfaces. The relationship between the physical attributes of sequence stratigraphic surfaces (such as sequence boundaries, maximum flood surfaces) and time is paramount – it is one of the building blocks of sequence stratigraphy.
For the XES experiment, significant effort was made to record the evolving subaerial and submerged topography at regular intervals during each stage of base level change. The data enabled the construction of topographic profiles and surfaces (using digital elevation models) that could then be correlated with the stratigraphic surfaces identified in the 2D sections (slices) of the deposit to evaluate their chronostratigraphic significance.
Experimental base level and subsidence
Maintenance of basement subsidence is described in the companion post and in the diagram below. Base level was varied in two stages, the rates and duration of which are referred to as slow cycles, rapid cycles, superimposed rapid cycles (SRC), and equilibrium periods (constant base level), also summarized in the diagram below.
Experiment results
The experiment began with a 26 hour period to initiate deposition – base level was constant. Stages 1 and 2 followed. The constant supply of water and sediment resulted in a delta-shaped depositional system that at its proximal, landward end built a fluvial platform, and distally a delta slope. Cyclical changes in base level resulted in alternating advance and retreat of the shoreline, and variable exposure and submergence of the delta slope.
Fluvial exposure
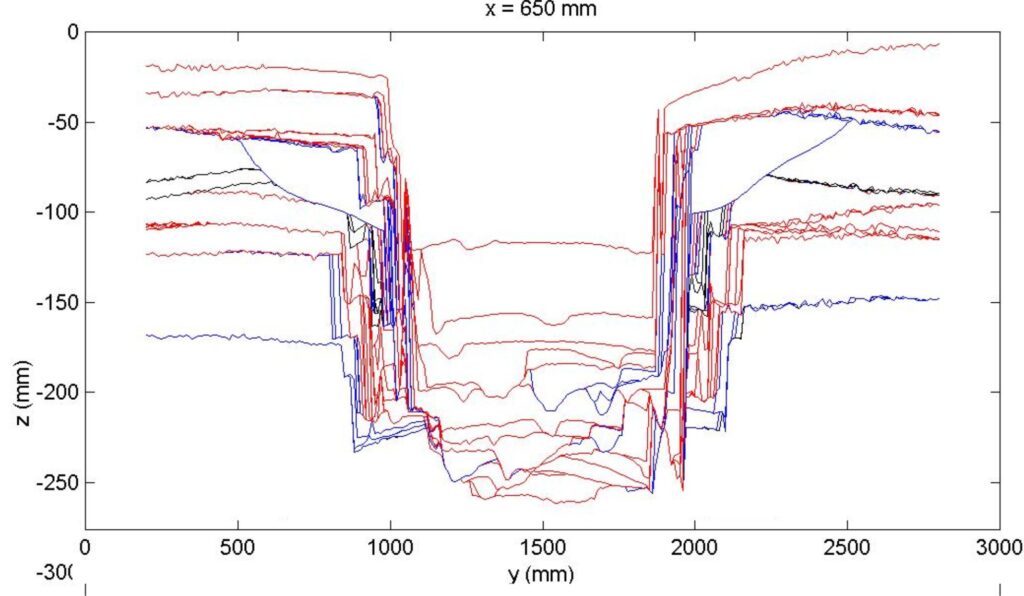
The fate of fluvial channels in these experiments depends on the rate of base level change. In this experiment there were three periods when base level was steady (referred to as equilibrium periods); water and sediment supply, and subsidence rates were constant. Under these conditions, sediment accommodation is solely a function of relatively slow subsidence. During periods of constant base level or slow base level fall, channels tend to migrate laterally in concert with the growth and erosion of within-channel bars and chutes. Under these conditions the fluvial surface is constantly being renewed. This means that the chronostratigraphic significance of the surface at any time during base level change is difficult to determine.
At the other extreme, when base levels fall rapidly (in addition to subsidence, as in the rapid and SRC cycles) channel incision is deeper and lateral migration is limited. This means that successive rapid cycles will renew the incised channel fill.
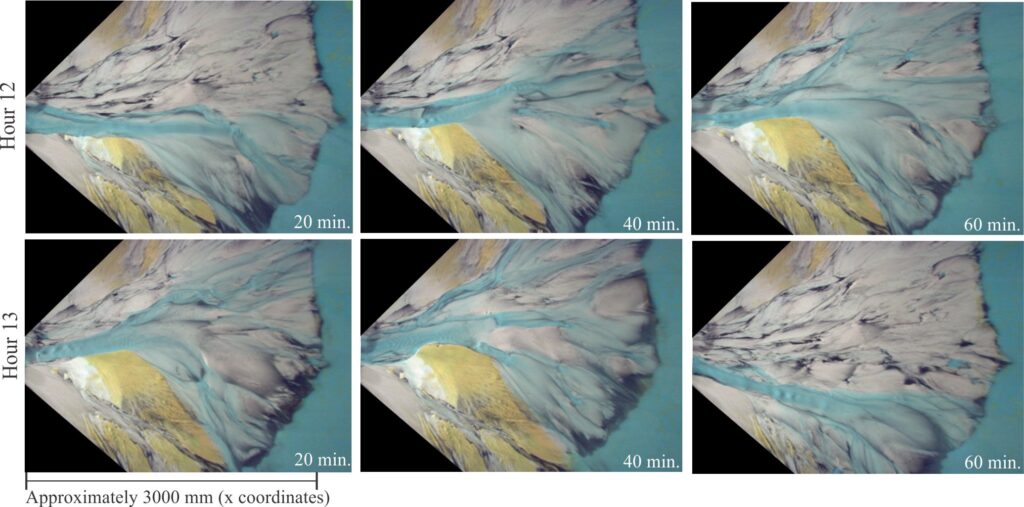
The scenes shown below illustrate these fluvial dynamics. They are taken from hours 12 and 13 scans during the initial 26-hour period of deposition where base level, subsidence, and sediment supply were constant. Channel loci continually shift laterally in concert with the developing subaerial relief and a slowly prograding shoreline. Erosion of earlier formed fluvial deposits also provides sediment mass that is dispersed to new channel bars, the shoreline, and beyond. Given that all the controls on deposition are constant during this period, the changes in fluvial morphology and topography are predominantly autogenic.
Shoreline and base level
Base level, an analogue for sea level, is the measured water level in the XES tank; any change in elevation can be measured from any point along the sides of the tank. The experimental shoreline elevation is inextricably linked to base level. However, the actual position of the shoreline (x-y-z coordinates) depends on the interplay among base level, sediment supply, and basin-floor subsidence. In this experiment, base level and the rate of change of base level are the only variables that change.
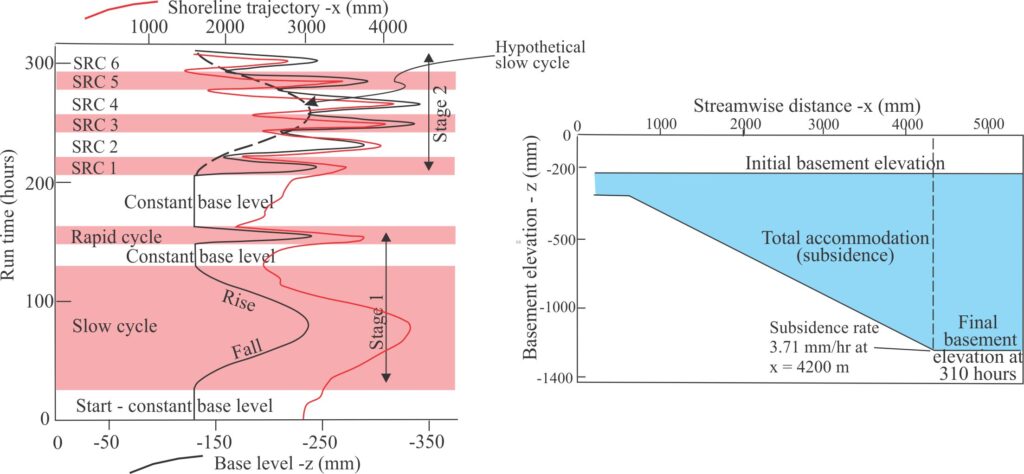
For each of the three periods where base level is constant, the shoreline migrates basinward which means that the rate of sediment supply must exceed the rate at which accommodation space is created by subsidence alone (in the absence of sediment supply the shoreline would retreat with subsidence). This applies to all the other cyclical changes because the rates of sediment supply and subsidence are constant throughout.
For the slow cycle, the shoreline trajectory curve is asymmetrical. During base level fall both base level and subsidence are moving in the same direction; continued sediment supply will augment the advance of the shoreline. The shoreline elevation change is close to that of base level; it also advances further into the basin than at any other time during the experiment. Shoreline retreat during base level rise is augmented by subsidence and results in the rate of retreat being greater than the rate of shoreline advance – hence the asymmetry in the shoreline trajectory curve.
Shoreline behaviour changes during Stage 2 of the experiment wherein 6 higher-order (rapid) cycles (SRC 1 to 6) were superimposed on a ‘slow cycle’ (SC) that was the same duration as the earlier slow cycle (108 hours). SRC 1 and 2 straddle the inflection point on the falling limb of the (SC) curve, SRC 3 and 4 occur either side of the (SC) peak, and SRC 5 and 6 the rising limb of the (SC) curve. Shoreline retreat is greatest where SRC base level rises are superimposed on the (SC) base level rise. In such cases, base level forcing significantly outweighs the combined effects of subsidence and sediment supply.
Discordant stratigraphic surfaces in dip sections
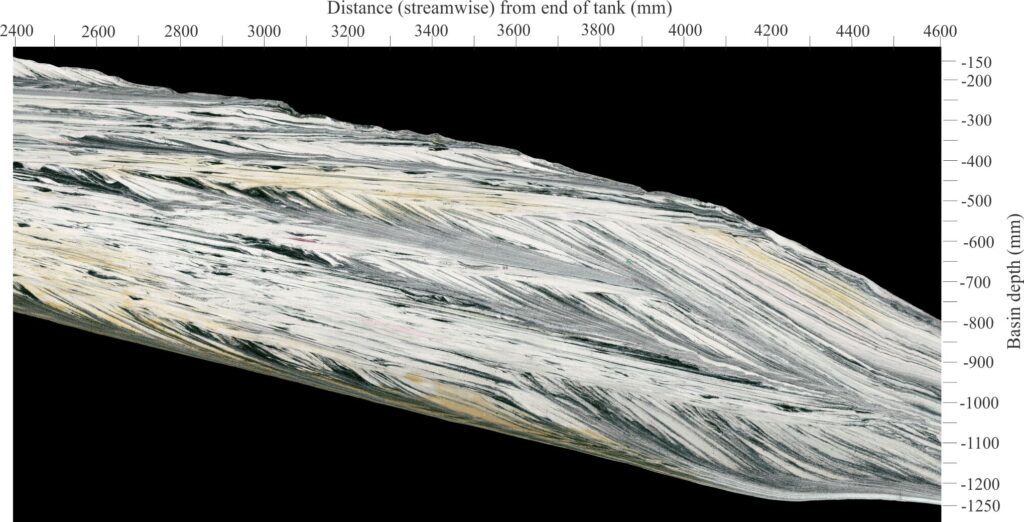
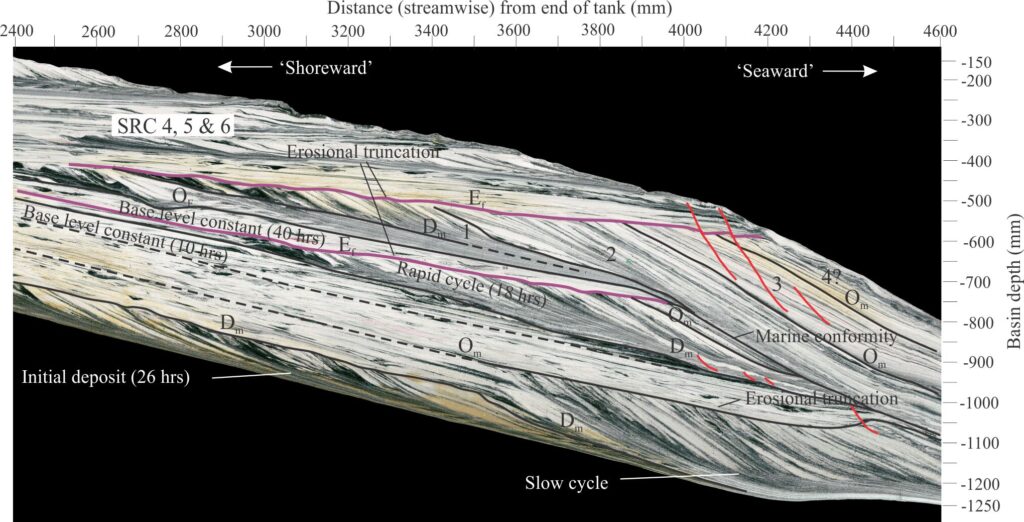
The dip section imaged here was sliced at a strike distance of 1520 mm – about half-way across the model domain. The nearest section in Martin et al (Figures 4 and 7, op. cit.) is at 1550 mm, close enough for reasonable interpolation of stratigraphic surfaces.
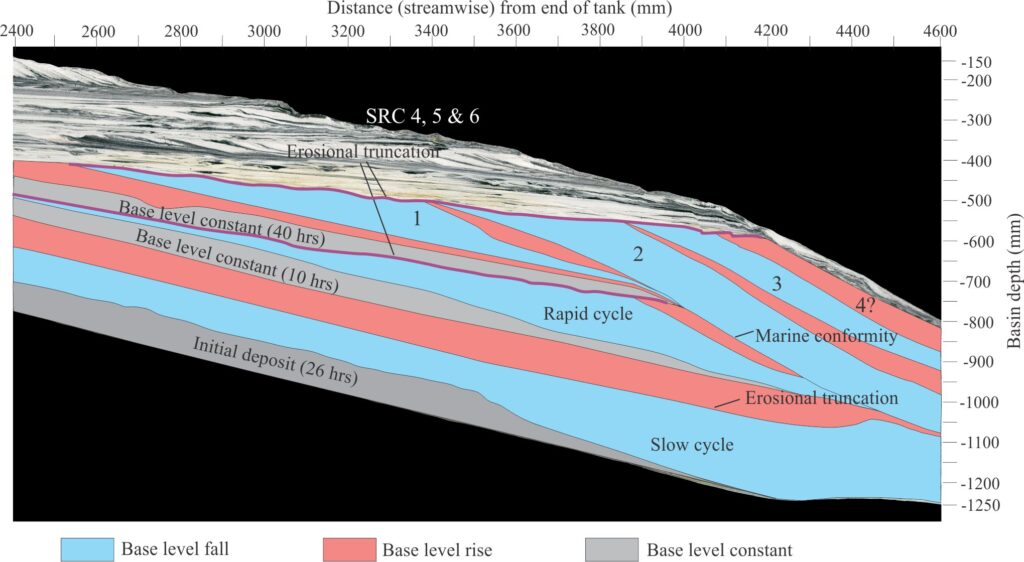
Most prominent are the surfaces of downlap, onlap, and erosional truncation. It is important to distinguish the actual stratigraphic surfaces, or contacts, from the immediately underlying and overlying overlying packages of strata. For example, in this experiment an onlap surface forms above a downlapping stratal package during base level fall, but the stratal package that onlaps this surface accumulated during base level rise.

Downlap surfaces
One of the standout features of these deposits is the large, basinward-dipping foreset packages. Foresets dip 25o to 30o. Foresets show progressive. basinward downlap on surfaces that also dip basinward (Dm in the diagram). Deposition of the foreset packages occurs when sediment supply to the basin is at a maximum. The downlap foresets formed during stable or falling base level in both the slow and rapid cycles. Like the Om surfaces, it is important to recognize that whereas downlap strata formed during base level fall, the surface on which they downlapped (Dm) formed during the preceding base level rise.
Dm surfaces are good approximations of chronostratigraphic surfaces when correlated with associated topographic profiles. In the slow, rapid, and SRC cycles they approximate highstand systems tracts.
Erosional truncation
The upper contacts of foreset packages are truncated by an erosional surface at two stratigraphic locations in the 1520 mm section (surfaces Ef). There is significant relief on both surfaces. Both surfaces formed by fluvial erosion during (allogenic) base level fall and the early stage of base level rise; associated local channel scouring was probably autogenic. Although it is tempting to equate Ef with a subaerial unconformity and therefore a sequence boundary, there is no clear chronostratigraphic relationship between Ef and the experimental topographic surfaces formed during base level fall. Basinward, the Ef surface overlying the rapid cycle merges with a surface that probably equates to a marine conformity.
Onlap surfaces
In this experiment, onlap surfaces (Om) formed during base level fall above downlapping packages of strata. However, the stratal packages that overlie these surfaces accumulate during rising base level; this is the standard case in depositional sequence stratigraphic models (e.g., Catuneanu, 2022). Onlapping strata can terminate against the Om surface either basinward or shoreward during base level rise, but in this experiment, successive stratal terminations are shoreward. Om surfaces do not generally extend as far into the basin as do downlap surfaces; instead, they correlate with conformable surfaces. There is also variation in the lateral (e.g., strike parallel) continuity of Om surfaces, such that two types were recognized (based on mapping topographic profiles and DEMS): widespread Om (good lateral continuity) that correspond to inflection points on base level fall curves, and local Om that consisted of bundles of more discontinuous surfaces for which the chronostratigraphic significance is difficult to decipher.
Laterally continuous Om surfaces are good approximations of chronostratigraphic surfaces when compared with associated topographic profiles. In sequence stratigraphic terminology, the experimental onlap depositional packages should equate with transgressive systems tracts.
The final diagram summarizes the sequence stratal packages that overlie onlap, downlap, conformable, and erosional truncation surfaces in terms of base level rise and fall.
General take-aways from the experiment
- In general terms, scale-independent experiments like this example produce results that compare favourably with natural, depositional sequence stratigraphic systems.
- Concordant and discordant stratigraphic surfaces are readily identified using the standard rules that define lapout geometry.
- Downlap and onlap surfaces form during base level rise and fall respectively. The strata immediately overlying these surfaces were deposited during subsequent base level fall and rise respectively.
- Downlap and onlap surfaces exhibit reasonable chronostratigraphic equivalence with correlated topographic surfaces. Both surfaces are controlled primarily by allogenic processes. The chronostratigraphic equivalence between topographic profiles and erosional truncations of fluvial origin is much more difficult to establish, in part because there is a complex association of autogenic and allogenic forcing that continually modifies the subaerial surface.
Additional reference
Catuneanu, O. 2022. Principles of Sequence Stratigraphy; 2nd Edition. Elsevier Science.
Other posts in the Geological Modeling series
Geological models: An introduction
Model dimensions and dimensional analysis
Analogue models of faults: scaling the materials
Analogue models of orogenic wedges
Self-organization, autocyclicity, and the rock record
Experiments with turbidity currents – some historical context
Experiments with turbidity currents – scaling laws
Experiments with turbidity currents – three examples
