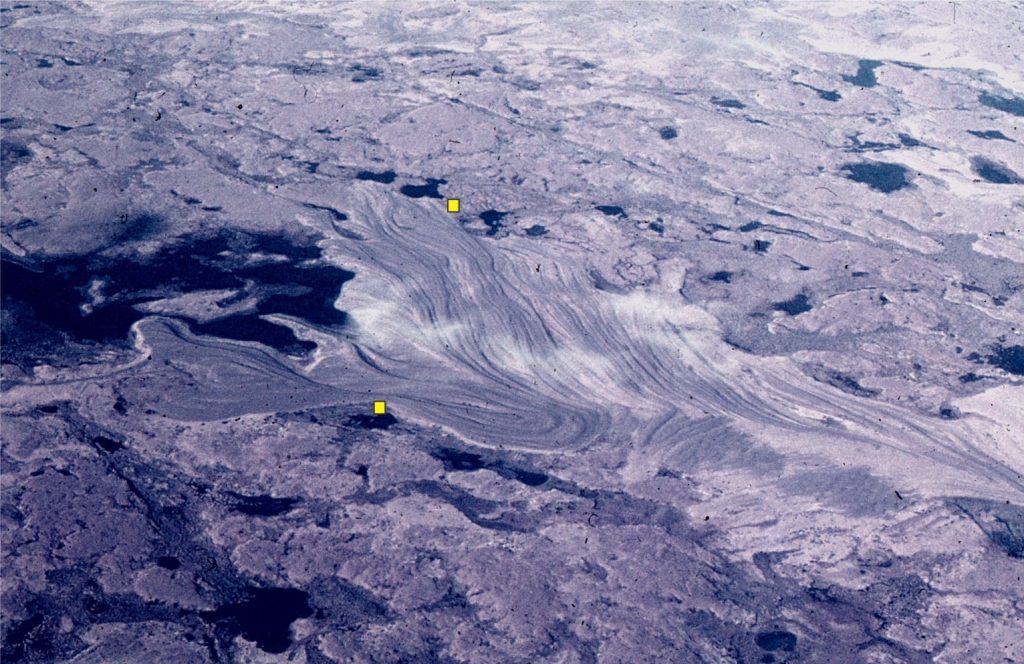

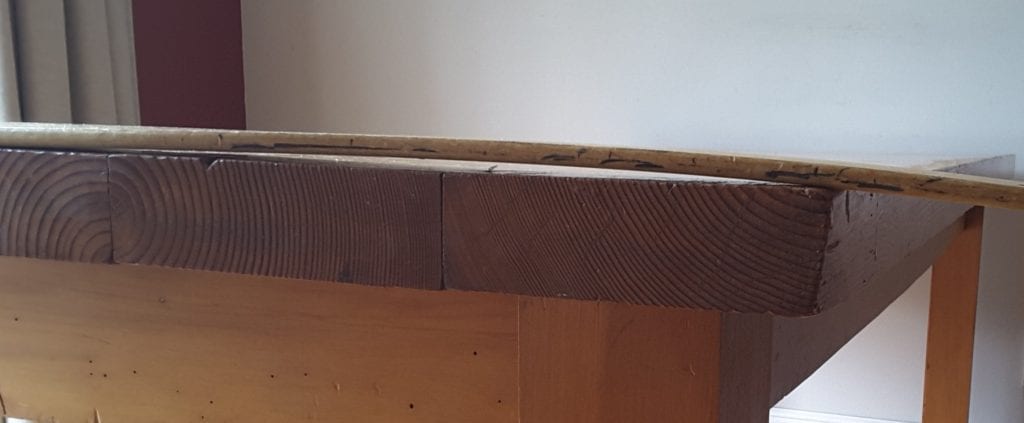
Raised gravel beach ridges resulting from glacio-isostatic rebound following melting of the Laurentide Ice sheet. Belcher Islands. The distance between the yellow dots is 500 m. Modern beach is on the left.
Isostasy describes the state of balance between the lithosphere and asthenosphere.
Isostasy describes the state of gravitational equilibrium in the lithosphere; we can picture this state in Archimedean style as the Earth’s crust floating on a more-dense mantle. Thus, the crust will adjust to loads by moving up or down. In geology, the kinds of loads we commonly deal with are ice sheets, thick sediment accumulations, tectonically emplaced panels of rock, densification during cooling, and changing volumes of water in the oceans. The lithosphere, whatever its configuration, will tend towards this condition of equilibrium. The concept of isostasy pervades nearly all our attempts to qualify and quantify the dynamic conditions of the lithosphere; this includes the dynamics of basin subsidence and uplift.
There is an excellent historical summary of the concept in A.B. Watts equally excellent book on Isostasy and Flexure. The theoretical underpinnings of isostasy are founded on Newton’s laws of gravity and motion. If we think of mountain ranges as the topographic expression of excess mass above a certain datum (such as sea level), then there should be a gravitational attraction towards the mountains. The gravitational effect of topography is manifested as a deflection of a survey plumb line. But a deflection needs to be measured relative to an established line of reference. For geodetic surveys, the reference is determined astronomically using the Pole star that, at the equator, is normal to the geoid.
In the early 18th C, during surveys to determine the shape of the Earth, Pierre Bouguer (of Bouguer gravity anomaly fame) provided one of the first measurements of such a deflection from the plumb line (the survey was in the Quito Mountain district of equatorial Ecuador). The deflection was 1′ 43” of arc, a value that was less than the gravitational attraction he had calculated (one minute is one 60th of a degree). Bouguer didn’t have an explanation for this.
In 1755, Italian astronomer R. Boscovich suggested that Bouguer’s deflection discrepancy was caused by a mass deficiency beneath the mountains, an interpretation that had to wait 100 years for further development. This was initiated by Colonel G. Everest during a geodetic survey of northern India (1840-1859). Using the astronomically determined latitude, he measured a deflection of 5.24” towards the Himalaya mountains (one second of arc is one 60th of a minute, or one 3,600th of a degree). Everest thought the discrepancy was due to errors in measurement.
John H. Pratt, who happened to be in India at that time, took exception to Everest’s explanation. Pratt calculated the expected deflection caused by Himalayan topography at 15.885”, significantly greater than the measured value; he did this by dividing the mountain range into blocks of different density. However, he was unable at that time to explain the discrepancy (Pratt, 1855 – a PDF of the original article read at the Royal Society of London).
Enter Astronomer Royal George Airy. Airy returned to Boscovich’ ‘floating’ model of the crust, using icebergs and Archimedes principle of hydrostatic pressure as an analogy. He suggested that the discrepancy between the expected and measured gravitational deflections was caused by a deficiency of mass beneath the elevated topography (Airy, 1855, PDF available).
Thus were born two important models that express the balancing act where, in a modern context, the lighter crust is visualised to float on a more dense and perhaps more plastic mantle. However, neither Pratt nor Airy introduced the term isostasy; this was left to an American geologist, C.E. Dutton, initially in a footnote to an 1882 publication, then formally in 1889 (On some of the greater problems of physical geology”. Bulletin of the Philosophical Society of Washington. 11: 51–64 – the link takes you to a 1925 reprint that can be downloaded).
The Pratt and Airy models of local isostasy
Isostasy describes the tendency to equilibrium of a lighter lithosphere floating on a more dense and perhaps more ductile mantle asthenosphere, in general obeying the laws of buoyancy. The models shown below are represented by blocks of crust and mantle lithosphere demonstrating local isostatic compensation. Both models rely on the idea of discrete blocks of lithosphere that move independently (compensate) up or down. In local isostasy each block is also loaded independently. The crust does not flex in these models.
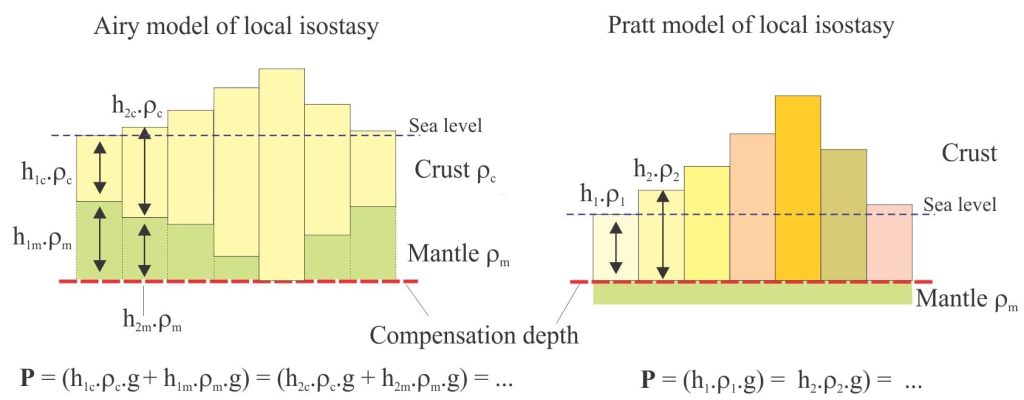

The Airy (left) and Pratt models for local isostasy. P = lithostatic pressure at the depth of compensation; ρc and ρm = density of the crust and mantle respectively; h = height of block above the compensation depth – in the Airy model hm and hc are heights (thicknesses) for the crustal and mantle components respectively; g = gravity constant.
The term compensation is important here – it refers to the depth at which lithostatic pressures are equal. This means that at any point along the line of compensation, the pressure of overlying rock is the same. The simplest mathematical statement of lithostatic pressure at any depth is:
Pressure P = density (ρ) times the gravitational constant (g) times the height or depth to that point (h):
P = ρgh
In the Airy model, all crustal blocks have the same density but different heights, underlain by more-dense mantle. At the compensation depth, the pressure beneath each block is the sum of the pressures exerted by the crust and mantle. Airy’s model is based on the analogy with icebergs where the compensation depth refers to hydrostatic pressure; at equilibrium 90% of the iceberg is submerged, supporting the 10% that is exposed above sea level. Like the iceberg, the greater portion of each crustal block is below sea level – these are the roots of topographic features like mountains. Thus, the mass deficiency predicted by smaller than expected plumb line deflections in the Himalayas indicates that isostatic balance has not been achieved; isostatic compensation (equilibrium) will be achieved sometime in the future unless some tectonic event intervenes.
The compensation depth in the Pratt model is at the base of all the blocks, such that the mantle lies below that depth. However, block density may vary, in which case the topographic height will also vary in a fully compensated system. His model expresses explicitly the difference between oceanic (denser) and continental crust. The model was based in part on his preference for the theory of a contracting Earth.
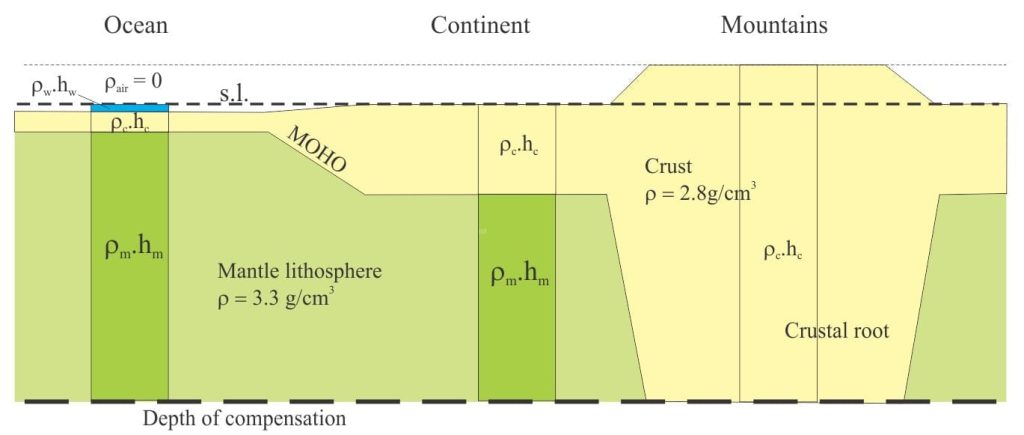

Airy isostatic model of continental and oceanic crust where both crustal components have the same density. The ocean block contains an ocean water component (density = 1). Density and height notation as in the diagram above. Modified slightly from R.J. Lillie, 1999, Whole Earth Geophysics, Fig. 8.20.
Flexural isostasy
Local isostasy provides reasonable estimates of expected heights of mountains or the depths of their roots, and the expected depths of ocean basins, given some knowledge of crustal densities. It also assumes that the underlying mantle-asthenosphere acts like a fluid. However, we know that the crust and mantle lithosphere are quite rigid – rigidity is, after all, the basis for maintenance of coherent tectonic plates.
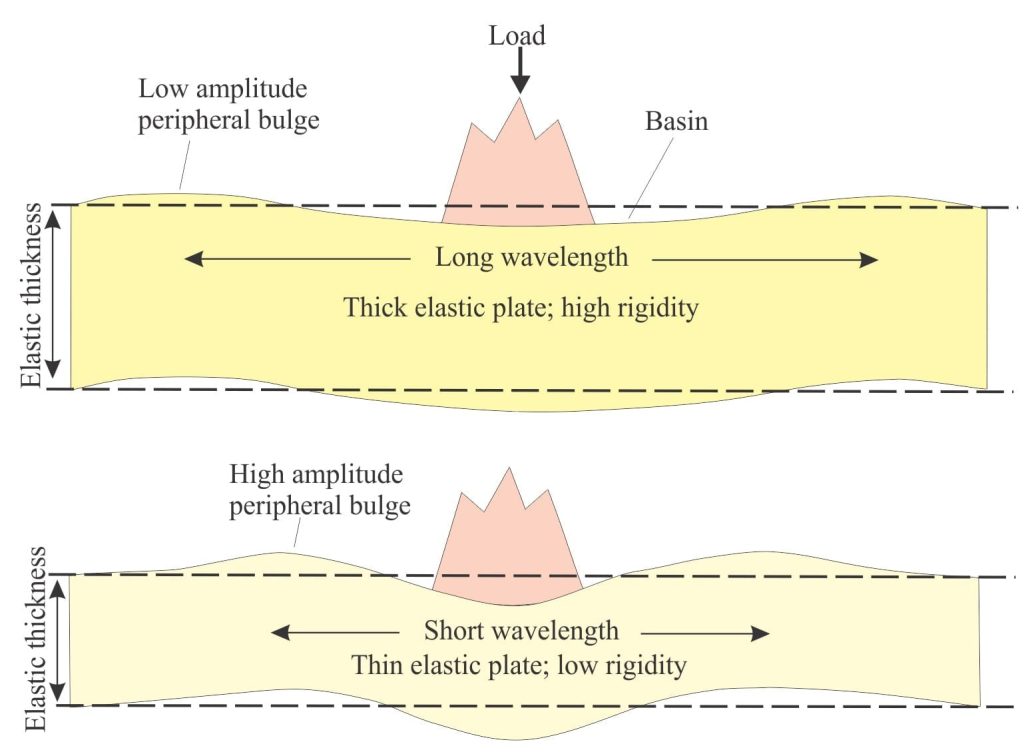

A simplified depiction of elastic lithospheric plates responding isostatically to vertical loads, showing the basic differences in flexural response to thick versus thin plates.
Flexural isostasy, also known as regional isostasy, allows the lithosphere to bend elastically under loads. The amount of flexure depends primarily on lithosphere composition and elastic thickness (also dependent on the thermal architecture). Thus, thin warm lithosphere will bend more than cold thick lithosphere.
The basic principle of isostatic balance still applies to the flexural model, although the mathematics are more complicated. There are significant differences compared with local isostasy.
- Displacement of flexed lithosphere increases with distance from the load to some maximum depth determined primarily by the elastic thickness. Beyond the maximum flexure the deflection decreases. This means we need to consider the flexural wavelength.
- Thicker, more rigid lithosphere will bend less than thinner but will have a longer wavelength.
- Because the lithosphere is rigid, flexure will also develop a low amplitude peripheral bulge. The wavelength of a bulge with respect to the centre of a load is usually measured in 100s of kilometres.

Flexure of an elastic beam requires isostatic adjustments because of the load (excess mass in the mountain topography), subsidence of the lithosphere in front of the load, and the low amplitude peripheral bulge (detailed image below). Erosion of mountains will initiate isostatic rebound. The addition of sediment and ocean water to the flexed basin will also require isostatic adjustment.
An example: Glacio-isostatic rebound of Hudson Bay
The Laurentide Ice sheet was centered over Hudson Bay, where it was 2-3 km thick. The isostatic response to this load resulted in flexural subsidence of about 300 m beneath Hudson Bay, decreasing in surrounding areas. Evidence for rebound following ice sheet collapse and melting is seen as raised beaches along Hudson Bay and island coasts (see header image to this page). The highest beach ridges are about 130 m above present sea level, which means that the region has recovered only about half its subsidence. Initial rebound (uplift) rates were as high as 8-9 m/100 years; present rates average 1-1.2 m/100 years – rates that even today are witnessed as changing shorelines. The map below shows present uplift rates generally decreasing with distance from the ice sheet centre.
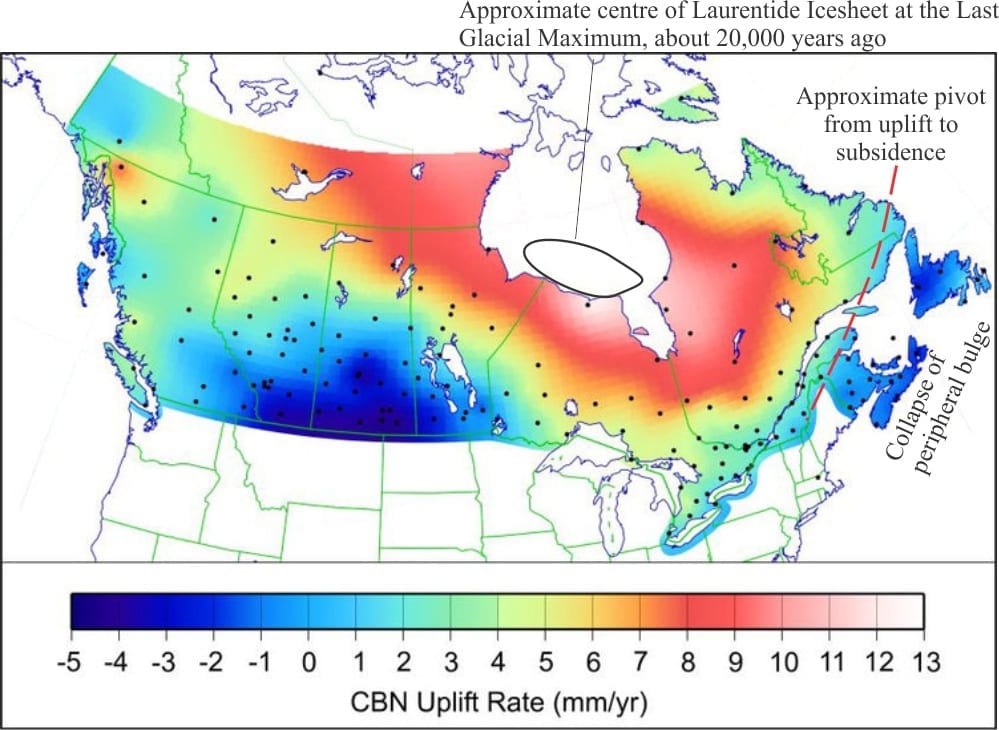

Map of vertical uplift (reds) and subsidence rates (blues) based on distributed GPS measurements. The approximate Laurentide Ice sheet centre is indicated. The distribution of land movement is consistent with a model of glacio-isostatic rebound. From J.A. Henton et al, 2006. Crustal motion and deformation monitoring of the Canadian landmass, Geomatica v. 60, p. 173-191.
Ice sheet loading also created a peripheral bulge that migrated at least as far as the maritime coast of eastern Canada and northeast USA; the distance from the ice sheet centre to the bulge exceeding 1500 km. At present the bulge is subsiding because the ice load that produced it is no longer there. Decay of the bulge is manifested as subsidence of 1-2 mm/year along the Maritime coasts (notably, this subsidence increases the present rate of relative sea level rise). Both regional uplift and peripheral bulge decay indicate that the lithosphere has still to reach isostatic equilibrium.
Topics in this series
Sedimentary basins: Regions of prolonged subsidence
The rheology of the lithosphere
The thermal structure of the lithosphere
Classification of sedimentary basins
Stretching the lithosphere: Rift basins
Nascent conjugate, passive margins
Basins formed by lithospheric flexure
Accretionary prisms and forearc basins
Basins formed by strike-slip tectonics
Allochthonous terranes – suspect and exotic
Source to sink: Sediment routing systems
Geohistory 1: Accounting for basin subsidence
Geohistory 2: Backstripping tectonic subsidence

