The mechanical behaviour, or rheology of the lithosphere.
Sedimentary basins are regions of long-term subsidence of, in most cases, the entire lithosphere (the crust and mantle lithosphere). This truism rolls easily off the tongue, but its implications are important – subsidence involves deformation that effects the whole lithosphere; the mechanics of that deformation determine the kind of basin that will form.
We can think of rheology in terms of the relationship between stress (force) and strain (deformation). Deformation occurs if the stress applied is greater than the strength of the rock body. The most familiar expressions of rock and sediment deformation are those we visualize in outcrop, mountain sides, and satellite images of entire mountain belts: Faults and fractures, tectonic and soft-sediment folds, translation of rock bodies from one place to another, cleavage, even compaction. The conditions for these deformations are reasonably well known; some can even be reproduced in the laboratory. Several factors influence this stress-strain relationship:
- The magnitude of the stress.
- The strength of the rock body, influenced by its composition and the presence of internal inhomogeneities or discontinuities (also called anisotropy), such as pre-existing fractures or fabrics like mineral alignment.
- Temperature; as a general rule, ductility, or the ability to flow increases with temperature in concert with a decrease in yield strength (i.e. the point at which it deforms). Temperature is an important determinant of the transition from brittle to ductile behaviour.
- Confining pressure; the yield strength of rock tends to increase with confining pressure.
- Strain rate; Most rocks will fracture at very high rates of deformation (e.g. during earthquakes), but the same rocks may deform by ductile flow at geologically extended strain rates.
We can describe the behaviour of rock and sediment using three basic mechanical, or rheological models: elastic, plastic, and viscous behaviour. These rheological models can be applied to the lithosphere and asthenosphere in much the same way that we apply them to the deformation we see in outcrop and mountain belts.
Elasticity of the lithosphere
Flying through turbulence can be disconcerting, particularly if you have a window seat where you can see the aircraft wings moving up and down. This is not a flaw in wing design; it is quite deliberate. The wings are responding to stresses developed during the violent changes in aircraft trajectory and air pressure. If the wings were more rigid, they would be at greater risk of breaking off. Happily, there is no permanent deformation in the wing framework; they have responded elastically to the applied stress.
Most Earth materials respond to stress elastically where deformation up to some yield strength (the elastic limit) is non-permanent; the rock or sediment recovers its original shape. Deformation is permanent beyond this limit in rock strength. How this deformation occurs depends on the conditions noted above (e.g. confining pressure, temperature etc.). Deformation (extension or compression) at relatively shallow crustal levels tends to be brittle; at greater depths there is a transition from elastic to plastic behaviour (ductile flow).
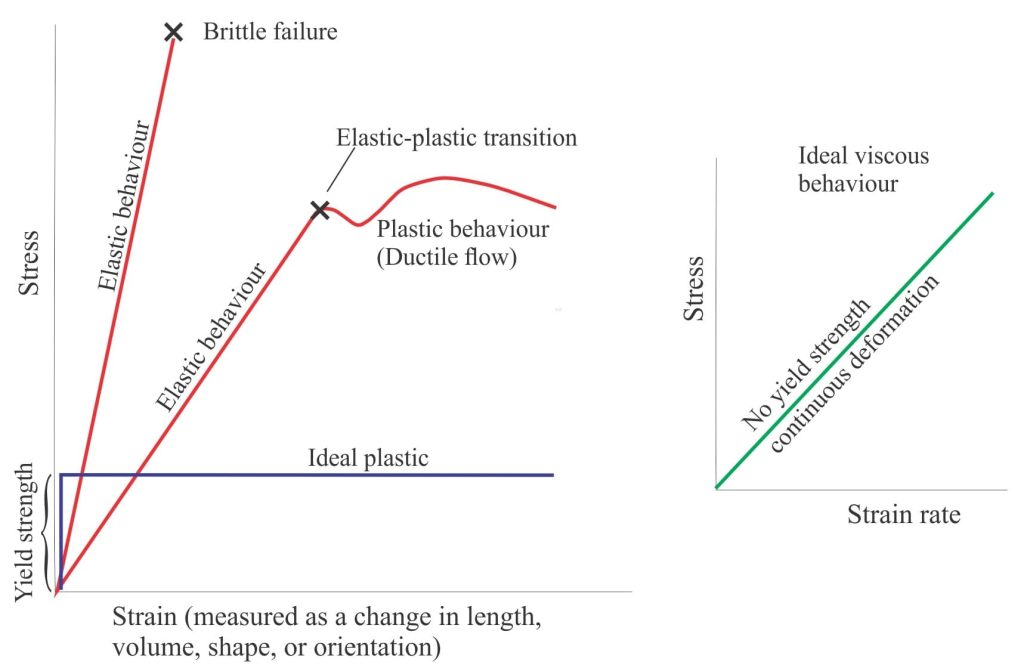
The stress-strain relationships representing the three rheological models is shown in the diagram. For elastic strain (deformation), stress is proportional to strain until the point of failure. Elastic deformation begins immediately a stress is applied; there is no yield stress (unlike plastic behaviour). In elastic bodies, this means that stress is stored until either it is released during recovery, or at the point of failure.


Basic stress-strain relationships for elastic and plastic behaviour (left), and viscous behaviour (right). Note that strength in viscous materials is represented as a strain rate. From multiple sources.
Lithospheric elasticity is one of the more important determinants of sedimentary basin formation; it allows the lithosphere to flex in response to loads. The term “load” applies to stresses that act:
- Vertically; this includes physically emplaced sediment, volcanic or tectonic loads, plus the loading caused by temperature changes (such as cooling and density increase of oceanic crust), and
- Horizontally, for example far-field horizontally-oriented stresses adjacent to convergent margins.
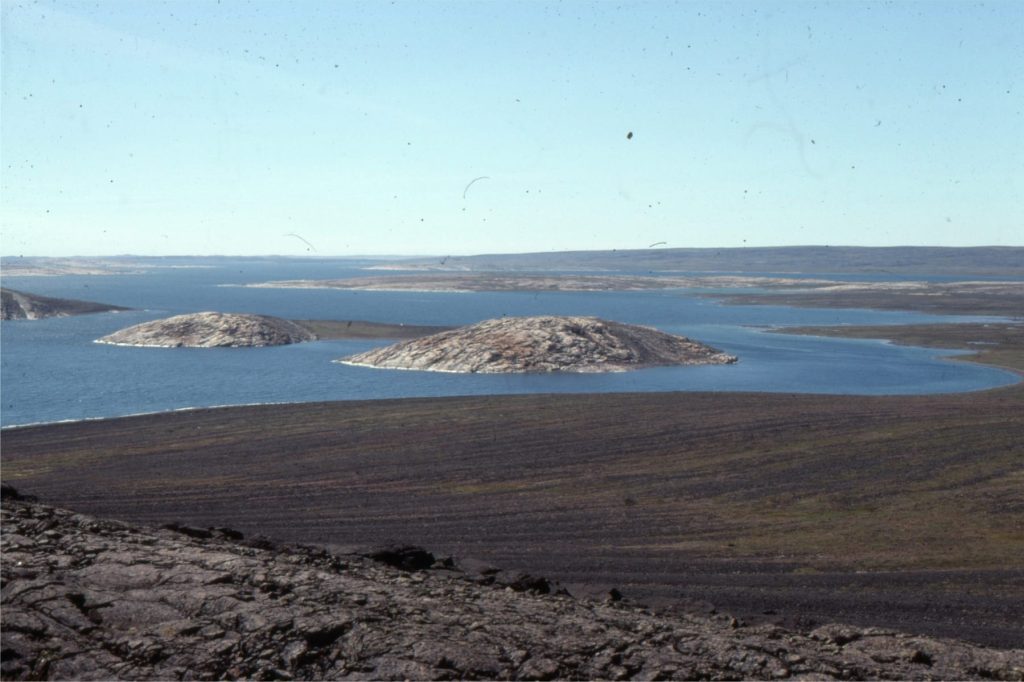
One of the more obvious manifestations of lithospheric flexure is the rebound of landmasses following retreat of large ice sheets. Post-glacial rebound of Belcher Islands in Hudson Bay, close to the centre of the former Laurentide Ice sheet, was a whopping 9-10 m/100 years about 8000 years ago, decreasing to its present rate of about 1 m/100 years. In this case rebound is recorded by spectacular flights of raised beaches, each one abandoned as the landmass rose above sea level.


The staircase of raised beach ridges, over an altitude gain of about 100 m from present sea level, has formed in response to lithospheric rebound following melting of the Laurentide Ice sheet. The present rate of uplift is about 1 m/100 years. Tukarak Island, Hudson Bay.
Lithospheric flexure is also the dominant mode of subsidence in foreland and forearc basins where the crust is tectonically loaded by thrust sheets. The amount of flexure, and therefore subsidence is controlled to a large degree by the elastic thickness of the lithosphere – thinner lithosphere will tend to bend more than thicker.


Flexure of an elastic beam resulting from progressive tectonic emplacement of loads (from the right). Deformation can be reversed by removal of the load.
Plastic behaviour
Materials that resist deformation up to a certain yield stress, or yield strength, exhibit plastic behaviour (this is the mechanical context of the term plastic, rather than the more parochial term for things like plastic bags). Deformation beyond the yield strength is permanent. As is shown on the stress-strain diagram, for an ideal plastic there is no deformation until the critical stress is reached.
In this model, deformation can occur in two ways (Ershov and Stephenson, 2006):
- Instantaneously and discontinuously as brittle failure, or
- Continuously as in ductile flow.
Viscous behaviour
Viscosity measures resistance to deformation, specifically that caused by flow. Thus, the dimensional units of measure are Force (in this case shear stress) multiplied by Time, all divided by Area. The standard unit is the poise, or in SI notation, Pascal-seconds (Pa.s).
In common language we usually apply the term viscosity to fluids or liquids, like paint or syrup. We can also apply the term to rocks, but we need to think of rock viscosity in a geological time frame, rather than the time it takes to apply shear stress (i.e. pouring) maple syrup on your pancakes. Some commonly used values of viscosity are listed below: the differences are measured in orders of magnitude (units of Pascal-seconds):
- Water at 20oC 10-3
- Maple syrup 10-1
- Basalt lava 102
- Granite 1020
- Mantle 1023
- Average crust 1025
Viscous deformation is also known as creep. During viscous behaviour, creep begins at the point stress is applied such that strain rate (rate of deformation, or in this case the rate of shear) is a function of stress; i.e. there is no yield strength. Viscous deformation is permanent.
Strength envelopes
The strength of the lithosphere, and therefore its rheological behaviour in response to stress (brittle, ductile, or viscous) is determined primarily by its composition and temperature, both of which change with depth. These variables distinguish crust from upper mantle; for temperature, this is a function of geothermal gradient. This means that, with depth (and location) there will be transitions from one kind of behaviour to another – from brittle to plastic (e.g. ductile), and from ductile to viscous.
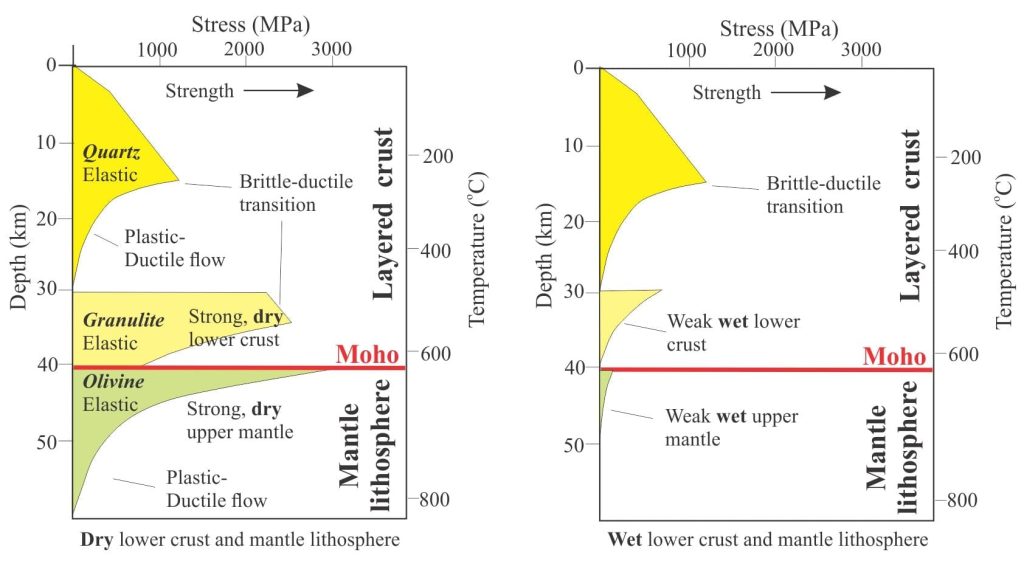
Lithosphere strength is commonly represented diagrammatically as a yield strength envelope (YSE). YSEs can be constructed for oceanic and continental lithosphere, to show how strength varies according to temperature and composition of the crust and mantle lithosphere. The boundaries of each domain represent the point of failure; the rheology within each domain is elastic (Ershov and Stephenson, 2006). These diagrams are an excellent way to portray the rheological changes across the MOHO. They also demonstrate the changes in relative strength when comparing the degree of hydration of crust and uppermost mantle; wet conditions tend to weaken crust and uppermost mantle layers.
The diagram shows the strength envelopes for the upper part of continental lithosphere with a layered crust (modified from Allen and Allen, 2013, Fig. 2.38). The panels show two extremes – one with ‘dry’ lower crust and uppermost lithosphere mantle, the other with both layers hydrated. As noted by Allen x 2 in their commentary, under ‘wet’ conditions both the lower crust and upper mantle lithosphere are very weak, such that lithosphere strength is maintained almost entirely by a strong upper crust.


Typical yield strength envelopes for two sets of conditions in the upper 60 km of continental lithosphere: Left – strong, dry lower crust and mantle lithosphere, where strength is distributed with depth; Right – weak and wet lower crust and mantle lithosphere, where most of the strength is in the upper, brittle crust. Conditions within each envelope promote an elastic response. Beyond the envelopes the response to deformation is ductile. Strength increases to the right. Modified from Allen and Allen, 2013, Fig 2.38.
Some generalisations
It is reasonably straight forward to define the three rheological models but applying them to the lithosphere-asthenosphere adds a different level of complexity. As a general rule we can think of the upper crust as responding elastically to the point of brittle failure, the lower crust and upper mantle as a transition from elastic to plastic behaviour (e.g. ductile flow), and the asthenosphere as viscous (which permits convective flow). However, complications with this simple story arise if, for example, the crust is layered, and again if the lower crust is dry (generally stronger) or wet (weaker). Through any section of lithosphere all three processes will operate simultaneously. The depth at which each process acts also varies laterally, depending on factors such as geothermal gradients and changes in composition.
Topics in this series
Sedimentary basins: Regions of prolonged subsidence
Isostasy: A lithospheric balancing act
Classification of sedimentary basins
Stretching the lithosphere: Rift basins
Nascent conjugate, passive margins
Basins formed by lithospheric flexure
Accretionary prisms and forearc basins
Basins formed by strike-slip tectonics
Allochthonous terranes – suspect and exotic
Source to sink: Sediment routing systems
Geohistory 1: Accounting for basin subsidence
Geohistory 2: Backstripping tectonic subsidence
Related topics
Crème brûlée, jelly sandwich, and banana split; the manger a trois of layered earth models
Sea level change: busting a few myths
The thermal structure of the lithosphere
