Teasing the tectonic subsidence from total basin subsidence
Sedimentary basins are defined as regions of long-term subsidence of the crust and mantle lithosphere. We can also express this definition in terms of the long-term creation of sediment accommodation space – this is a useful definition because it acknowledges that several processes operate, frequently in tandem, to create (or remove) accommodation. These processes include:
- Changes in sea level that determine the architecture of the sedimentary fill, usually measured in metres to 10s of metres,.
- Sediment compaction; this process begins soon after deposition and continues for the life of a basin.
- The isostatic effects of sediment and water loads. Water loads will fluctuate with changes in relative sea level and the replacement of water by sediment. The isostatic response to loading and unloading is an elastic response that involves the lithosphere and upper asthenosphere.
- Tectonism drives subsidence and uplift, and the development of topography that, in turn, is a strong determinant of sediment supply and sediment routing.
The last of these, tectonics, is by far the dominant influence; all the other generators of accommodation are superimposed on tectonic driving forces. The term ‘tectonic’ here is pretty broad-brush; it incorporates processes such as extension and thinning of the crust (rift basins), lithosphere bending in response to structurally emplaced loads (e.g., foreland basins) or horizontal stresses that result in crustal-scale buckling, cooling and densification of the lithosphere (the prime example here is oceanic lithosphere), and dynamic loading resulting from convection in the asthenosphere at subduction zones.
Depocenters such as passive margins and foreland basins, have many thousands of metres of sedimentary fill. Tectonic-driven subsidence is the only way such stratigraphic thicknesses can accumulate.
Backstripping – Determining the tectonic contribution to subsidence
In a previous article, our geohistory analysis isolated the effects of sediment compaction, paleobathymetry and sea level to give us a corrected subsidence profile. However, to establish the tectonic contribution to the overall subsidence trajectory of a basin, we need to remove the isostatic effects of sediment and water loads.
Backstripping is an exercise analogous to the sediment decompaction method, where sedimentary units are sequentially removed from a stratigraphic column, and the isostatic response calculated to determine the depth of the underlying units and basement contact. The method was developed by Watts and Ryan, 1976. The starting point for each iteration is the decompacted thickness and density of each unit.
Two models of isostasy are usually considered: a simple one-dimensional Airy model that balances the pressures exerted by water, sediment, crust, and mantle lithosphere in vertical columns, or more accurate (and mathematically more complicated) 2D or 3D models of flexural isostasy. The Airy model suffices to illustrate the basic principles of the method.


One-dimensional Airy models of isostatic compensation used to derive a simple backstripping equation. Each column has unit area so that the calculation of volume simplifies to thickness or depth of units. The sedimentary block (left column) can be subdivided into any number of stratigraphic units. The unknown value Z (backstripped water depth) tracks the basin floor and therefore tectonic subsidence. From Angevine et al., 1990, Fig. 3.19.
Derivation of the basic isostasy equation assumes the following conditions:
- The two columns are isostatically compensated and hence the sum of pressures in each must be equal.
- The columns have unit area and hence the volume of each block is numerically equal to its thickness.
- The pressure contributed by each column block (water, sediment, etc.) is written as ρgz (ρ is density, g the gravitational constant, z the depth). Because ‘g’ occurs in all terms on both sides of the equation, we can simplify by dividing through by g.
- The lithosphere thickness and density are the same in both columns.
- In the backstripped column (right), ρAsth can be expressed as the sum of terms in the left column minus those in the right column (because the columns are balanced). This means that the only unknown term is Z – the isostatically adjusted water depth that represents the amount of tectonic subsidence of the sediment-water interface.
Thus, from Steckler and Watts (1978, PDF available), and restated by Angevine et al.,(1990, PDF available), and Allen and Allen (2005):
ρwater.Wd + ρsed.S + ρLith.L + ρAsth.X = ρwater.Z + ρLith.L + ρAsth.(Wd + S + L + X – Z – L)
= ρwater.Z + ρAsth.Wd + ρAsth.S + ρAsth.X – ρAsth.Z (the lithosphere terms cancel).
Collect terms Z(ρAsth – ρwater) = Wd (ρAsth – ρwater) + S(ρAsth – ρsed)
Z = [Wd (ρAsth – ρwater) + S(ρAsth – ρsed)]/ (ρAsth – ρwater)
Z = S(ρAsth – ρsed)]/ (ρAsth – ρwater) + Wd
If sea level change Δsl is known,
Z = S(ρAsth – ρsed)]/ (ρAsth – ρwater) + Wd – Δsl (ρAsth / ρAsth– ρwater) where Z is the amount of tectonic subsidence, and Δsl is positive for a sea level rise and negative for a sea level fall.
To solve the equation we also need to know the average sediment density of the stratigraphic column which will change as each new unit is deposited. We can calculate this from the decompacted column data using unit thickness (i.e., volume) and porosity (from Steckler and Watts, 1978). For any point in time, we sum the densities accounting for porosity (i.e., water) and the solid grain framework for each unit and divide by the sum of unit thicknesses. Thus, the average density of the sediment column for any time interval is:
ρSed = [Φ.ρwater) + (1 – Φ)ρsolid grains]. Thickness / ∑ T


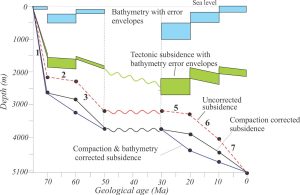
The calculated tectonic subsidence is compared with the total subsidence determined from decompaction and correcting for bathymetry. The stratigraphic units correspond to those used in the decompaction correction. From Angevine et al., 1990 combined figures 3.16, 3.17, 3.21.
The example above continues with the decompaction analysis from Angevine et al. (1990). Total subsidence is presented in the compaction and bathymetry corrected curve. The shape of the tectonic curve (green curve) shows rapid initial subsidence followed by a gradual decrease in subsidence rate. The error envelopes are from the bathymetric component of the analysis (they can also be applied to the total subsidence curve).
Tectonic subsidence motifs
Total subsidence and tectonic subsidence analyses provide basic information on variables such as changes in sedimentation rates and subsidence rates over time. Subsidence profiles constructed for different parts of a basin will allow us to probe deeper into the changing dynamics of sedimentation and stratigraphic architecture resulting from tectonism.
One of the important outcomes of the Watts and Ryan (1976) and Steckler and Watts (1978) backstripping exercise of wells on the US Atlantic seaboard, was the recognition of a tectonic subsidence profile that is consistent with plate tectonic and thermal models of passive margin formation. They noted two distinct stages of subsidence:
- A synrift stage, characterized by initial rapid subsidence and development of accommodation space, that corresponds with lithosphere stretching and brittle failure. High heat flow (the asthenosphere rises to maintain isostatic balance) and shallow geotherms are common outcomes of rifting. This stage is dominated by mechanical processes; it is relatively short-lived.
- A long-lived postrift stage where subsidence rate decreases approximately exponentially. This motif reflects the thermo-isostatic adjustment required to accommodate cooling and densification of the mantle lithosphere.
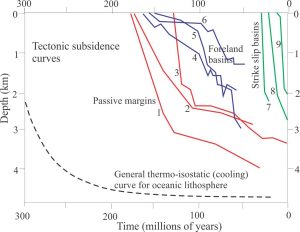
The synrift-postrift tectonic subsidence motif is reasonably consistent across many rift – passive margin successions. Tectonic subsidence motifs, or signatures have also been calculated for several other basin types and, at a first approximation, these motifs can be used to help characterise a sedimentary basin (Xie and Heller, 2006, PDF available; Christie-Blick and Biddle, 1985). Some examples are shown below.


Examples of tectonic subsidence curves for passive margins (red), foreland basins (blue), and strike-slip basins (green). See Xie and Heller (2006), and Christie-Blick and Biddle (1985) for references to each basin. 1&2. US Atlantic margin; 3. Campos Basin; 4. South Alberta Basin; 5. Hogback Basin, Wyoming; 6. San Rafael Swell, Utah; 7. Ridge Basin, California; 8. Death Valley, California; Los Angeles Basin, California. The exponential cooling and deepening of oceanic lithosphere is shown for comparison.
Tectonic subsidence of foreland basins reflects long-term lithospheric flexure punctuated by short-lived uplifts that record the emplacement of incoming thrust panels, and subsequent erosion where uplift is an isostatic response to unloading. Thus, tectonic subsidence is driven largely by mechanical rather than thermal processes. Strike-slip basins generally exhibit short-lived subsidence, the majority of which is rapid and associated with brittle failure of the crust.
Subsidence transitions


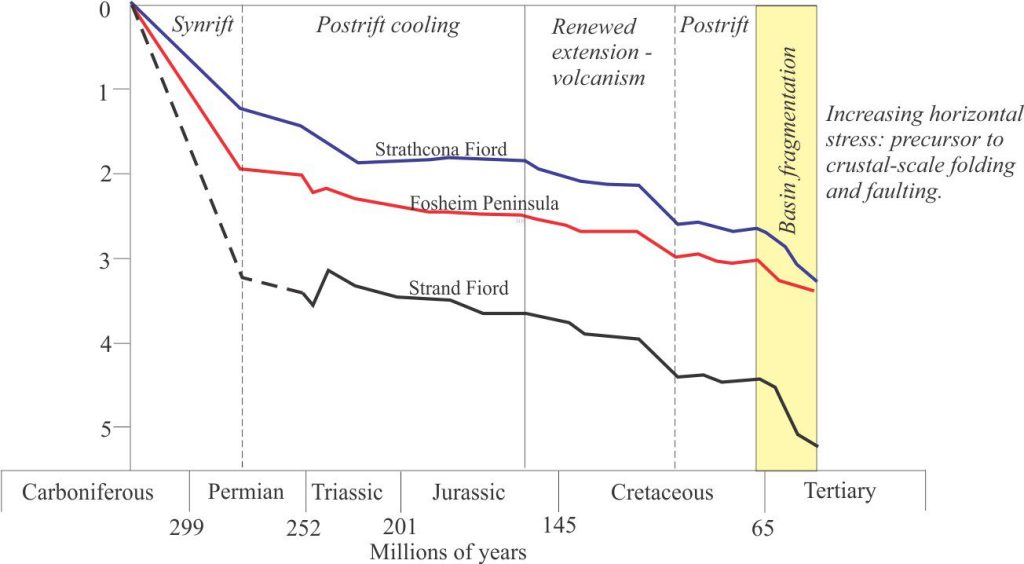
Tectonic subsidence at three locations in the Late Carboniferous – Paleogene Sverdrup Basin, Arctic Canada. The dashed line for Strand Fiord has been modelled. All other points on the three curves have been calculated by backstripping. Accelerated subsidence during the Paleogene culminated in the Eurekan Orogeny. Modified from Ricketts and Stephenson, 1994, Fig. 15.
Sedimentary basins evolve with changing plate dynamics and plate trajectories. This will be reflected in their tectonic subsidence profiles. An example from Sverdrup Basin nicely illustrates such basin transitions. In the three graphs above, the initial synrift and postrift stages generally accord with passive margin style subsidence. Towards the end of the Jurassic there was renewed extension and heating, manifested as volcanism, followed by a second episode of cooling and thermo-isostatic subsidence. Accelerated subsidence during the Paleogene corresponds with the initiation of sea floor spreading in Labrador Sea. Subsidence of Sverdrup Basin ended during the Eocene when crustal-scale folding, uplift and faulting, including thrust faults, fragmented the once contiguous basin (Ricketts and Stephenson, 1994).
Other posts in this series
Sedimentary basins: Regions of prolonged subsidence
The rheology of the lithosphere
Isostasy: A lithospheric balancing act
The thermal structure of the lithosphere
Classification of sedimentary basins
Stretching the lithosphere: Rift basins
Nascent, conjugate passive margins
Thrust faults: Some common terminology
Basins formed by lithospheric flexure
Basins formed by strike-slip tectonics
Allochthonous terranes: suspect and exotic
Source to sink: Sediment routing systems
Geohistory 1: Accounting for basin subsidence

