Sea levels have risen and fallen countless times over geological history. We see this in the way successive strata are arranged and in the kind of ancient environments that each sedimentary layer or group of layers represents. For example, we may observe that layers deposited in relatively deep water are overlain by layers that indicate successively shallower conditions, then inundated once again by deeper seas. Geologists consider cycles of sea level change like this to be the ‘norm’. However, deciphering the causes of sea level change remains problematic; has global sea level risen or fallen (for example because of changing icecap volumes), or has the land surface and sea floor subsided or uplifted? Or have both processes been active? When we attempt to answer these questions, we need to remind ourselves of what processes are actually involved in changing actual and relative sea level. This post summarizes the most common causes. They are relevant not only for geologists trying to solve stratigraphic puzzles, but for anyone considering the effects and potential risks of changing sea levels as they take place today.
Walking along the beach, looking out to sea you’d be forgiven for thinking that measuring sea level would be relatively straight forward. But then again, does one choose a point at low tide, high tide, king tide? Do you take the point of farthest reach of waves rushing up the beach (that continually changes)?
When we measure things it is usually done relative to something else; a standard length such as a metre, or a point in space and time relative to some other point. Sea level is one such standard. All elevations are measured against the sea level datum. But what if that datum moves? We now know that an observed sea level at any place on earth is the sum of several processes, processes that have the potential to change the volume of oceans and the position of the land surface or sea floor. These processes may act in concert or in opposition to each other; they may act together or at different times.
Sea level itself is not the same everywhere; there is over 100m of relief on the Geoid which means the actual sea level surface contains significant bumps and hollows. Global mean sea level rise over the last 100 years has been about 2mm/year; this has increased over the last few decades to about 3mm to 3.2 +/- 0.7 mm/year (as measured by satellite altimetry); this is a global average. Actual sea level rise or fall can vary widely from place to place. Therefore, if we want to predict where sea level might be 50 or 100 years from now, relative to our location, we need to consider all components of the sea level equation. This is particularly important for evaluating the risk from coastal inundation.
While you’re at it, take a look at How to read a sea level curve
Daily, seasonal and decadal changes
Sea level rises and falls with the passage of tides (daily), weather systems (seasonal) and decadal climate events like El Niňo. Measurement of actual sea level at any locality needs to filter these short term effects. Local, short-lived changes in sea level are best demonstrated by the passage of low pressure storm systems; Hurricane Katrina in 2005 produced a devastating surge about 8m above normal sea level. Bangladesh has suffered more than its far share of cyclonic storm surges; one of the worst in 1970 (cyclone Bhola) killed an estimated 500,000 people. Storm surges are exacerbated if they coincide with king tides.
Ocean volume changes
Ocean volume changes are generally attributed to water mass, temperature, salinity and the natural water cycle. The most obvious contribution is from the melting of grounded ice. Various estimates put this contribution at 50% to 75% of the 3 to 3.2mm/yr sea level rise. The contribution from melting ice is expected to increase over the next few decades.
Changes in seawater volume also result from thermal (Thermosteric) and salinity (Halosteric) fluctuations. Water expands with increasing temperature, and fresh water, being less dense than sea water will occupy a greater volume for a given weight. Estimates of the global average for the combined steric contribution range from about 0.7mm/year to 1.4mm/year. However, temperature and salinity are not uniformly distributed geographically, or with depth in ocean water masses. Deeper waters tend to be colder and denser. An increase in ‘saltiness’ also results in an increase in density. Therefore, sea level rises or falls that are attributed to these factors will not be uniformly distributed. Ocean currents will tend to homogenize these differences but mixing can take decades, and even 100s of years for deep ocean waters.
Loading and unloading the crust
Greenland’s ice sheet is in places 3200m thick. The weight of ice has depressed the crust to the extent that parts of the large, buried bedrock valley that extends beneath central Greenland is about 250m below sea level. Here, the crust has responded elastically to the massive load of ice by pushing it down. If the ice were to melt, the land surface would rebound (also elastically); rebound would begin almost immediately. This process is referred to as isostasy, where, in a simple model, we can envisage a solid crust floating on the mantle (a bit like a block of wood floating in a water bath). We can demonstrate elastic properties using an air-filled balloon. Add a weight to the top of the balloon – the top moves downward and to compensate the sides of the balloon extend sideways. Remove the weight and it returns to its original shape; the balloon is not permanently deformed.
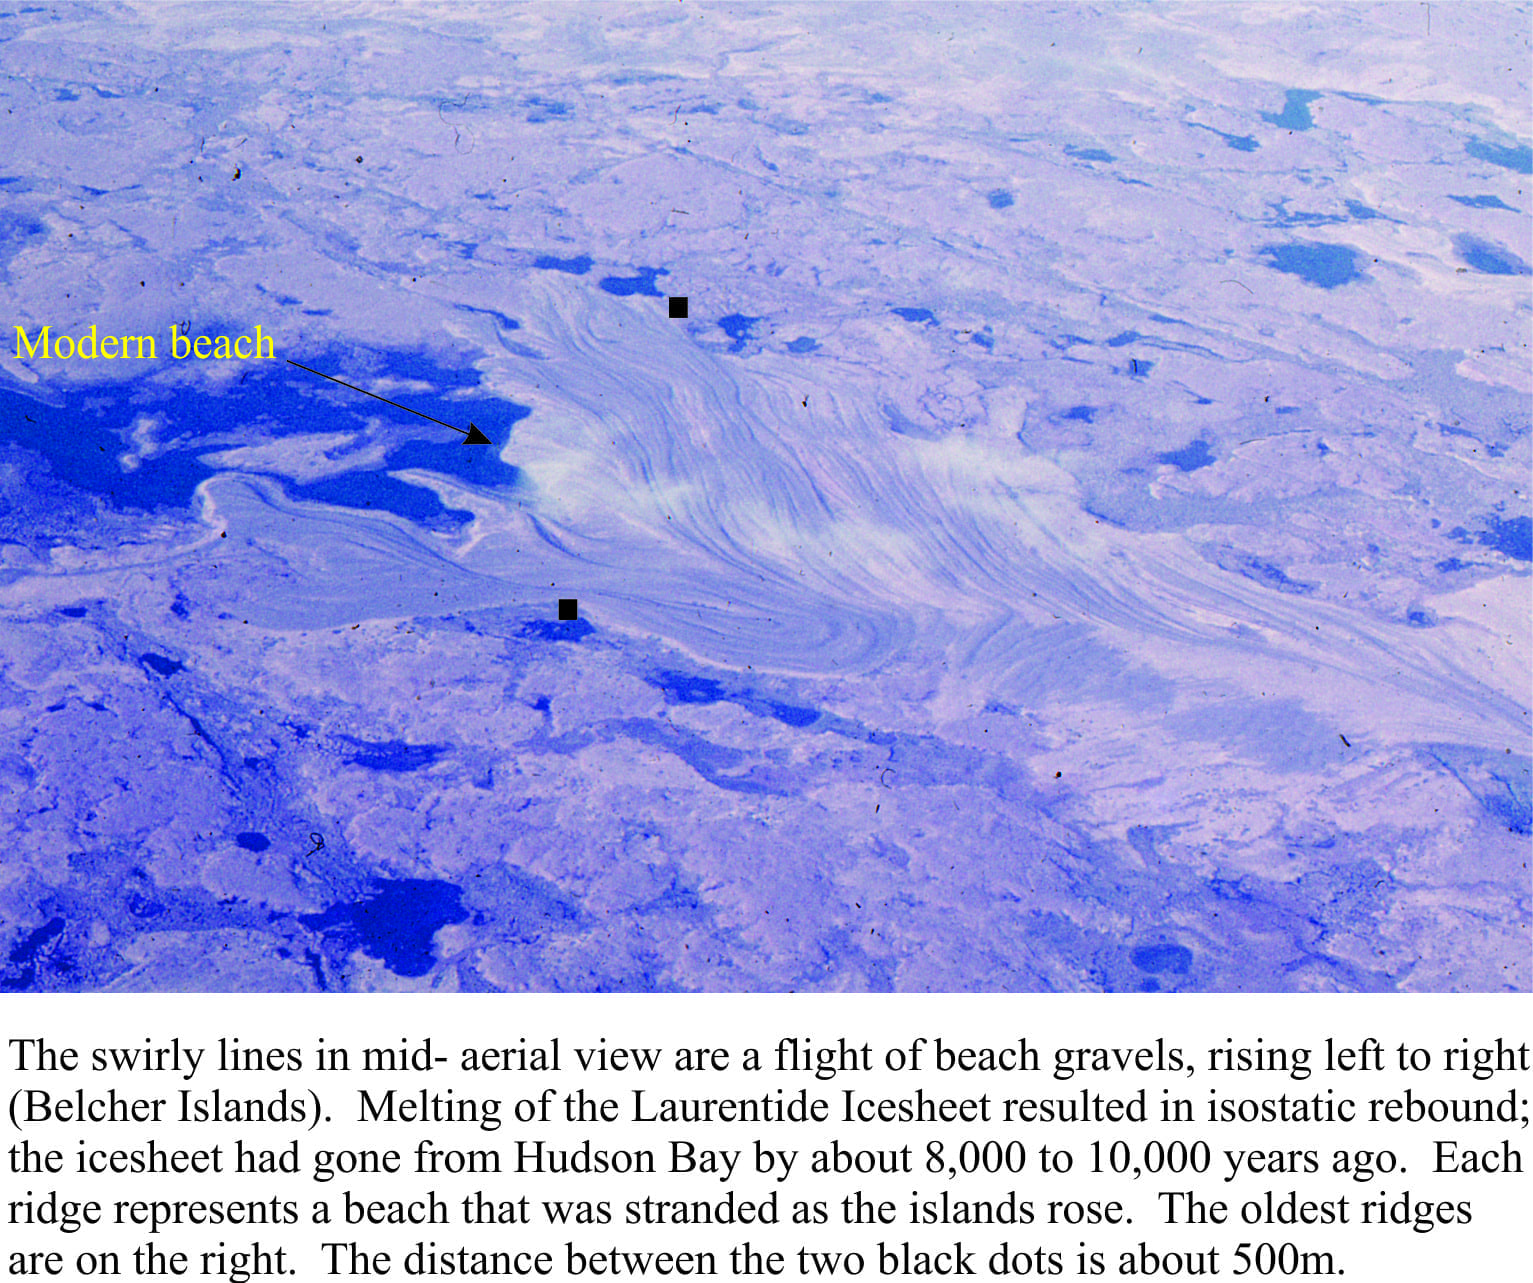
Crustal bending is not confined to the immediate area of ice sheets but extends several hundred kilometres beyond ice sheet limits. We can still see and measure the effects of isostatic rebound that followed the loss of ice at the end of the Last Glaciation in North America, Scandinavia, Scotland, Ireland and Siberia (beginning 17,000 to 19,000 years ago). For example, the present rate of land uplift in Hudson Bay is about 10mm/year; this uplift rate decreases farther south. In parts of Scotland it is 1mm/year (southern England is actually subsiding).
Tectonic forces
Uplift or subsidence of the land surface by tectonic forces are usually equated with plate tectonics wherein the crust (and mantle) can be pulled apart (extension), compressed where tectonic plates move against each other (collision, subduction), or where plates slide past one another (strike-slip). New Zealand has all three: extension (Taupo Volcanic Zone), subduction (Hikurangi Trench) and strike-slip (the Alpine Fault of New Zealand; the San Andreas Fault in California is another good example.
These fundamental earth processes act for many millions of years, but produce events that can happen almost instantaneously (earthquakes) or at a more leisurely pace with uplift and subsidence that can be measured in mm/year (satellite altimetry now plays a very important role in this). Uplift along coastal areas will tend to reduce the effects of sea level rise, whereas subsidence will exacerbate the likelihood of flooding. Earthquakes can produce sudden changes in coastal elevations.
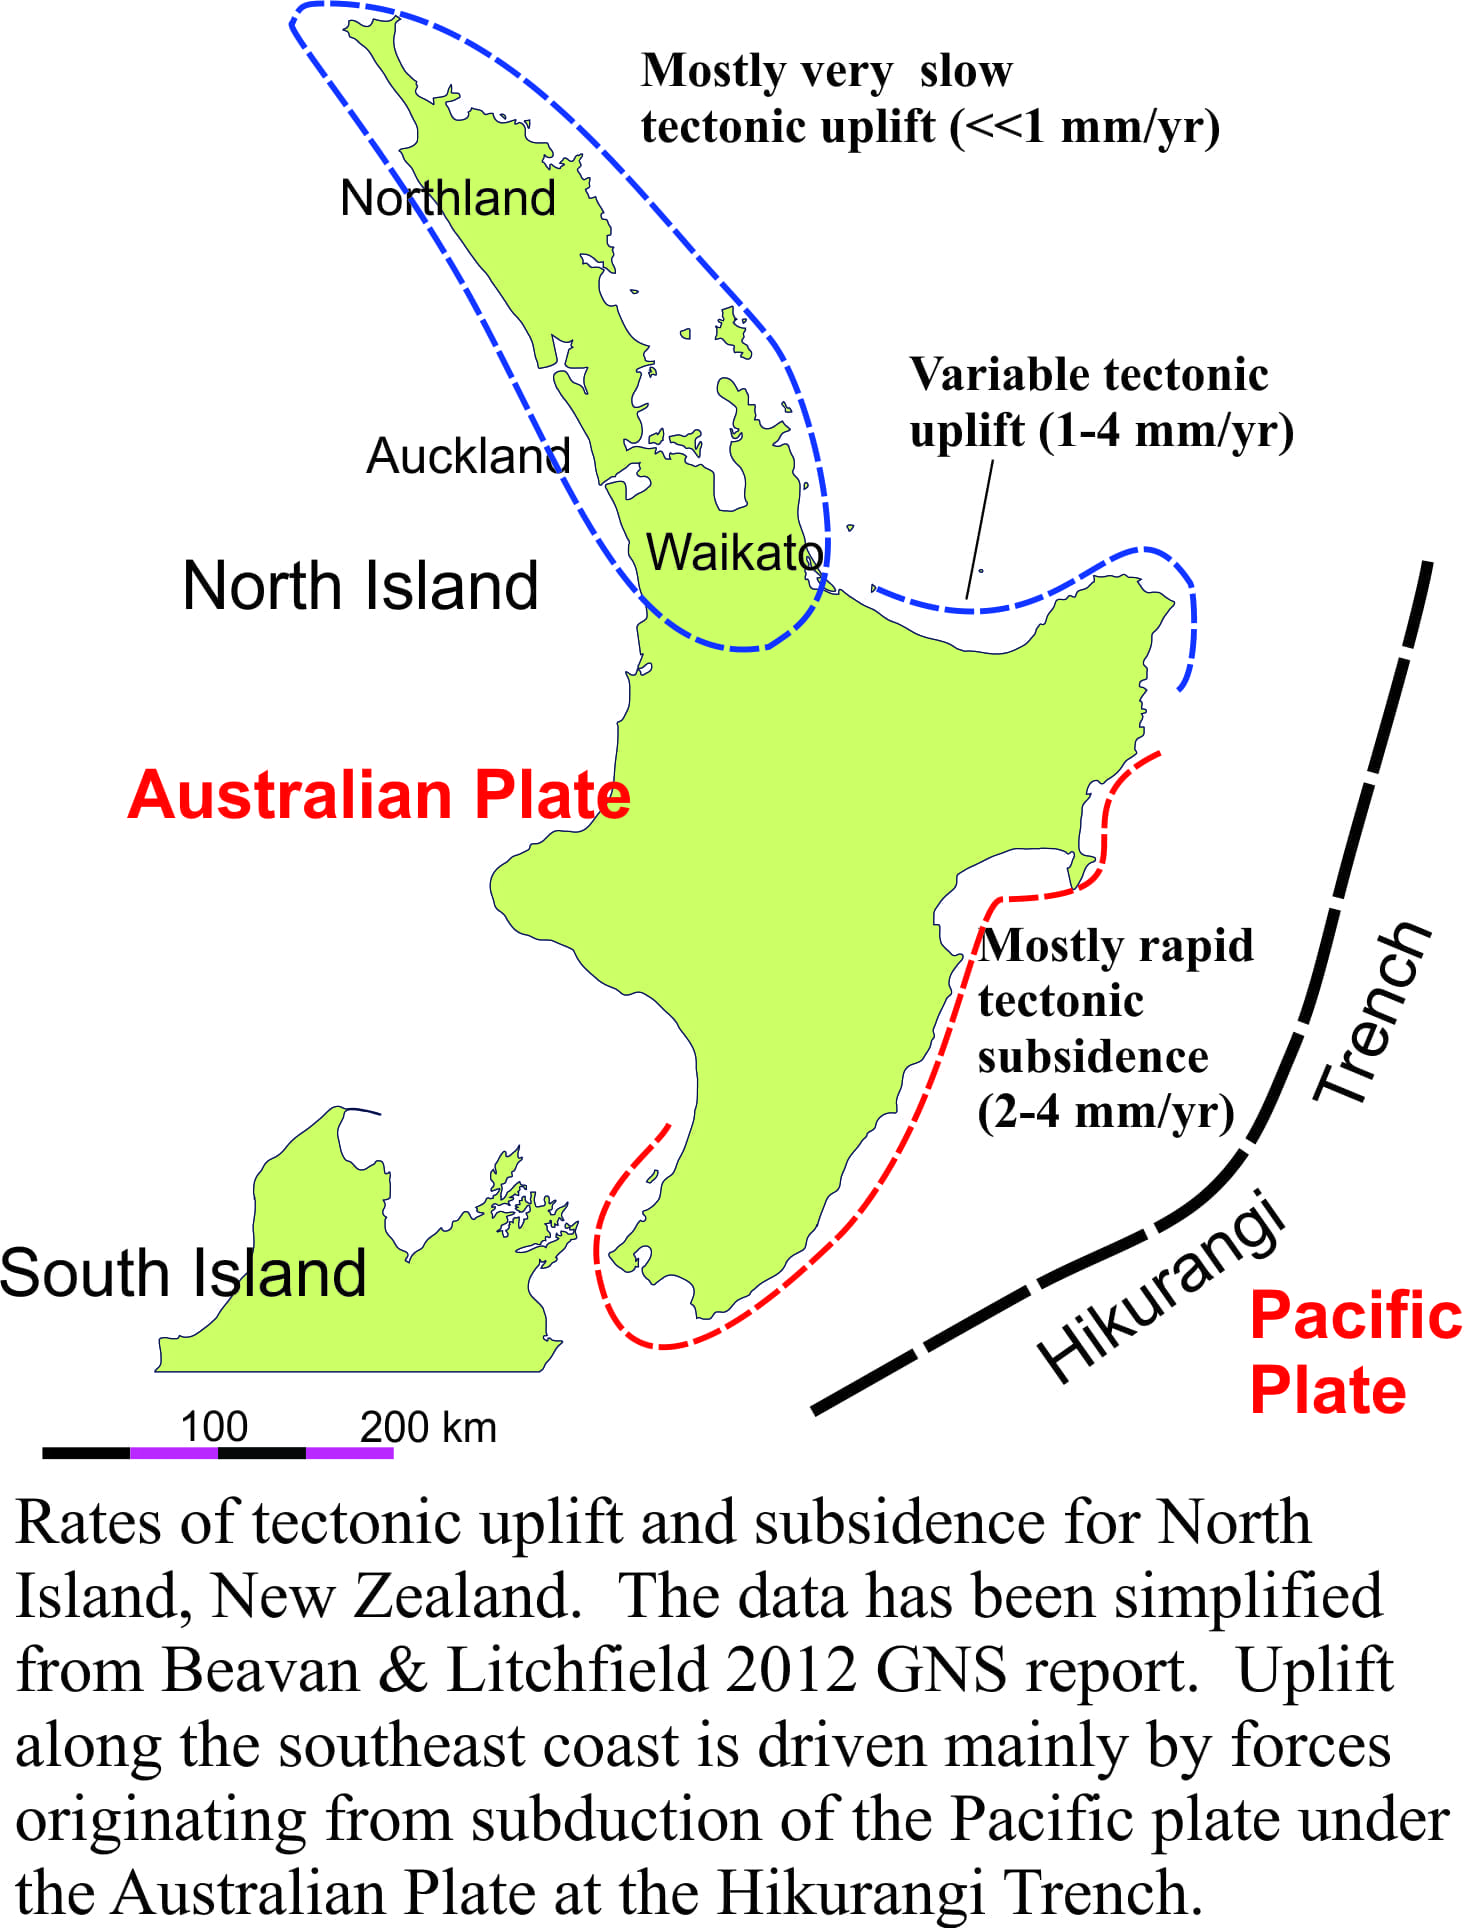
Estimates of uplift and subsidence for North Island New Zealand provide a great example, where short- and long-term tectonic effects have been analysed by Beavan & Litchfield 2012 GNS Report using a number of data sources. The map above shows that some areas experience virtually no change (Northland, Auckland, Waikato) whereas other areas, especially the southeast coast of North Island are subsiding at up to 4mm/year. Thus, northern areas will experience about 3mm/year rise in relative sea level (no correction for uplift or subsidence need be made), but southern coastal segments may have almost double this rate where subsidence exacerbates volumetric sea level rise.
Induced subsidence from groundwater withdrawal
A well known and all-too-common result of excessive groundwater removal (pumping, especially from deeper aquifers) is ground subsidence. San Joaquin Valley in California is a classic example where some areas have subsided more than 8m. This process, if it were to occur in coastal regions could have dire consequences in the event of continued sea level rise. A recent report on New Orleans shows that some areas experience up to 40-50mm of subsidence a year. There are natural geological processes that contribute to these high rates such as the loading effect of hundreds of metres of Mississippi Delta sediment (much like icecap loading), plus sediment compaction where deeper sedimentary layers are compressed. But the principal cause of subsidence was found to be groundwater removal.
The sea level equation
Global averages of sea level rise or fall from water volume changes are predictable. However, it is crucial to remember that the quoted values (e.g. 3.2mm/year) are averages. What happens along any particular stretch of coast will depend on the influence of all the processes noted here. The sea level equation for any location is actually pretty complicated. A simplified example of what such an equation might look like is shown below.
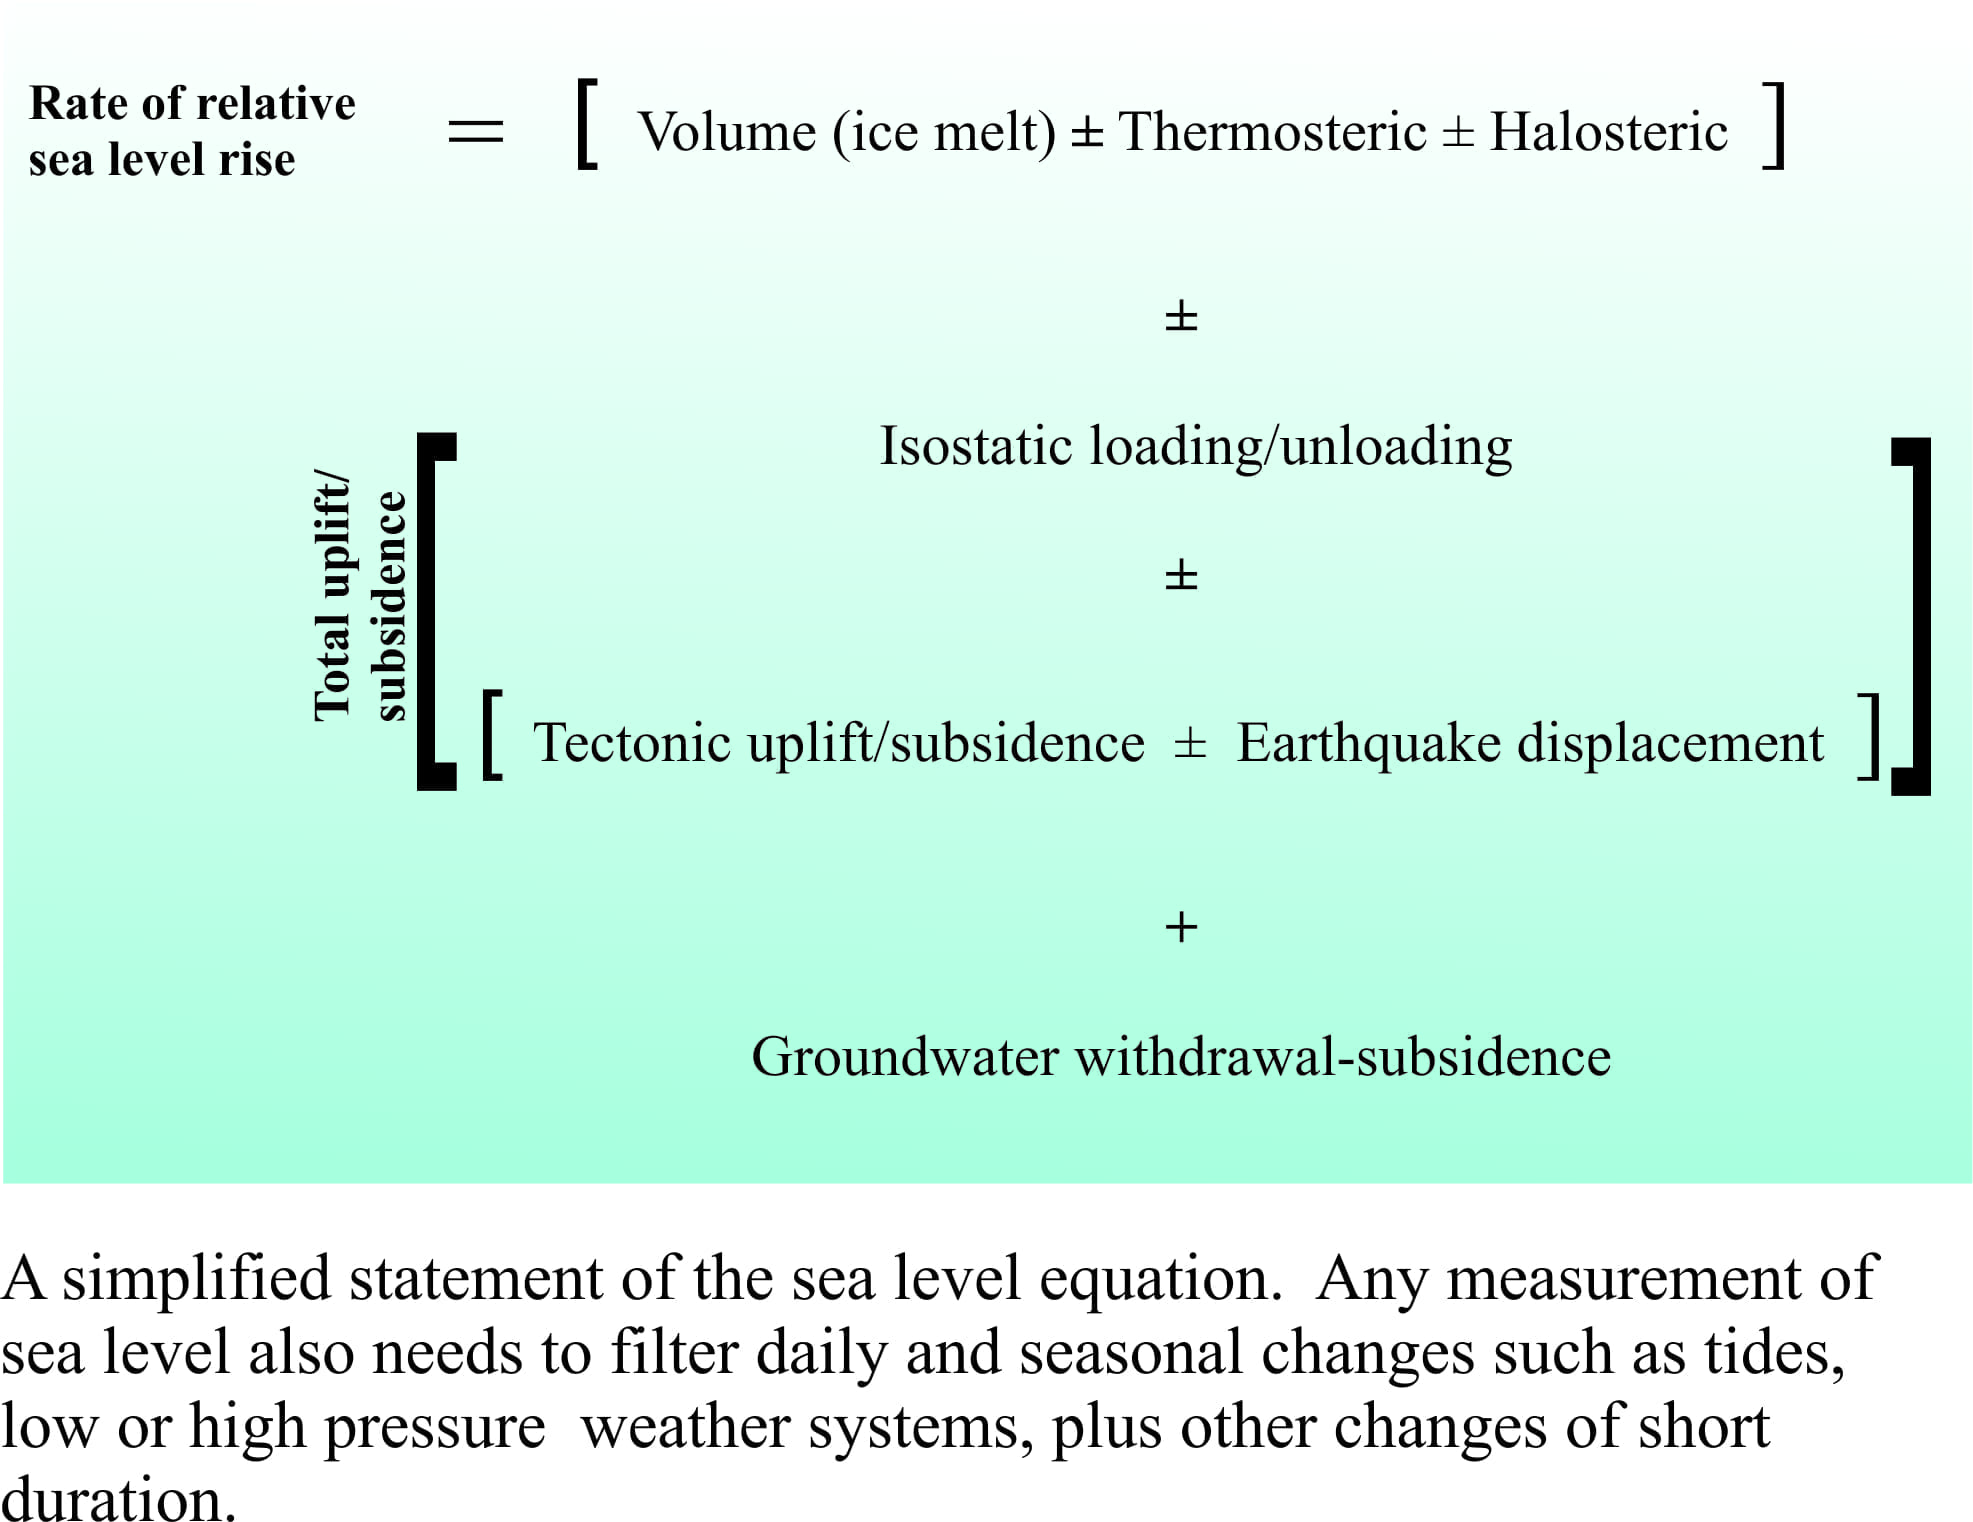
It may not be possible to separate all of these processes at any particular location. For example, we may know that the land surface is rising at a certain rate, based on satellite altimetry, but we may not be able to confidently differentiate between components of isostatic unloading (if present) and tectonic uplift or subsidence. However, the total uplift can still be factored into an assessment of relative sea level change at that location.
The bottom line is that if we only take the global average for sea level rise into account, we run the risk of either over- or underestimating the potential consequences for coastal flooding at any particular locality. Local and national government agencies need to use all the science that is available to assess these risks and not just the bits that are convenient.
Excellent article…
On global basis, all of the annual changes in elevations the land surface, including seabed, net to what?
I grew up on what was once a sea. A couple of hundred miles to the west there is mountain range. The teachers told us that mountain range was once about 5,000 feet taller than it is now. That material eroded away and a lot of it was deposited under our classroom… they claimed around 1,000 feet of material deposited on the old seabed… land now more than 1,000 miles from an ocean in any direction.
Even if all of the ice melted… 230 feet of SLR… the land where I grew up would remain more than 1,000 miles away from an ocean in any direction.
Why isn’t erosion in the equation?
Thank you.
Actually, both erosion and sedimentation are implied in the equation, although I did not tease them out and list them individually. They are part of the Tectonic Uplift/Subsidence part, and the Isostatic part of the equation. Mountain-building is always accompanied by erosion; mountains will continue to rise if the rate of erosion is less than the rate of uplift, and once erosion exceeds uplift then the topography becomes subdued. The sediment produced will end up in rivers and ultimately the sea. Think of these processes as moving loads around on the earth’s crust. There will be an Isostatic response to this; if mountains are eroded then the response is commonly uplift because the land is rebounding as part of the load is removed (same when an icecap melts), but the load of sediment that is now in the sea, causes the sea floor to subside (move downward). So, in the end, all these processes are linked. This is what I find so fascinating about this kind of geology geology – all these processes act together or in tandem – they are not isolated. Hope this answers your question.