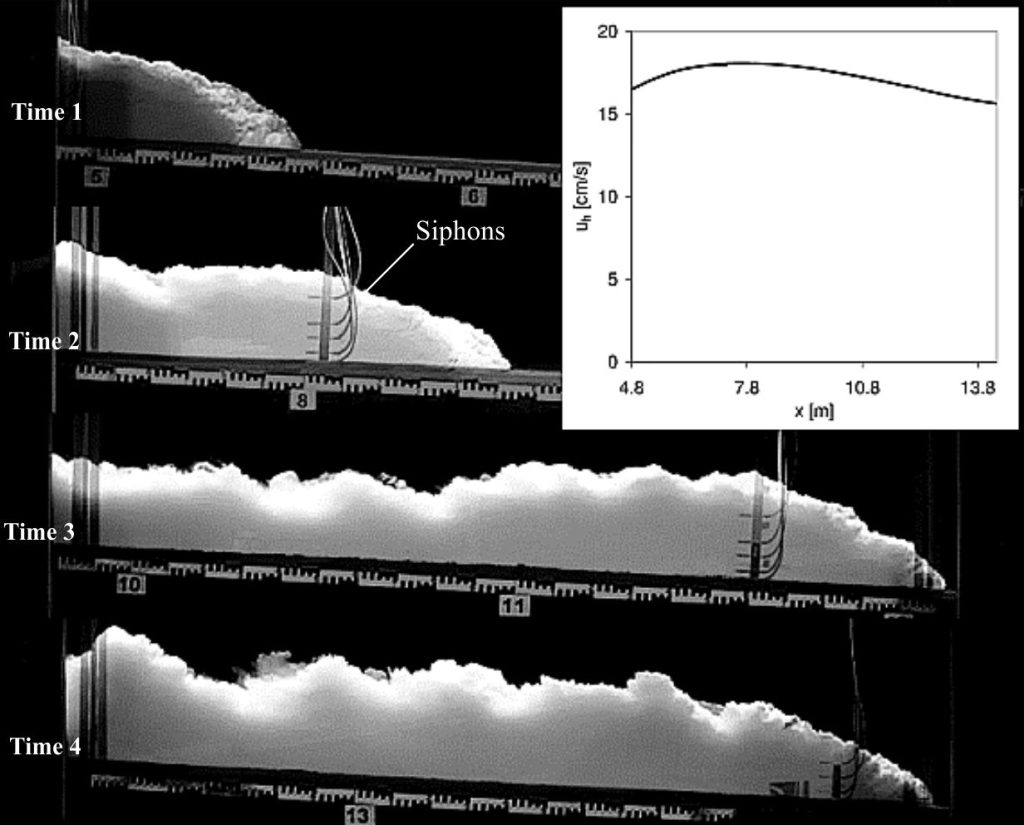

Controlled experiments on turbidity currents allow us to observe the dynamics of flows and the organization of their deposits. Phillip Kuenen and Carlo Migliorini (1950) conducted experiments like the one shown here – they were able to reproduce the kind of graded bedding observed in many outcrops, setting in motion a scientific rethinking of deep-sea sedimentary processes that still resonates today.
The experimental flow shown above was designed to sample the concentration of sediment suspended in the turbulent plume over the duration of the flow (using siphons). Four time-lapse images show different stages of flow development, with two of the siphons at 8 m and 11.6 m from the flume inlet. The inset curve plots flow velocity with distance along the flow path. Image credit: Modified slightly from O.E. Sequeiros et al., 2009. Figure 5, Experimental study on self-accelerating turbidity currents. J Geophysical Research; Oceans
Historical context
The name graded bedding was coined by E. Bailey in 1930 to describe the gradual, vertical change in grain size within a depositional unit (a bed), from coarse-grained at the base, to fine-grained at the top. To comply with his definition, Bailey insisted that the grain size transition should not be interrupted by crossbedding or erosional surfaces. The term could be applied to almost any grain size transition. Bailey surmised that graded bedding formed when sediment was introduced to the water column from volcanic eruptions, dust storms, and river flood plumes, or initiated by earthquakes – the bigger, heavier lumps would fall from suspension fastest, followed by successive deposition of progressively finer material, or from rivers during the waning stages of floods. His interpretations were perfectly reasonable for some examples of graded bedding, like those found in varves, the deposition of air-fall volcaniclastics in water, and from hypopycnal plumes. However, there was one group of rocks for which the explanations offered by Bailey and his contemporaries fell short – the thick, seemingly monotonous successions of flysch.
Flysch, the German word for flow, was applied in the early 19th C as a stratigraphic descriptor for thick successions of interbedded shale and sandstone (plus a few subordinate lithologies). It was primarily a European term used to describe rocks associated with the Tertiary Alpine Orogeny. Multi et al., (2009, PDF available) provide a nice summary of the history of its usage. A characteristic feature of flysch sandstone beds is their graded bedding; associated lithofacies and sedimentary structures include scoured basal contacts, and finer grained lithologies containing ripples, climbing ripples, and convoluted laminae. Flysch sandstones also tend to be muddy, where the coarsest grain size fractions are mixed with some of the finest grain sized materials (clay, silt), although the proportion of clay and silt increases upwards in each bed.
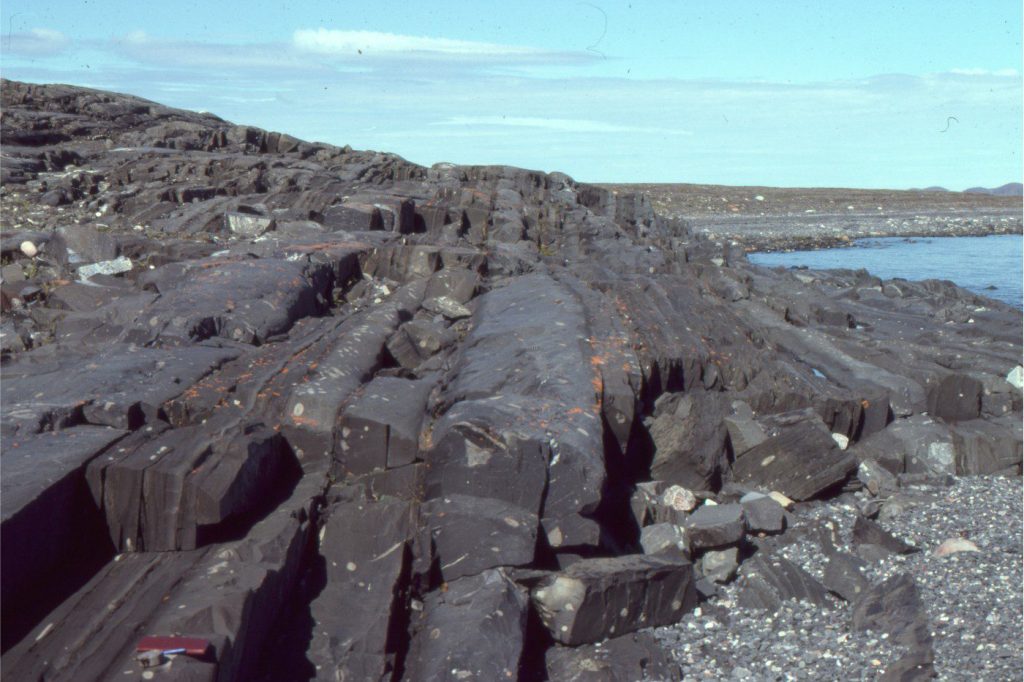

A thick, seemingly monotonous (really, it isn’t) Paleoproterozoic flysch-like turbidite succession (stratigraphic top to the left). Most beds are graded, and in Bouma model notation contain varying combinations of A, B, C, D, and E depositional units. In this view, the thicker beds also have graded A, B, or A-B divisions. Variations in bed thickness and the proportions of Bouma divisions probably reflect the changing dynamics of active submarine fan lobes. Belcher Islands, Hudson Bay. Field notebook on lower left.
Graded sandstone beds in flysch are repeated in a seemingly endless progression through stratigraphic successions 100s of metres thick. And this was problematic for pre-1950s geoscientists because it required an explanation that provided a mechanism for events repeated 1000s of times – a mechanism that also explained their textural properties. Invoking flood-generated plumes, storm erosion and suspension of sediment, volcanic eruptions, repeated earthquakes, or rapid tectonic uplift and subsidence of a basin floor (a yo-yo like process), didn’t quite meet the requirements. Any of these mechanisms might explain a few depositional events, but not 1000s of them. Likewise, the bathymetry in which they were deposited was also problematic, particularly with the discovery of sand beds in the deep ocean basins, 100s of kilometres from shore; how on Earth did they get there? Enter Phillip Kuenen and Carlo Migliorini (Kuenen and Migliorini, 1950): This duo combined Kuenen’s expertise in experimental sedimentology and Migliorini’s geological field knowledge (Mutti et al., 2009, op cit).
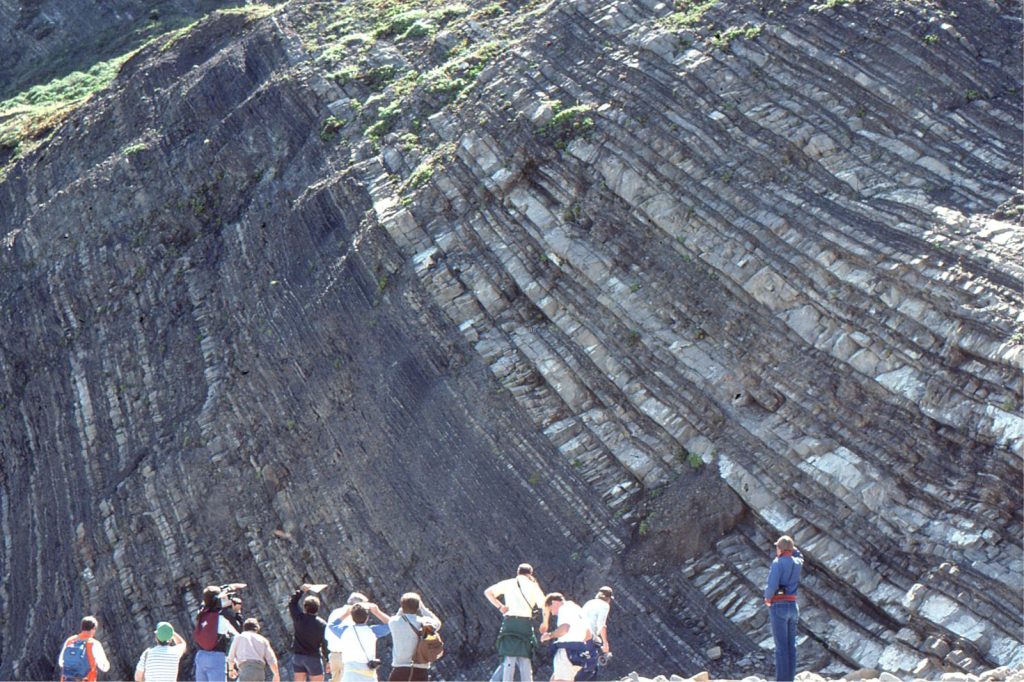

A Paleocene, flysch-like succession of thin-bedded turbidites and mudstones nicely exposed at Point San Pedro, California (top to the right). This exposure is interesting because there are stratigraphic changes in bed thickness: a laminated and rippled mud-dominated package (left) abruptly overlain by three thinning upward sandstone-shale packages (top to the right). The former may represent deposition on the more distal part of a submarine fan lobe (compared with the thick bedded, Paleoproterozoic turbidites shown above); the latter may be the distal fringes of submarine fan lobes, or interchannel overbank deposits.
Although Kuenen and Migliorini are usually credited with introducing the term turbidity current, the existence of density-driven, bottom-hugging sediment-water flows had been known for some time before 1950 and it seems that D.W. Johnson may have pre-empted them in his book The Origin of Submarine Canyons (1939). Density-driven currents had been observed in Lake Mead (reported by Daly, 1936, Gould, 1954 p. 201-207, and others) where they were described as turbid flows, density currents, or gravity-driven flows, mostly generated from plunging sediment plumes (that we would now call hyperpycnal flows). But it was Kuenen and Migliorini’s 1950 paper detailing the proposition that turbidity currents were responsible for the graded beds found in flysch, that set in motion a complete rethinking of deep-sea sedimentation and deep-water depositional processes – so much so that subsequent recording and interpretation of graded bedding has become intertwined with the concept of turbidites and deposition from subaqueous, turbulent density flows.
The Kuenen-Migliorini experiments yielded two notable (and reproducible) results:
- Elucidation of the structure and density of the turbulent flows themselves, particularly the dynamics at the flow head, tail, and overlying plume.
- The reproduction of graded bedding that proved almost identical to outcrop versions in overall appearance and grain size distribution.
The grain-size distributions for one of their experimental flows are shown below (redrawn from their Figure 5). The histograms represent samples taken at successive distances above the base of the turbidite flow unit. Two observations of note are:
- There is a very clear upwards fining trend.
- Each sample contains a range of grain sizes that reflects the grain-size distribution of the original sediment slurry.
Normal (distribution) grain-size grading
The kind of grading identified by Bailey (op cit.) and many others since is generally referred to as normal grading or the less common, but more sensible name distribution grading where ‘distribution’ refers to the entire grain-size range. These descriptors distinguish it from two additional kinds of grading – reverse (or inverse) grading, and coarse-tail grading. Sylvester and Lowe, (2004) along with several earlier studies (e.g., Middleton, 1962; Middleton and Hampton, 1976) have shown that grain-size grading trends can change within a single turbidite flow unit, for example inverse to normal grading, coarse-tail to normal grading, or normal to inverse grading. Measures of sorting within a bed can also change in concert with these grading changes.
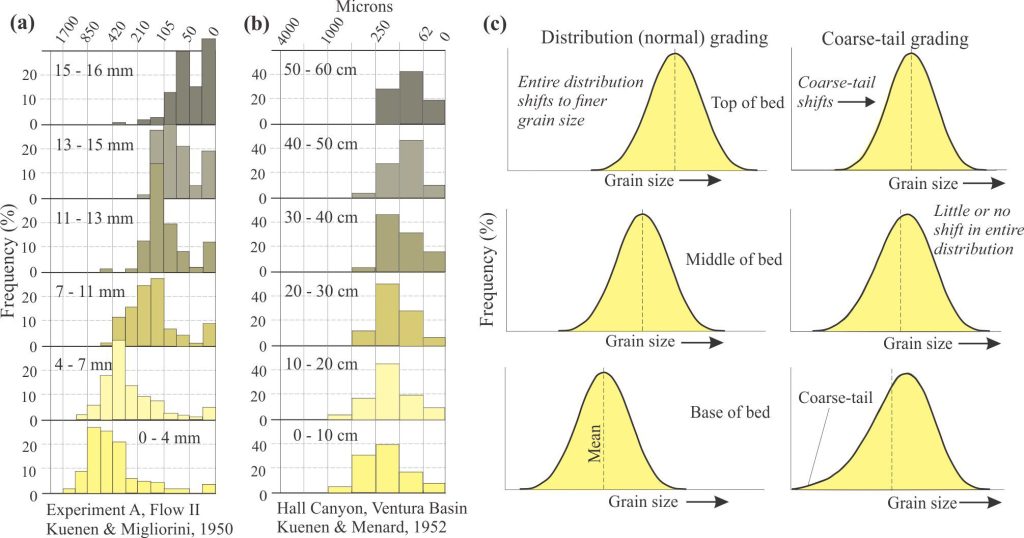

Examples of measured and hypothetical grain-size distributions in graded beds. (a) Grain-size frequency curves for sampled intervals (in millimetres above base of bed) for one of the experimental flows documented by Kuenen and Migliorini, 1950, Fig 5 (op cit.). The upward fining trend of the entire grain-size distribution is clearly demonstrated; (b) Grain-size frequency curves for a 60 cm thick turbidite bed from Ventura Basin, southern California showing the same kind of fining trend as the experimental turbidite. Curves modified from Kuenen and Menard, 1952, Fig. 1 (Note the different grain-size scale). The outcrop turbidite has a greater range of clast sizes. (c) Hypothetical grain-size frequency curves demonstrating the difference between distribution grading and coarse-tail grading. The former accounts for the entire grain-size range of sampled intervals; the latter only the coarse tail of the curve. Modified from Hiscott, 2013.
Deposition of normal graded beds from turbulent density currents
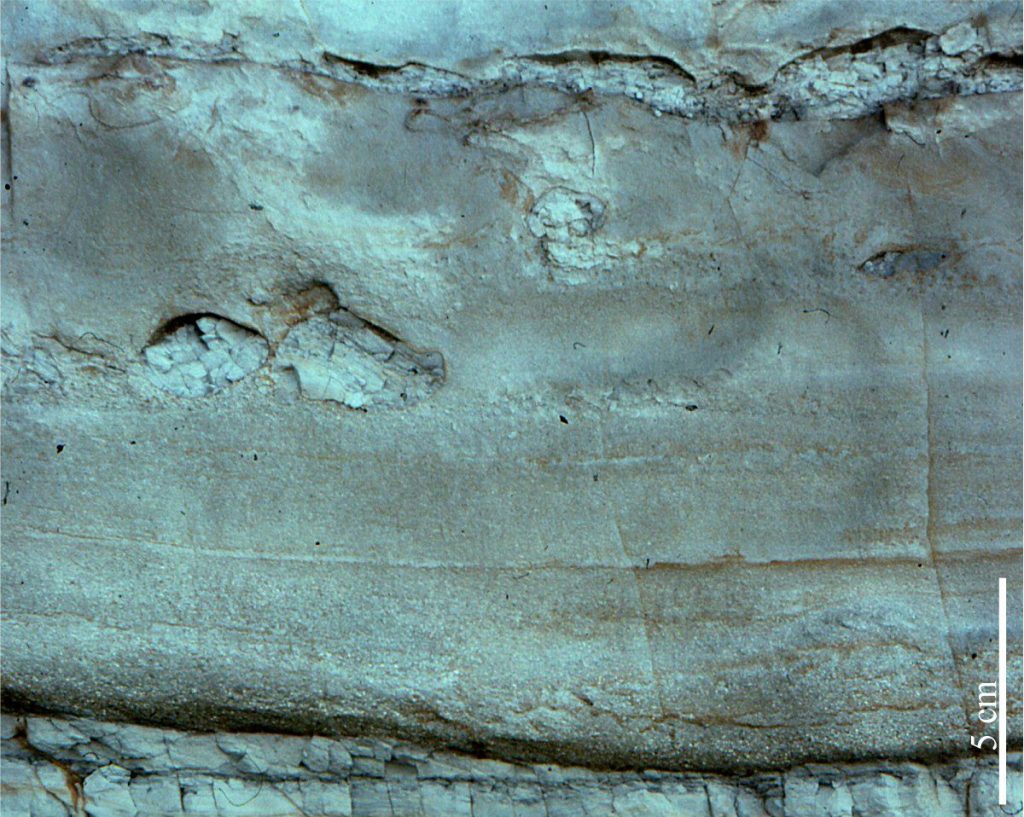

Typical normal (distribution) grading in the plane-bed laminated B interval of a sandy turbidite. Grains immediately above the slightly scoured basal contact are coarse sand to grit size. The overall fining trend leads to very fine-grained sand near the top of the image. Note the mud rip-up clasts in the Upper part of the unit. From the Lower Miocene Waitemata Basin, Auckland, Aotearoa New Zealand.
Deposition of particles from a turbulent suspension is primarily a function of momentum conservation. Momentum is directly proportional to the product of mass and velocity. As velocity wanes (because of frictional and drag losses), larger grains are deposited on an aggrading bed – this in turn reduces the flow mass and therefore further reduces its momentum. Loss of momentum from sediment dilution is also caused by ingestion of new water at the flow head. Although new sediment can be plucked from the substrate by erosion beneath the flow head, the net effect is a reduction in flow velocity and deposition of progressively finer material.
The sedimentary characteristics of normal grading include:
- A gradual, upward change in mean and modal grain-size within a single depositional unit or bed.
- Normal grading usually applies to the B, C, and D divisions of Bouma sequences, but may also be present in A divisions (although A divisions are commonly characterized by normal coarse-tail grading).
- Grain-size sorting is usually poor at all levels within a bed or flow unit.
- Graded beds can be centimetres to metres thick.
- Graded beds deposited from turbulent, density currents will tend to be muddy – there is a range of grain sizes at all levels through the bed, but the mud component increases towards the top. The beds commonly have scoured bases.
- Normal grading formed from highly turbulent pyroclastic density currents (PDCs), particularly pyroclastic surges (that are a dilute kind of PDC) can include lithic clast sizes ranging from ash to block.
- Normal grading can also develop in fluid, gravelly debris flows when there is a component of turbulence in addition to dispersive forces and viscous forces associated with matrix strength.
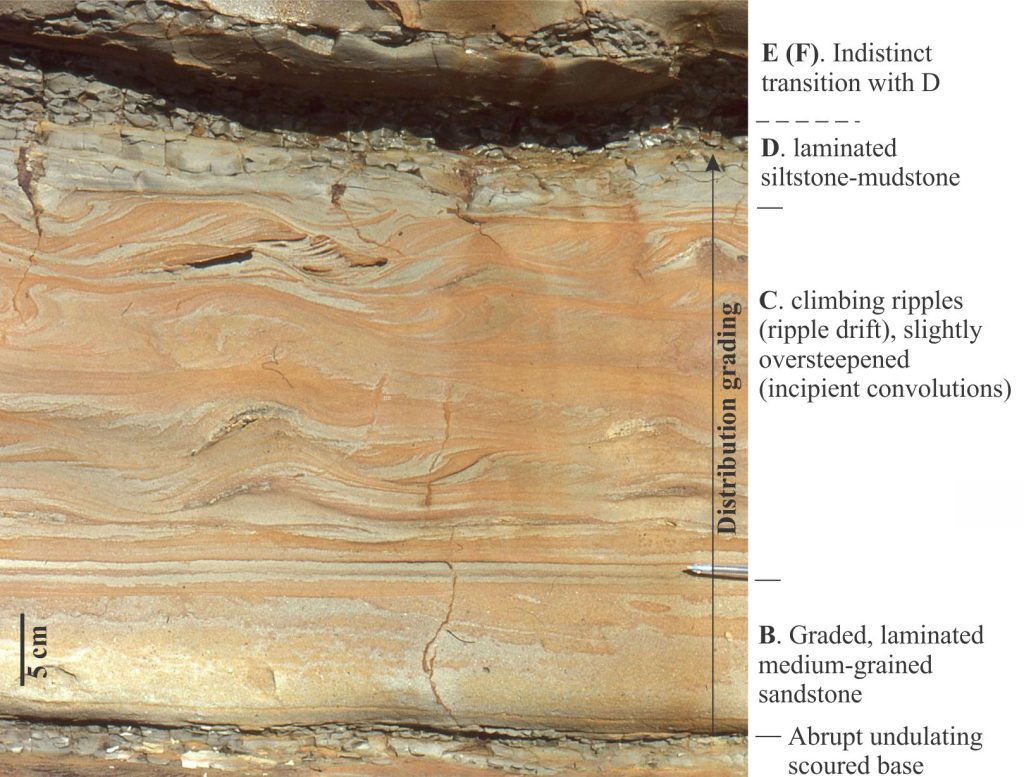

Distribution grain-size grading in this turbidite begins in the lowermost B interval and ends with the gradational transition from the D to E (hemipelagic) intervals. Both basal and top contacts are scoured. From the Lower Miocene Waitemata Basin, Auckland, Aotearoa New Zealand.
Deposition of normal graded beds in still water
Graded beds deposited from settling of sediment suspended in still water (not associated with turbulent flows) tend to be restricted to fine-grained sand, silt, and clay grain sizes. The settling velocities of particles in still water can be estimated using Stokes Law and are a function of grain diameter, particle and fluid density, and viscosity. The general principle here is that larger particles will fall fastest. The finest particles can remain in suspension for days or months. Graded beds formed under these conditions usually lack an eroded base. Examples include varves (seasonal variations in grain-size), deposits from hypopycnal plumes, and hemipelagites on carbonate ramps and continental slopes.
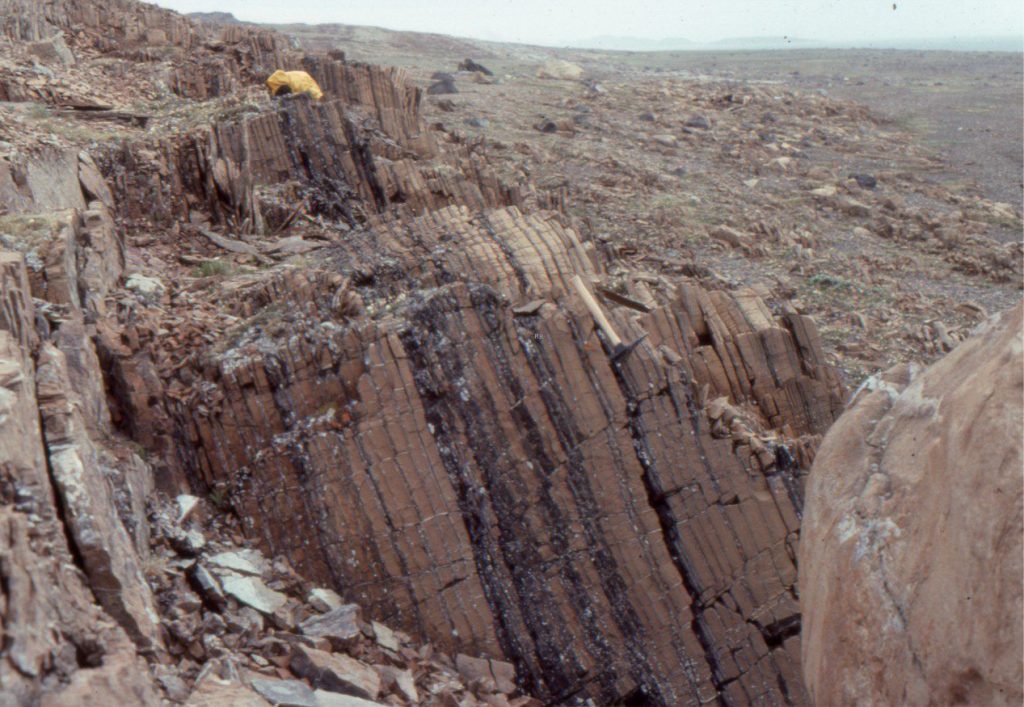

Paleoproterozoic hemipelagites deposited on a carbonate slope. Each bed shows some degree of normal grading of fine-grained sand to thin laminated shale; the sand-sized fraction is a mix of carbonate (dolomite) and siliciclastic grains. Stratigraphic top is to the right. Costello Formation, Belcher Islands, Hudson Bay.
Normal coarse-tail grading
The term coarse-tail refers to the coarsest clast sizes on a grain-size distribution curve. Rather than using the entire grain-size range for a deposit, this measure identifies the vertical trend in maximum clast size at successively higher levels within a bed or flow unit (shown diagrammatically in the graphs above). Identification of coarse-tail grading usually requires detailed examination at both outcrop and thin-section/microscope scales (Sylvester and Lowe, 2004 op cit.). It is most easily identified in the A divisions of Bouma sequences where it probably forms by rapid fallout from the suspended sediment load.
Reverse grading
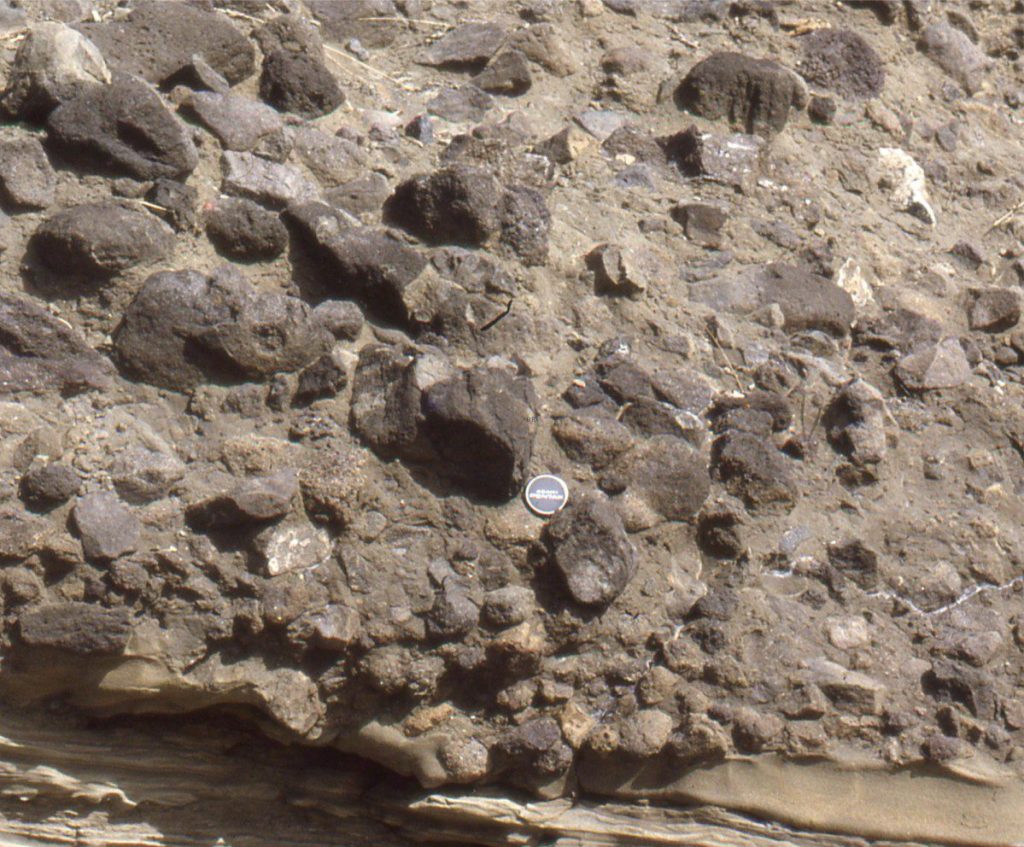

The basal metre of this volcaniclastic, submarine debris flow contains a reverse graded interval above the scoured basal contact – the top of this interval is about the level of the lens cap. From the Lower Miocene Waitemata Basin, Auckland, Aotearoa New Zealand.
Reverse, or inverse grading is usually described as an upward increase in grain-size, and/or the proportion of coarse grains in a flow unit. It is less common than normal grading. It is most easily observed in coarse-grained debris flows where inverse gradation occurs through the entire flow unit (bed), or in the lower part of gravelly or coarse-sand deposits. It has also been observed in turbidites (e.g., Sylvester and Lowe, 2004). Common depositional environments are proximal submarine fans, submarine canyons and slope gullies, alluvial fans, terrestrial landslides and avalanches, and lahars. In pyroclastic density currents there is commonly a combination of reverse grading of pumice fragments and normal grading of denser lithic fragments (Sparks, 1976).

An example of reverse grading of pumice fragments in a thick, non-welded ignimbrite. The curved face of the outcrop is about 2 m high. Clasts near the top of this view are about 8 cm wide; those at the base usually less than 1-2 cm. Late Miocene – Pliocene. Flaxmill Bay, Aotearoa New Zealand.
Reverse grading is far less common in bedload-traction dominated settings (i.e., those not associated with suspended-sediment density flows). Thin reverse graded laminae have been observed in beach deposits where very fine-grained heavy minerals are overlain by coarser, lighter minerals like quartz, feldspar, and bioclastic carbonate fragments – in this case the grading is a function of density segregation during wave swash and backwash.
Two processes are frequently invoked to explain reverse grading:
- Debris flow rheology is dominated by relatively high-viscosity mud matrix in which matrix strength plays a key role in the support of clasts. Dispersive pressures that develop during clast collisions are also important in many flows wherein larger clasts, that experience a higher number of collisions, are pushed upward.
- Kinetic sieving is the process where fine-grained sediment infiltrates the interstices between coarse framework grains, forcing the coarser material upward (e.g., Middleton, 1970). The process is used at industrial scales (e.g., pharmaceuticals) where coarse materials are separated from fine materials. It may be an effective process for clast separation in the highly agitated environment of a moving debris flow; it has also been reported from grain flows. Kinetic sieving has been proposed to explain reverse grading in some terrestrial avalanche deposits, but in this case some of the fine-grained material is derived by grinding and collision among the larger clasts.
[Middleton G.V. 1970. Experimental studies related to problems of flysch sedimentation. In Flysch Sedimentology in North America, Lajoie J. (ed). Geological Association of Canada: St John’s Canada; 253-272.]
Other posts in this series on lithofacies
Sandstone lithofacies
Sedimentary lithofacies – An introduction
Ripple lithofacies: Ubiquitous bedforms
Ripple lithofacies influenced by tides
Tabular and trough crossbed lithofacies
Laminated sandstone lithofacies
Low-angle crossbedded sandstone
Hummocky and swaley cross-stratification
Lithofacies beyond supercritical antidunes
Subaqueous dunes influenced by tides
Storms and storm surges: Forces at play
Evolving tempestite lithofacies models
Gravel lithofacies
Introducing coarse-grained lithofacies
Crossbedded gravel lithofacies
The lithofacies of mountain streams
