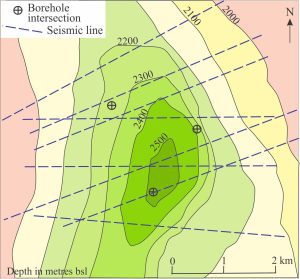

Mapping the structural contours across a stratigraphic unit reveals a three-dimensional picture of its subsurface distribution, deformation, structural relief, and stratigraphic displacement along faults. The structure here is a north-plunging, asymmetric anticline, its eastern limb the steepest. The data needed for this exercise is usually acquired from borehole intersections and velocity-depth conversions from seismic profiles.
Structural contour maps are the subsurface equivalent of surface topography maps. They are widely used in exploration geology (regional mapping, hydrocarbons, minerals, groundwater). Frequently mapped surfaces include stratigraphic units, unconformities, basement contacts to sedimentary basins, and igneous intrusive bodies. A completed structural contour map can reveal stratigraphic distribution, structures such as folds and faults, including fault displacement, and paleotopography.
A structural contour is a line of equal elevation across a geological surface. The fundamental difference between structural and topography maps is that the former map surfaces are unseen – beneath the surface. There is also an important difference in the number of data points available for map plotting – there is an almost endless supply of position points for surface topography, particularly in light of advanced satellite imagery and GPS. Contrast this with the small subsurface database that relies primarily on borehole intersections and seismic reflections that require conversion of seismic velocities to depths. Interpolating contours between such widely spaced elevation points requires a decent amount of ingenuity and common sense.
The general rules governing the construction structure contours parrot those for topography plots:
- A contour line must remain at its designated elevation.
- The elevation interval between contours must be consistent across a map.
- Contour lines must never cross or touch one another although they may be very closely spaced.
- Contours must never end abruptly except at a map boundary.
Structure contour maps are used widely in surface geological mapping because they provide basic information on outcrop patterns, subsurface extent and structure. The three examples worked through here take the simple case of mapping the geological contacts of a flat sandstone unit. Incomplete sections of the sandstone crop out at two locations: the top at one location at 220 m (above sea level – asl), the base at a second location close by at 200 m asl.
A horizontal bed
In this case, the top and base everywhere will be at an elevation of 220 m and 200 m respectively. True thickness is 20 m and we assume this applies across the map area (until we have information that tells us otherwise). In this case, the structural contours coincide with the relevant topographic contours.


Geological maps of a flat sandstone bed for the simplest case of a horizontal unit (left) where contacts coincide with topographic contours, and a vertical unit where the contacts cross all contours.
A vertical bed
The outcrop trace of a vertically dipping sandstone unit intersects all topographic contours along its line of strike (in this case strike is NE). If the unit is flat, the map extent of the top and base will plot as straight lines. The structural contours in this case correspond to lines of strike. If the unit is folded (and plunges vertically), then the map trace will correspond to a cross-section profile of the fold.
A dipping bed
In this scenario, the sandstone unit strikes 045o and dips 25o NW. The structural contours correspond to lines of strike. What is its map extent?
Because the unit is inclined, the 20 m thickness we determine from the two outcrops must be an apparent thickness. True thickness is calculated as shown in the diagram below.
We need to determine where this dipping unit intersects the surface topography. Beginning with the location where the top is exposed, plot the strike line (everywhere along this line will be 220 m asl), and note where the line intersects the 220 m topography contours at other locations (dashed blue line and dots in the diagram below).
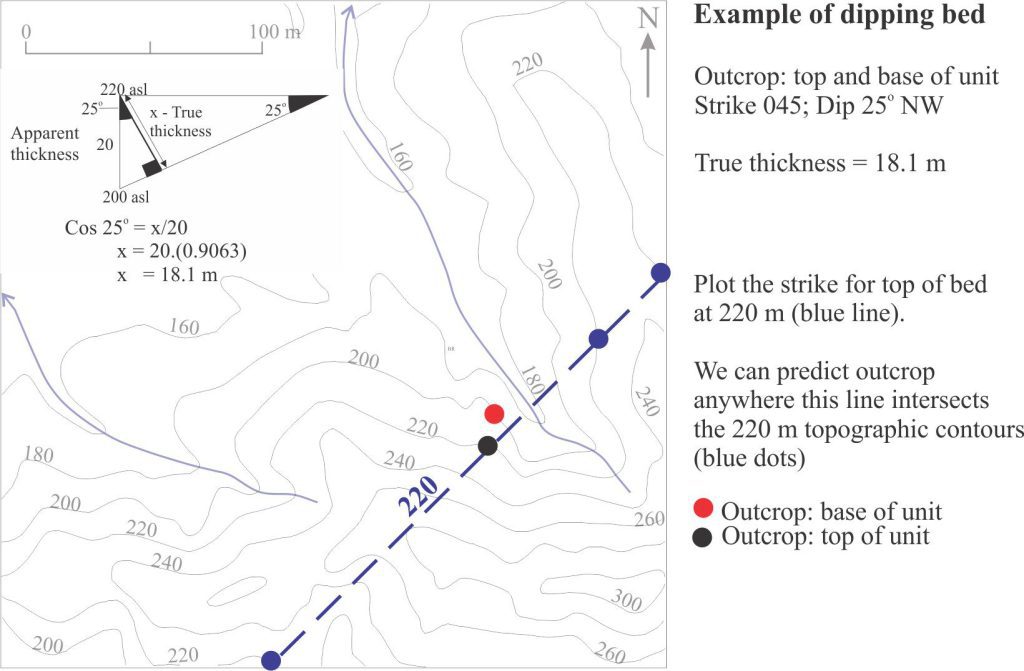

Plotting the strike line for the upper contact of the sandstone and points of intersection between the line and topographic contours of equal elevation.
Strike lines having the same orientation are now plotted above and below 220 m at elevation intervals corresponding to the topographic contour interval (20 m). To do this we need to calculate the map distance between successive lines given the dip and vertical separation of 20 m. This is shown below (using basic trigonometry functions).
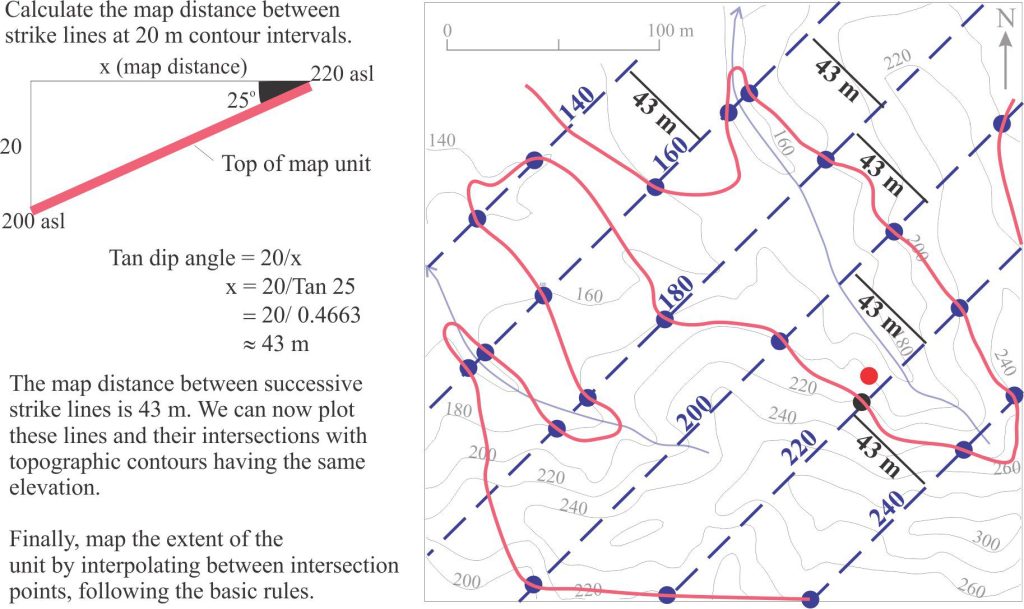

Calculating the distance between strike lines on the dipping, upper contact of the sandstone, plotting those lines and their points of intersection with topographic contours of equal elevation.
Strike lines and their intersections with the appropriate topographic contours for the top of the sandstone can now be plotted across the extent of the map. Joining the dots gives us the trace for the top across the map area, taking note of the following rules of interpolation:
- The trace should never cross itself.
- The trace can only intersect topographic contours where they have the same elevation (i.e., at the blue and green dots)
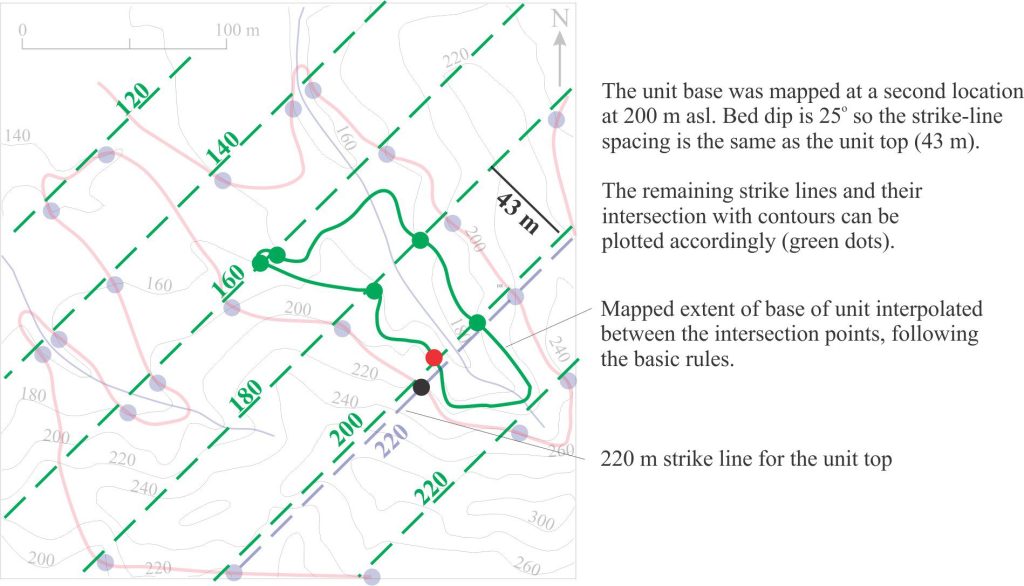
The exercise is repeated for the base of the unit. The map distance (43 m) between strike lines will be the same as that for the top of the unit because the dip is the same. In this exercise, the base of the sandstone is mapped over a small area.
Combining the two plots shows the geological map contacts of the sandstone unit. Outside these boundaries the unit either ‘disappears’ beneath elevated topography or has been removed by erosion as is the case for the area enclosed by the basal contact. This is illustrated in the cross-section below; the orientation-location of any cross-section is commonly chosen where it incorporates the most information.
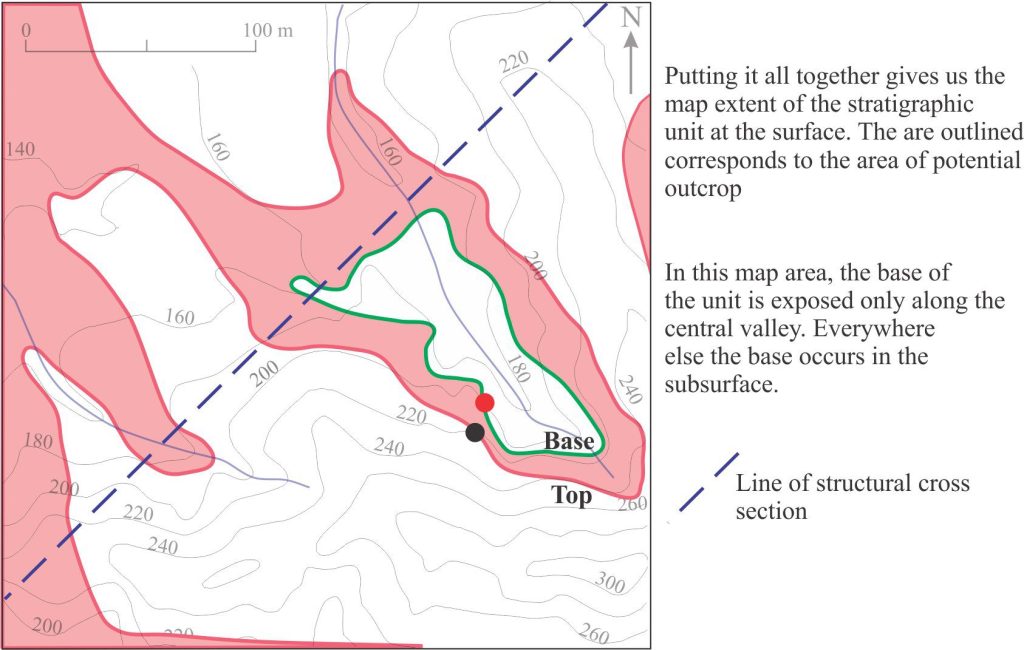

The resulting geological map extent of the sandstone unit, showing where the top and base are expected o crop out. The blue line indicates the location of a structural cross section; it coincides with the 180 m strike line for the top of the sandstone unit.
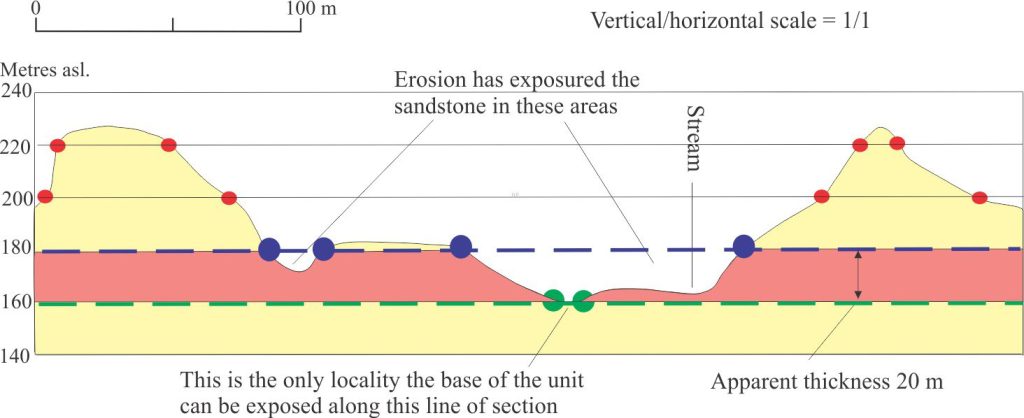

The cross-section (true scale) plots the intersection of strike lines at 180 m (blue dots – top of unit) and 160 m (green dots – base of unit) with topography (red dots). The section locates areas of (potential) exposure. Along this line of section, the map unit base is exposed only in one small area.
The cross-section is oriented along the 180 m strike line for the top of the sandstone and drawn at a scale of 1/1 (i.e., there is no vertical exaggeration). It shows:
- Topography, including stream beds.
- Because the section is vertical (and the unit has dip), the apparent vertical thickness of 20 m must be shown (not the true thickness).
- Areas of surface exposure – actual exposure may be limited by covering vegetation, swamps, soils and regoliths, or scree.
Some other posts from this series
Solving the three-point problem
The Rule of Vs in geological mapping
Faults – some common terminology
Thrust faults: Some common terminology
Strike-slip faults: Some terminology

