Tag Archives: apparent dip

Measuring and representing paleocurrents

Facebooktwitterlinkedininstagram

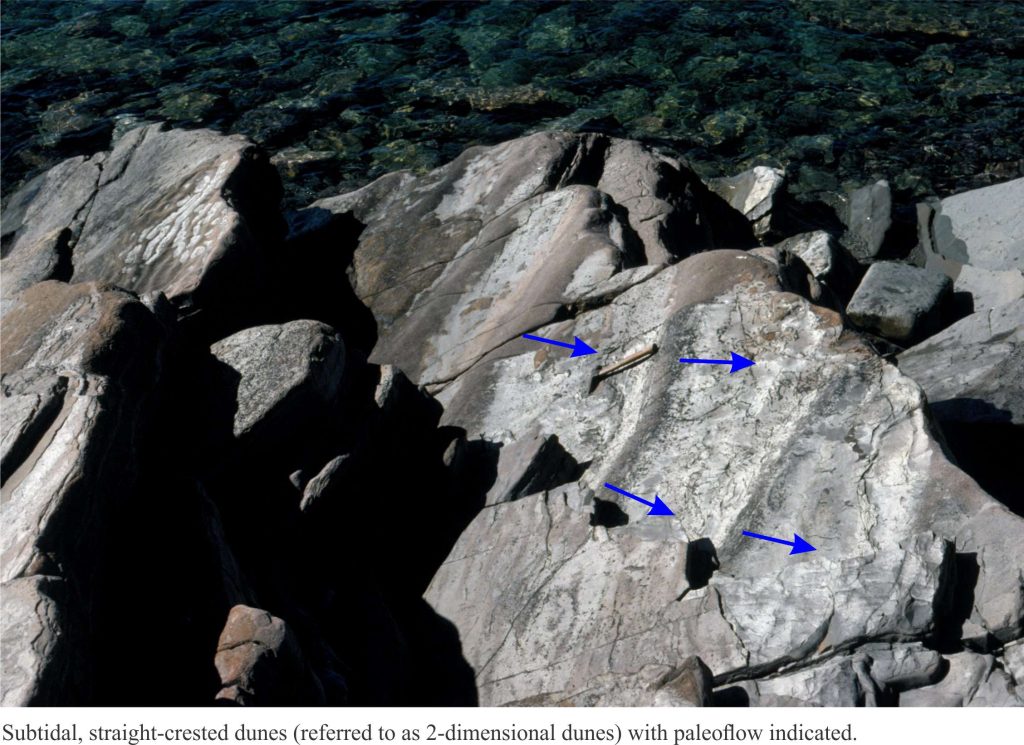
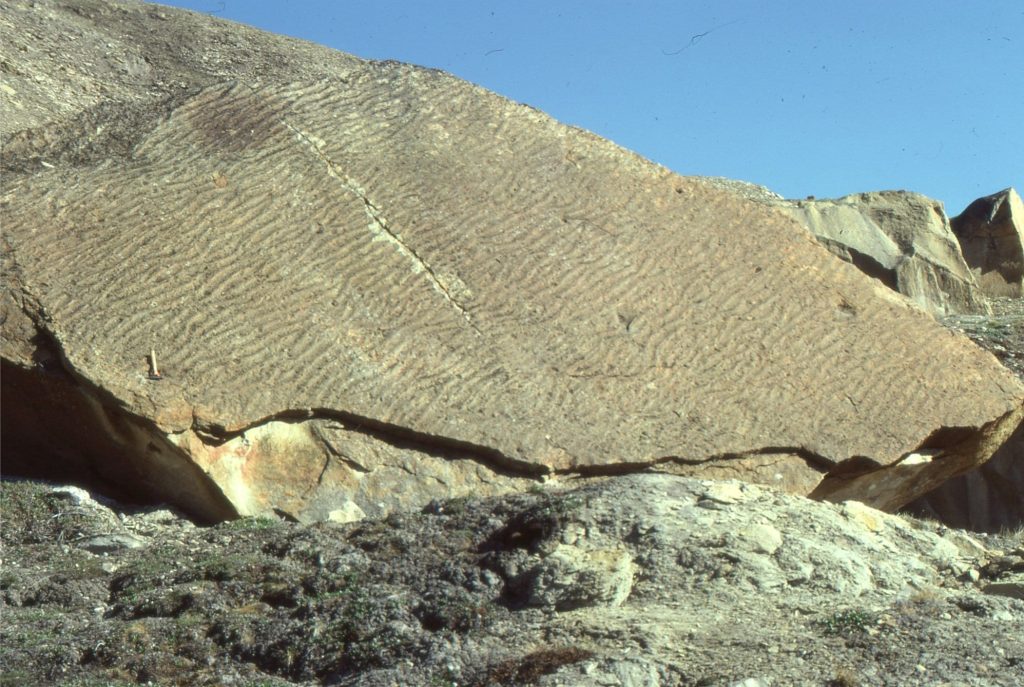
Large sand ripples exposed on bedding allow measurement of paleocurrents

This post is part of the How To… series

Identifying sedimentary structures that indicate paleocurrent directions is an important task in any study of sedimentary rocks. Knowing the direction of sediment transport will help you decipher paleoenvironments and sedimentary facies,  paleoslope dip directions, possible sources of sediment,  and the location of sediment sinks.

It all begins with a humble crossbed, flute cast, or current aligned object.  Identifying any of these is reasonably straight forward; knowing what to measure can be a bit tricky.

Asymmetric current ripple and dune bedforms exposed on bedding planes can be measured by noting the facing direction of lee slopes (face down current – see the image above). In such cases, measured bearings for individual bedforms provides a unique sense of flow.

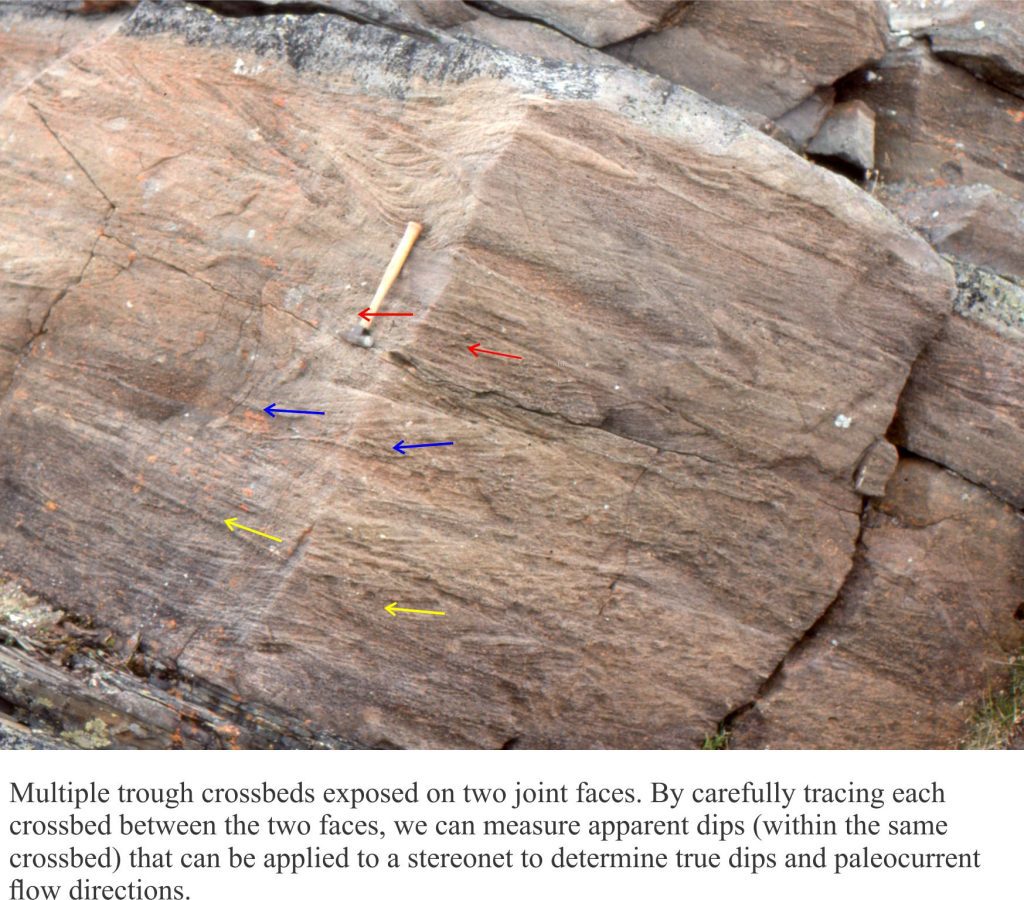
However, it is more common to find crossbed cross-sections in 2-dimensional exposures like cliffs and road-cuts. In situations like this, the crossbed foresets are more likely to present an apparent dip direction, rather than true direction of flow. The trick here is to look for nooks, crannies, joint or fracture faces that present a degree of three-dimensionality to the outcrop.

In the example below, crossbed foresets are exposed in two rock faces of a joint block, presenting us with two apparent dips. Measure both plunge and bearings, and find the true dip using stereographic projection.  In most cases, the direction of maximum foreset dip will be close to the paleoflow direction. BUT! You must be certain that the foresets belong to the SAME CROSSBED SET. This stipulation is important in situations where multiple crossbed sets cut one another – a feature of sandy fluvial and shallow marine deposits.

Measuring trough crossbeds in 3D exposures to calculate paleocurrent flow direction

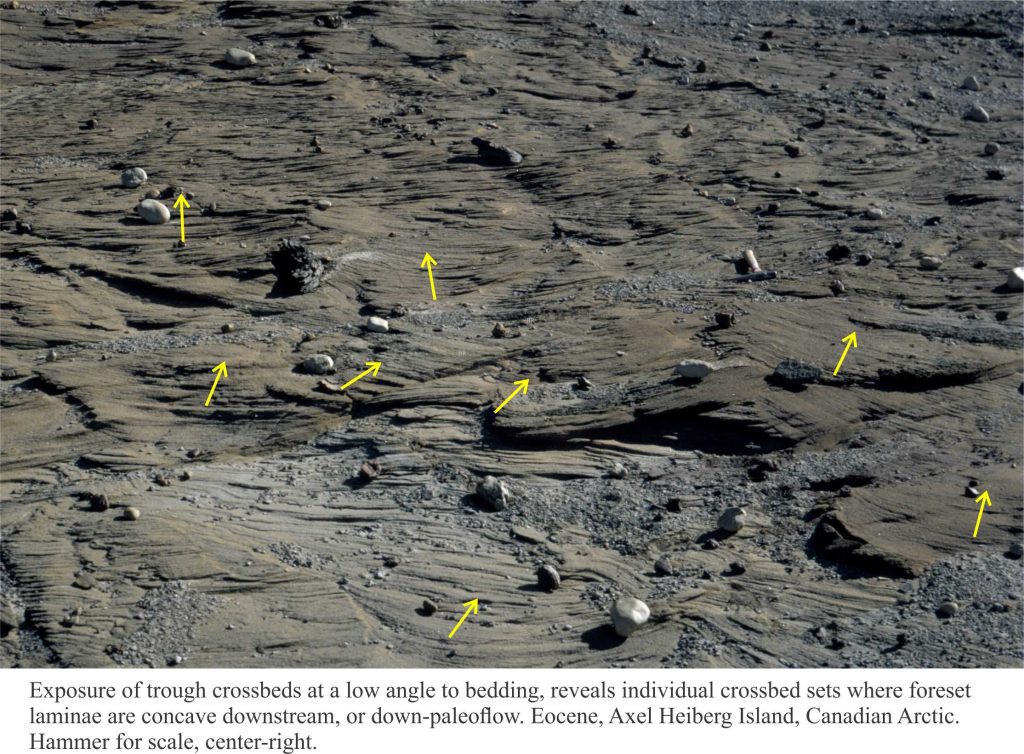
In exposures where crossbeds have been eroded parallel or slightly oblique to bedding, crossbed laminae are outlined in sinuous and festoon patterns. Trough crossbeds, and various 3D ripples exposed in this way (e.g. lunate ripples) provide an opportunity to take multiple paleocurrent measurements.  In the example of festooned crossbeds shown here the concave aspect of each trough set faces downstream.

Flow directions can easily be measured in festooned crossbeds exposed on or slightly oblique to bedding

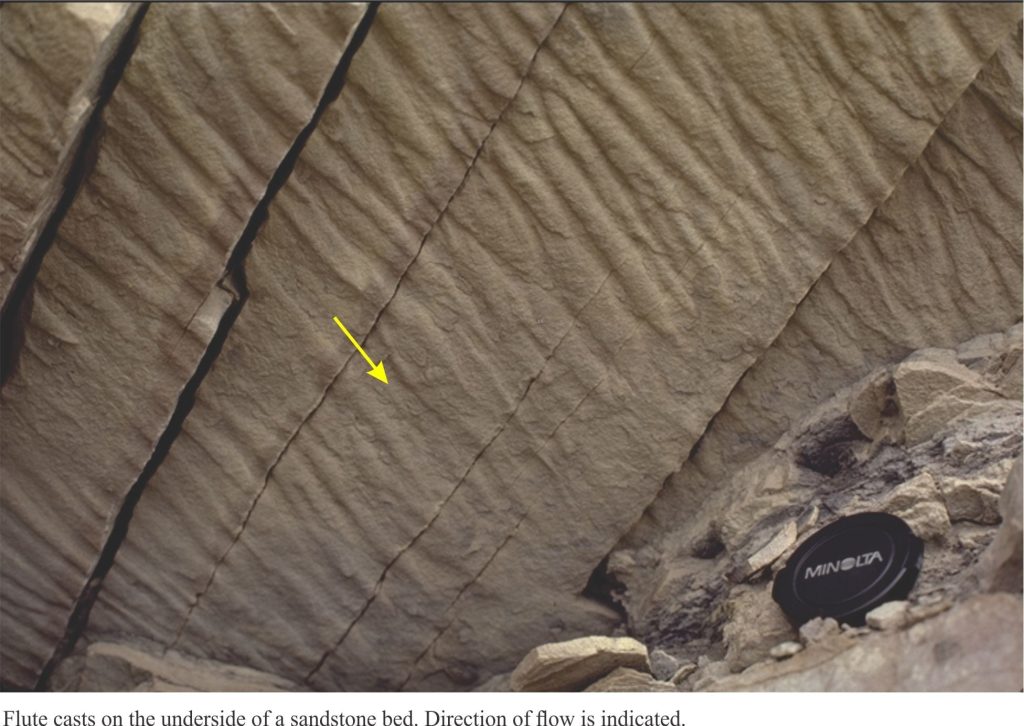
Of all the sole structures, flute casts are the most useful, providing (relatively) unambiguous paleoflow; flow is parallel to the length of the flute, from the deeper spoon-shape scour to the thin feather edge. However, paleoflow determined from groove casts is ambiguous, the two possible directions 180o apart. Data from sole structures is improved if flutes and grooves occur together.

Flute casts provide unambiguous paleocurrent flow directions

Graphical representation of paleoflow

How you treat the data graphically and statistically depends on the number of measurements at any one locality, and the geographic – stratigraphic distribution of data. A few questions you need to ask are:

  • Does the number of data points at each locality warrant separate treatment for each locality, or should the data be lumped into a single point of analysis?
  • Is the data distributed over a narrow stratigraphic interval (e.g. 1 or 2 beds, or a single coarsening upward sequence of beds), or a more extensive stratigraphic interval?
  • If data from multiple localities or stratigraphic intervals is aggregated, will important variations in paleocurrent trend be represented. For example, if there are local bimodal trends representing tidal ebb and flood currents, will these be ‘lost’ if all coastal data is analysed as a single block of data?
  • If mean flow direction is calculated, how useful is this measure of central tendency in the context of the overall spread of paleoflow directions?
  • Are corrections needed to account for structural dip?


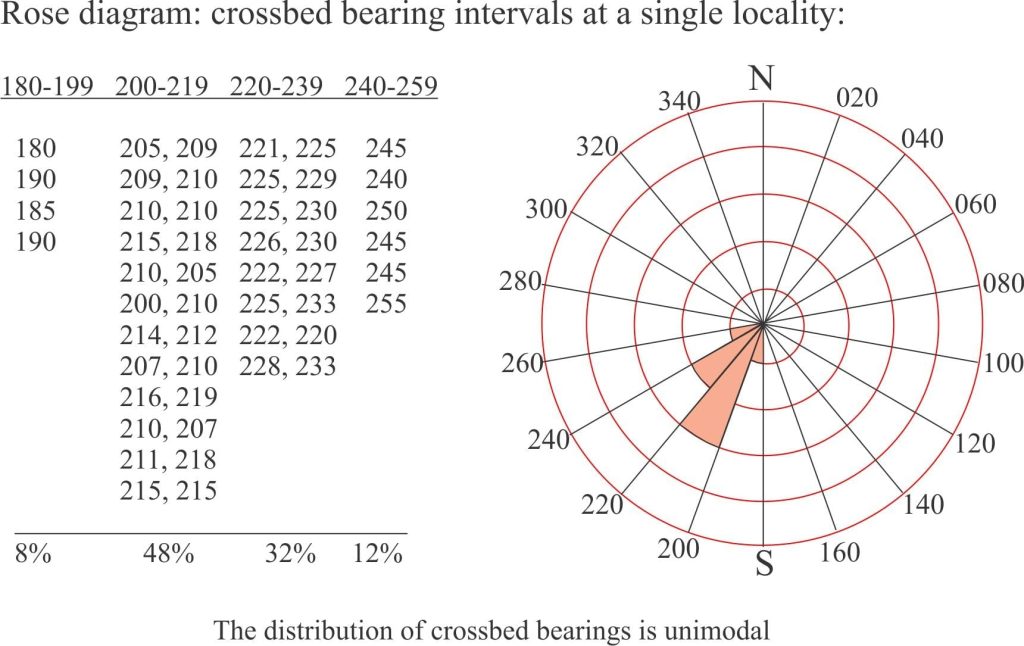
Rose diagrams provide the simplest way of representing data in diagrammatic form. Data is plotted as a circular histogram through 360o.  Several software programs are available to do these plots, but it is also a simple task to do it by hand. The inset shows you how to do this.

  • With the data in hand, choose a bearing interval (the example here is 20o intervals)
  • Organize the data in the intervals and calculate the percentage of measurements for each interval.
  • Plot each interval so that the length of each sector of the rose is proportional to the number of measurements for that interval. The example here uses intervals of 20%.

Tabulation of directional data and plotting a rose diagram for paleocurrent flow

The distribution is clearly unimodal. We could have chosen a 10o or 15o bearing interval for the plot which would probably show some finer detail about the paleocurrents.

Paleocurrent distributions in sedimentary basins generally fall into 3 or 4 categories: Unimodal (one primary direction), bimodal bipolar (2 directions 180o apart), bimodal oblique 2 directions at different angles), and polymodal (widely distributed).  Vector means for unimodal distributions are useful for comparing paleoflow among locations and assessing regional patterns of flow. However, the mean directions for strongly bimodal or polymodal distributions may have little real-world value in this context.

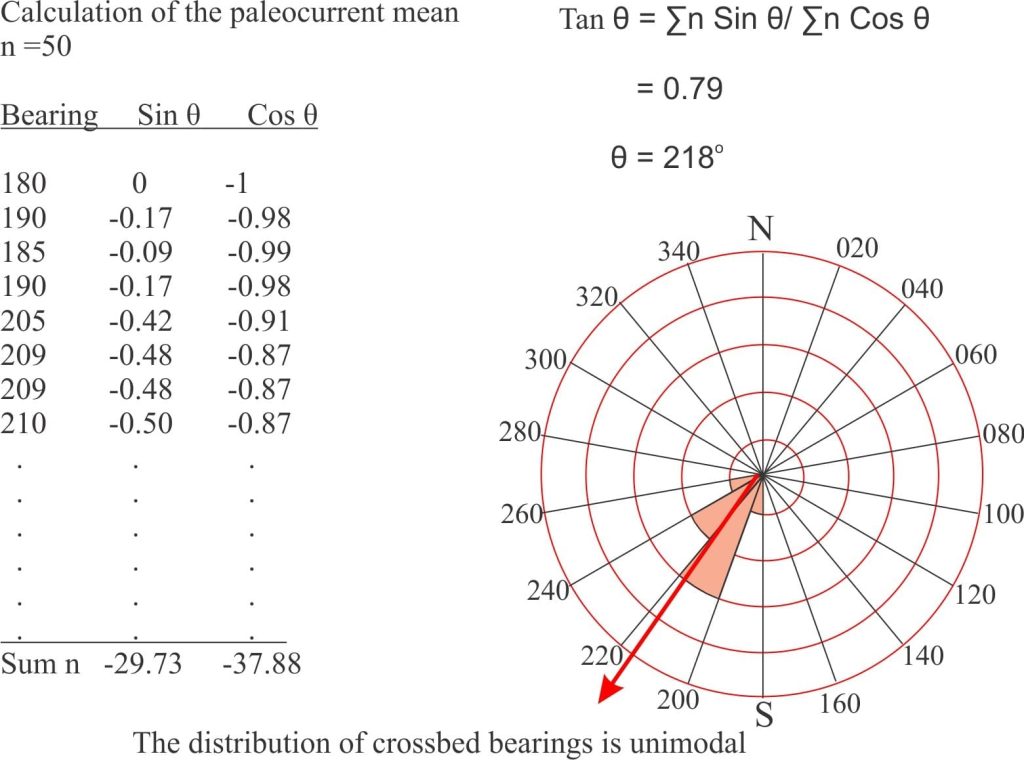
The Mean paleoflow vector can also be calculated, but the usual arithmetic methods DO NOT APPLY to azimuthal data. Calculation of the mean for our unimodal distribution is shown below.

Calculating the mean from a set of paleocurrent azimuths

Note: All the bearings are in the SW quadrant and therefore Sine and Cosine values are all negative, and Tangent values are positive. Other distributions may have a mix of positive and negative values – make certain you use the correct sign.


Here are a couple of free Rose plot programs (there are lots of commercial programs available):

GeoRose (free) for Windows and Mac

GEOrient (free for academic users)


Additional posts in this series:

Measuring a stratigraphic section

Identifying paleocurrent indicators

Crossbedding – some common terminology

The hydraulics of sedimentation: Flow Regime

Facebooktwitterlinkedininstagram
Facebooktwitterlinkedin

Stereographic projection – unfolding folds

Facebooktwitterlinkedininstagram

Restoring paleocurrent trends to their pre-deformation orientations

This post is part of the How To… series

Dipping bedding that is part of a fold limb

Sedimentary strata are commonly deformed. If we assume that the original depositional dip was close to horizontal (this is a reasonable assumption, although there are exceptions) then we need to account for structural dip. This is important if our sedimentary analysis includes measurement of paleocurrents, depositional dip and strike (e.g. ancient shorelines, rivers), or any paleogeographic determination.

Two methods are outlined here: the standard stereographic projection method that is usually done back in the lab unless you are lucky enough to have access to the internet in the field; and a quick field method using a field note book, pencil and compass; this method can only be used in strata folded by a single phase of deformation.

Stereographic method

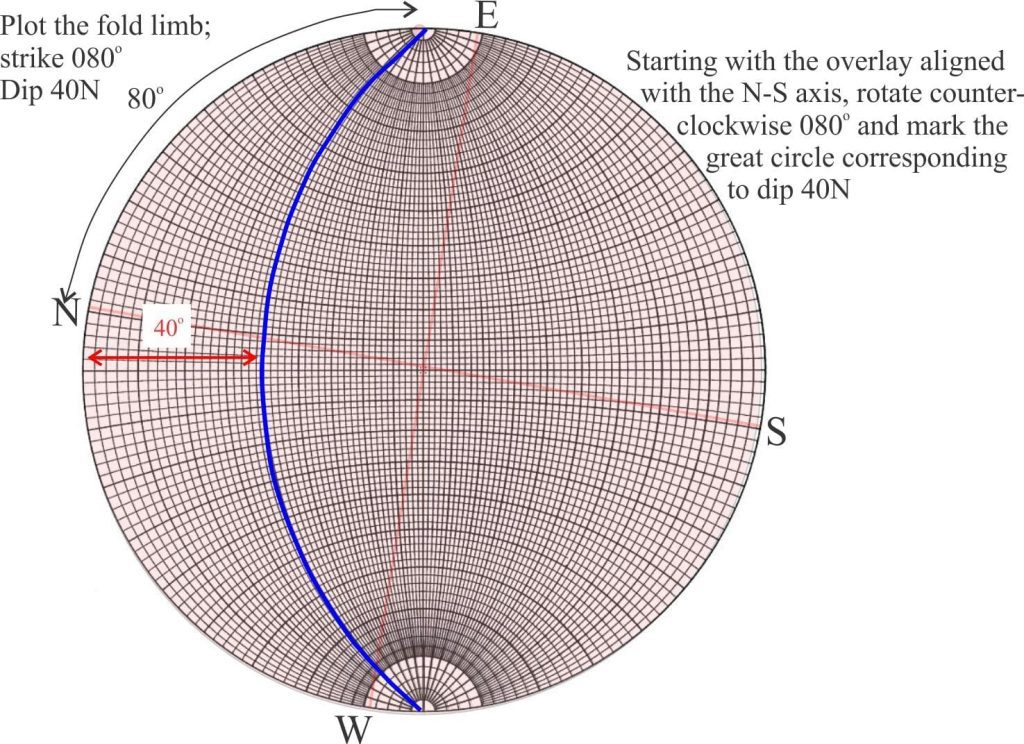
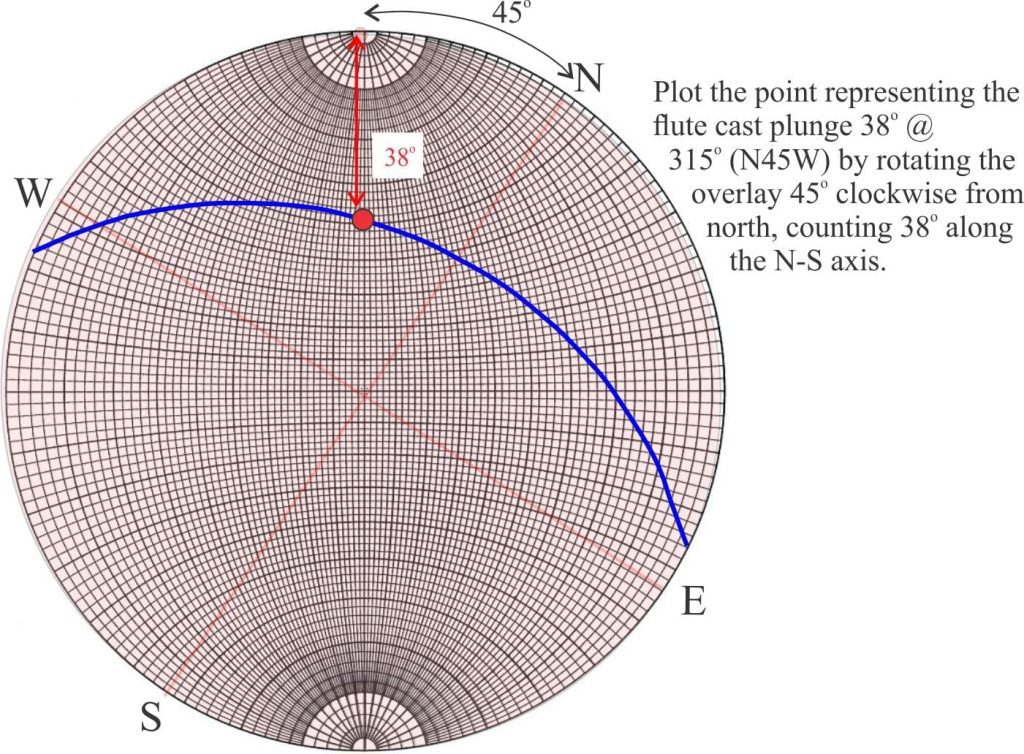
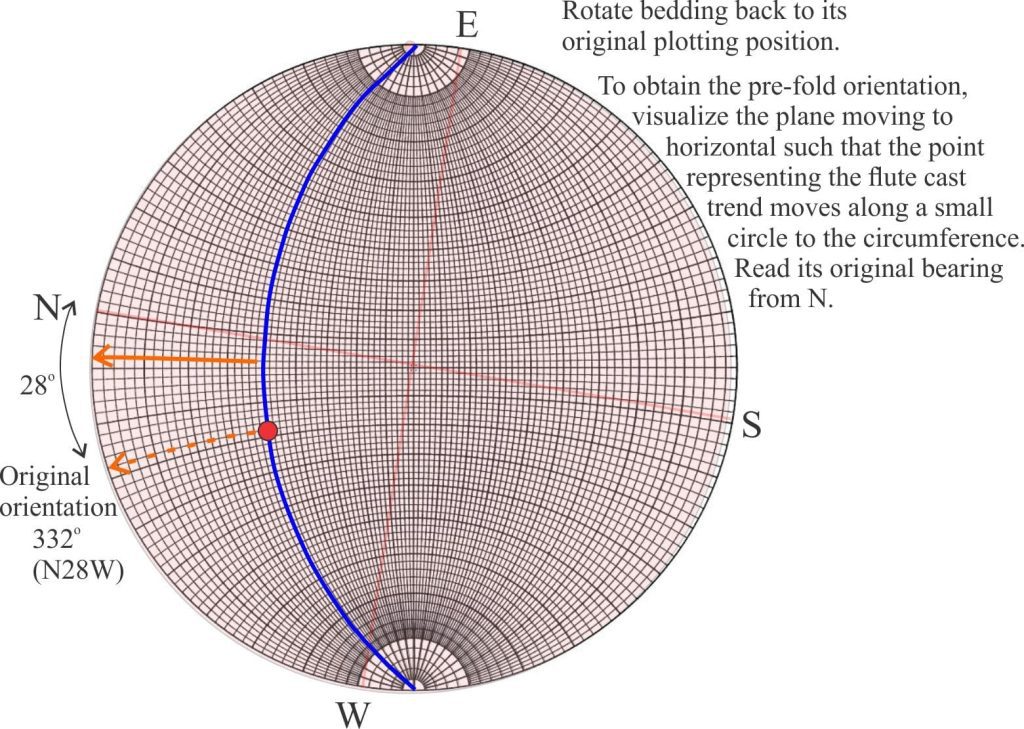
In the simplest case (diagrams below), strata containing flute casts have been folded into a syncline with a horizontal fold axis; we need to correct the for dip in the fold limb to find the original orientation of the flute cast.   Bedding strikes 080o (N80E), dip 40oN; the flute cast plunges 38o at 315o (N45W).

To determine the original orientation of flute casts, we plot bedding, then unfold the bed on a stereonet

On a transparent overlay, plot the plane (strike and dip) and the line (orientation and plunge) representing the flute cast (it will be a point on the great circle) on the stereonet. To return the plane to its original pre-fold orientation, it must be rotated about its strike; the next step is to move the great circle back to its original plotting position. When the plane is rotated to horizontal all points on the great circle will move along small circles to the stereonet perimeter. The point representing the flute cast is now in its original orientation – here 332o, or N28W. The difference between the uncorrected and corrected bearing is 14o.

Plotting the flute cast plunge and azimuth - it must lie on the the great circle that is bedding


Returning the dipping bed to its original horizontal position to read the orientation of the flute cast


Direct field method

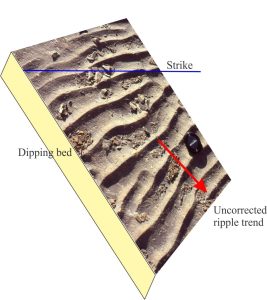
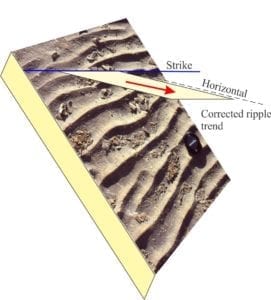
You can use this method when sedimentary structures (or any linear trend) are exposed on bedding planes.  It basically performs the same task as a stereonet correction.

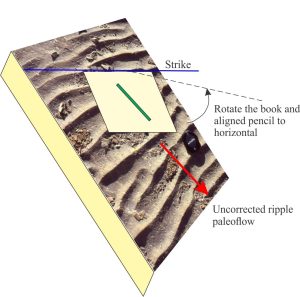
A simple field method to correct paleocurrent dirextions for dip

Place a hard, flat surface on bedding – hard-cover note book or board are good – with the long edge oriented along strike. Place a pencil or similar straight-edge on the surface such that it is aligned with the structure of interest (flute long axis, ripple trend etc). Rotate the book about its long edge (i.e. about the strike) until it is horizontal – make sure the straight-edge doesn’t move. Holding the book and straight-edge in place, measure the bearing.


If you are not convinced about the accuracy of the field method, check it against the stereonet correction. You will find with practice, and not a little care, that direct field measurement provides excellent results.


Some other posts in this series:

Measuring dip and strike

Solving the three-point problem

Stereographic projection – the basics

The Rule of Vs in geological mapping

Folded rock; some terminology

Facebooktwitterlinkedininstagram
Facebooktwitterlinkedin

Stereographic projection – the basics

Facebooktwitterlinkedininstagram

Plotting the orientation of a plane on a stereonet; finding strike and dip from two apparent dips

This post is part of the How To… series


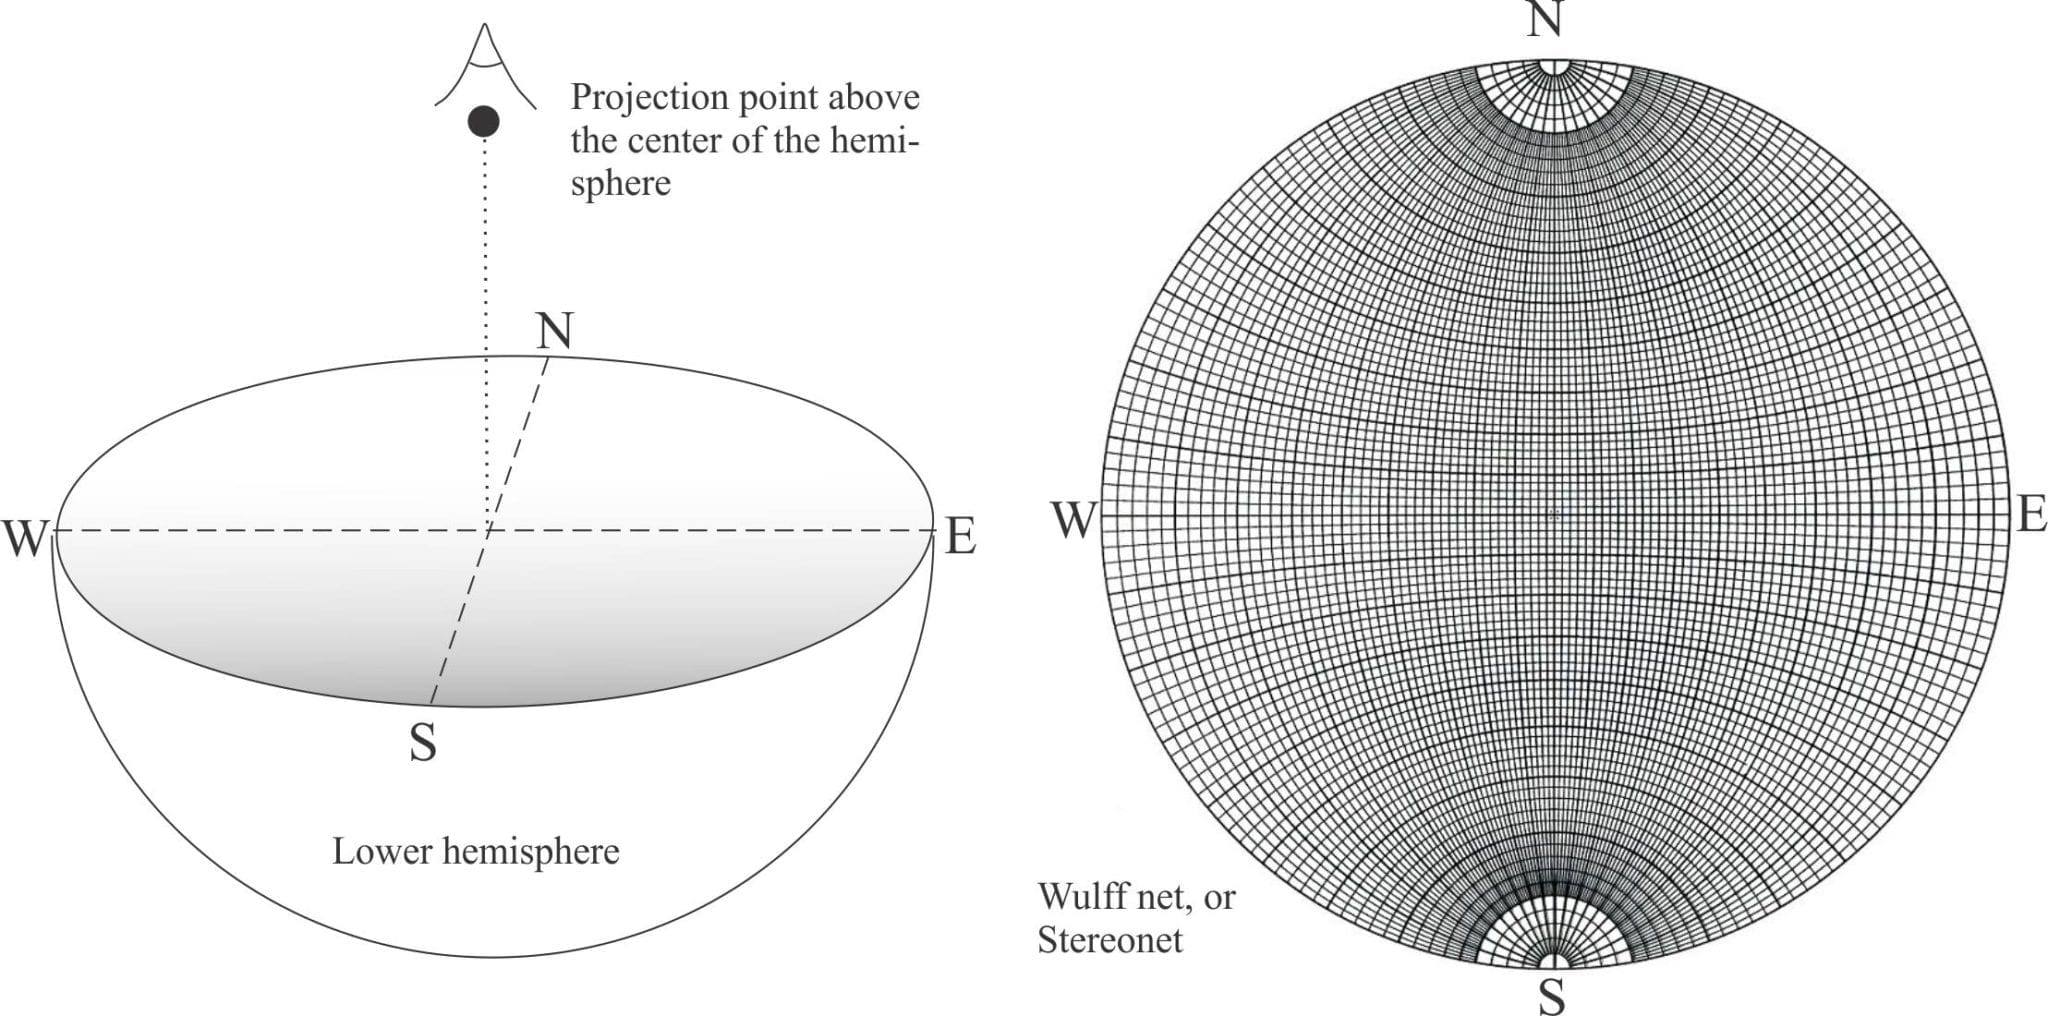
stereographic projection of lower hemisphere


My first exposure to stereographic projection methods of structural analysis was one of my more baffling moments of undergraduate geological learning. Looking around the class I could see I wasn’t the only one. Our tutor, a master at pointing out the obvious, suggested we try thinking in three dimensions. In retrospect it was probably some of the best advice I ever received. After all, geology is nothing if not an exercise in visualizing the 3- and 4-dimensional world around us.

Visualize a sphere; cut the top half off – we don’t need it. If you look directly down the vertical axis of the hemisphere it will appear to be two-dimensional. When you do this, you are basically projecting the 3-D hemisphere onto a 2-D circle. Once this projection has become embedded in your mind’s eye, everything else will fall into place.

The brief animation below shows a hemisphere rotated from an initial oblique view to the point where you are looking directly down the axis (or radius). At this point the hemisphere is projected as a circle that can then be overlaid by a stereonet grid like the example shown above. Each point and curve on the grid represents a point and curve on the hemisphere.


Stereographic projection is all about representing planes (e.g. bedding, foliation, faults, crystal faces) and lines (e.g. dip and plunge directions, fold axes, lineations) onto the 2-D circle. In geology, we overlay the 2-D projection with a grid of meridians, or great circles (analogous to longitudes), and parallels or small circles (analogous to latitudes). Thus, all compass points are represented. The net-like grid is called a Wulff Net, or stereonet. It is an equal angle grid where meridians and parallels intersect at right angles.

plotting a plane on a steronet


Note the two extreme projection conditions: the circumference is actually the great circle of a horizontal plane; the opposite is a straight line passing through the centre that is the projection of a vertically dipping plane.  Thus, shallowing dips tend toward the circumference.

The following animation shows how the great circle changes as the plane rotates from vertical to horizontal dip (in increments of 15°). The great circle corresponding to the dip is in red. The line drawn from the two points on the circumference through the centre is the strike.


In practice we use a transparent overlay pinned to the centre of the stereonet; we rotate the overlay according to the orientation of lines and planes.

Plotting a dipping plane

Follow the next exercise with the short animation. It was made from still images: use the pause and play buttons as you work through the exercise.


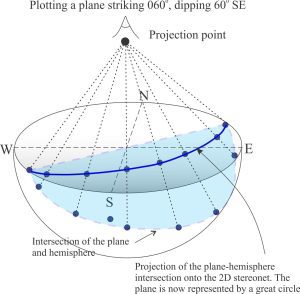
Imagine a plane striking 060o (N60E), dipping 60o SE; the plane passes through the centre of the sphere. In our vertical 2-D view the intersection of the plane with the hemisphere appears as a curved line, or great circle. Rotate the overlay counter-clockwise 60o; mark this point on the circumference. The great circle representing the angle of dip is found by counting along a line at right angles to the strike, i.e. along the E-W axis, counting 60o from the horizontal (the circumference).

Note that in the 2-D view, the great circle meets the circumference at 060o and 240o that are two points on a horizontal line across the plane; the great circle is therefore the strike of the plane.

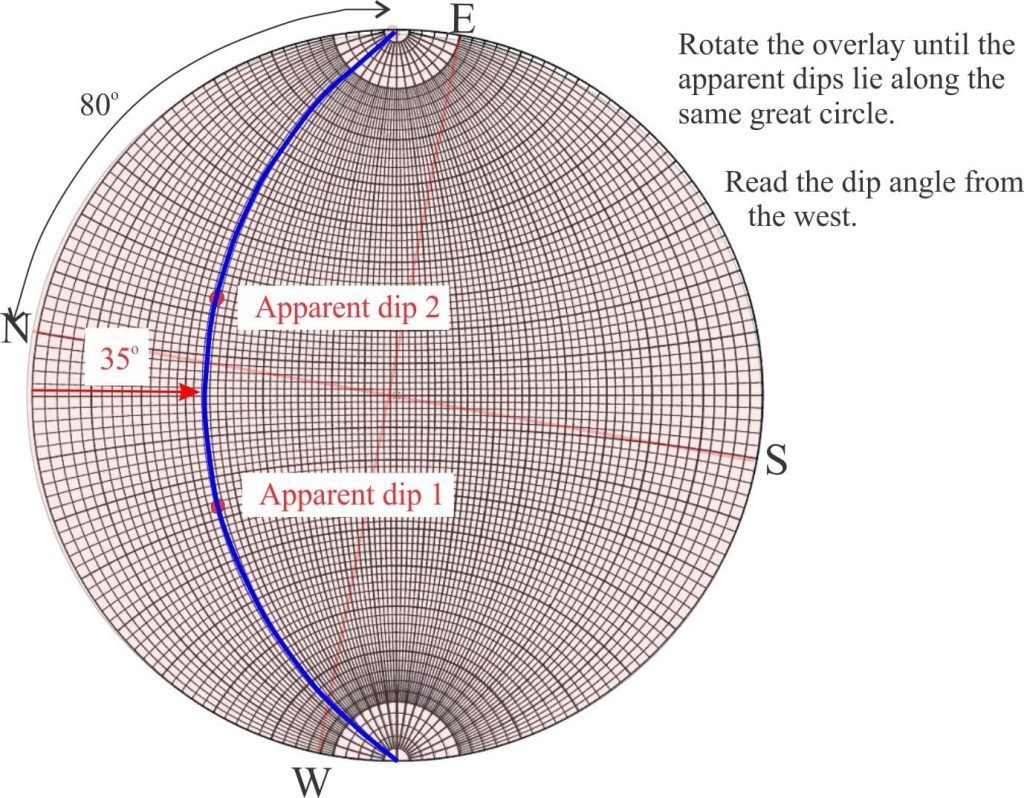
If a plane projects onto the stereonet as a great circle, then a line or lineation on the plane will plot as a point on the same great circle. To illustrate, we will find the true dip and strike of a plane for which we have measured two apparent dips: (1) 30o at 315o (N45W) and (2) 32o at 014o (N14E). On a transparent overlay, mark the positions of the N-S and E-W axes, and the stereonet centre. For (1), rotate the overlay 45o clockwise, mark the position at the N pole, then count 30o from N along the N-S axis. This point is the projection of apparent dip (1). Likewise, repeat for apparent dip (2). Rotate the overlay until the two apparent dip projections lie on the same great circle – read the bearing from N and the true dip along the E-W axis.


Determining apparent dip on a stereonet

Follow this exercise with the short animation. It was made from still images: use the pause and play buttons as you work through the exercise.


Stereographic projection is a powerful method, not just to solve relatively simple (but important) problems of dip and strike, but as an analytical tool for more complex structural geology. There are several good software programs and Apps to automate projections for large data sets. But before you dive into these digital tools, try the simple overlay first – there’s nothing like a hands-on approach to help galvanise an understanding of basic methodology.

Some other useful posts in this series:

Measuring dip and strike

Solving the three-point problem

Stereographic projection – unfolding folds

Stereographic projection – poles to planes

The Rule of Vs in geological mapping

Folded rock; some terminology

Here are some good website links:

Visible Geology

Rick Allmendinger’s Stereo 10 – there’s also a mobile App version

Innstereo (open source)

Links to several programs in The Structural Geology Page

Facebooktwitterlinkedininstagram
Facebooktwitterlinkedin

Measuring dip and strike

Facebooktwitterlinkedininstagram

How to measure dip and strike

This post is part of the How To… series

If we had to designate one set of measurements that is fundamental to all geology, it would have to be Dip and Strike. These simple measures define uniquely the orientation (compass bearings and angles) of a planar surface – any plane: bedding, faults, axial planes, mineralized veins, dykes and sills. Armed with dips and strikes, a geologist can project planes and the rocks they encompass across valleys, through mountains and deep beneath the Earth’s surface.  They are fundamental to deciphering Earth structures.

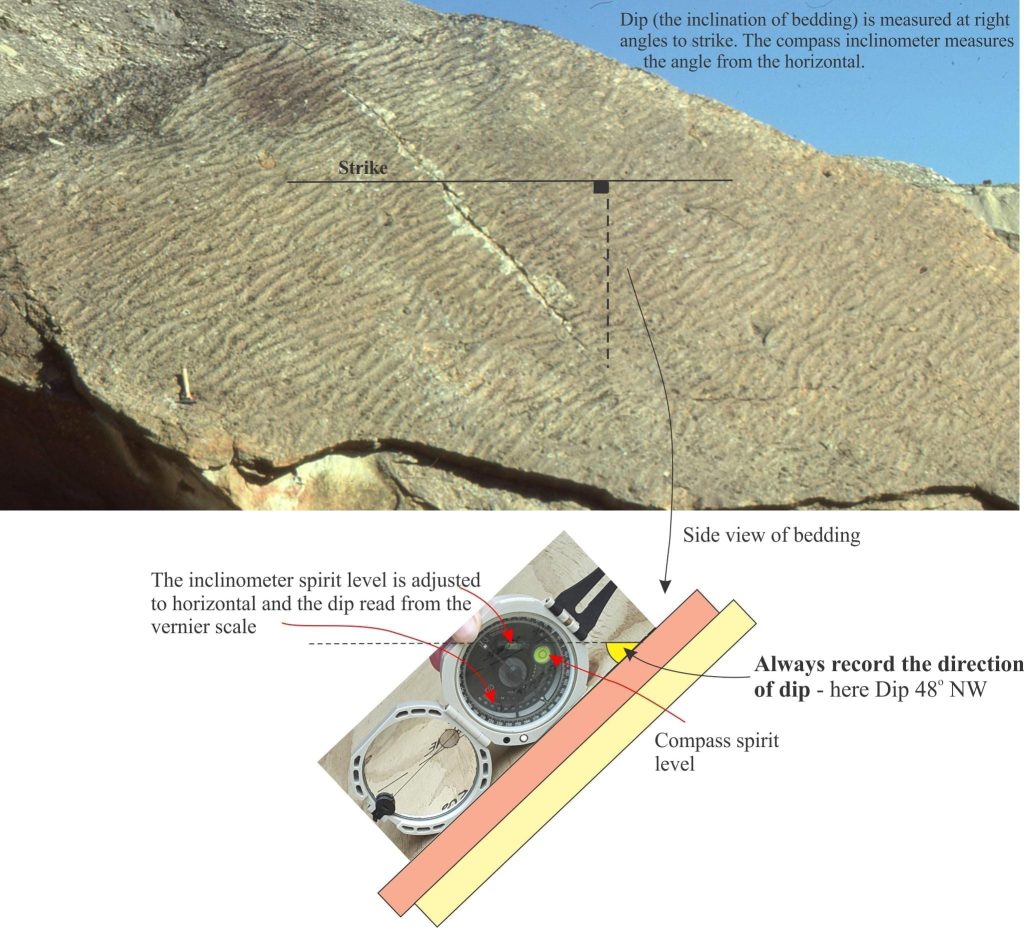
Strike: The compass bearing of an imagined horizontal line across a plane. If the plane is flat there is an infinite number of strike lines, all having the same dip (zero) but different bearings. If the plane is curved (e.g. a plunging fold) the bearing may change systematically over the fold.

Azimuth, or compass bearing is recorded as either (for example) 035o or N35E, or its counterpart 215o and S35W.

Visual description of dip and strike on bedding.

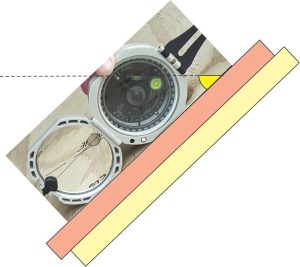
Dip: Dip is the angle of inclination measured from a horizontal line at right angles to strike. The angle is measured by placing a compass on the line of dip and rotating the inclinometer to the point where a spirit level indicates horizontal. The direction of dip need not be measured (it can be calculated directly from the strike bearing), but an approximate direction should always be recorded to avoid ambiguity, as in 48oNW.

The inclination measured at right angles to strike is the true dip. Inclinations measured at other angles on the plane will always be less than true dip – these are called apparent dips.

The animation below was made from still images: use the pause and play buttons as you work through the exercise.

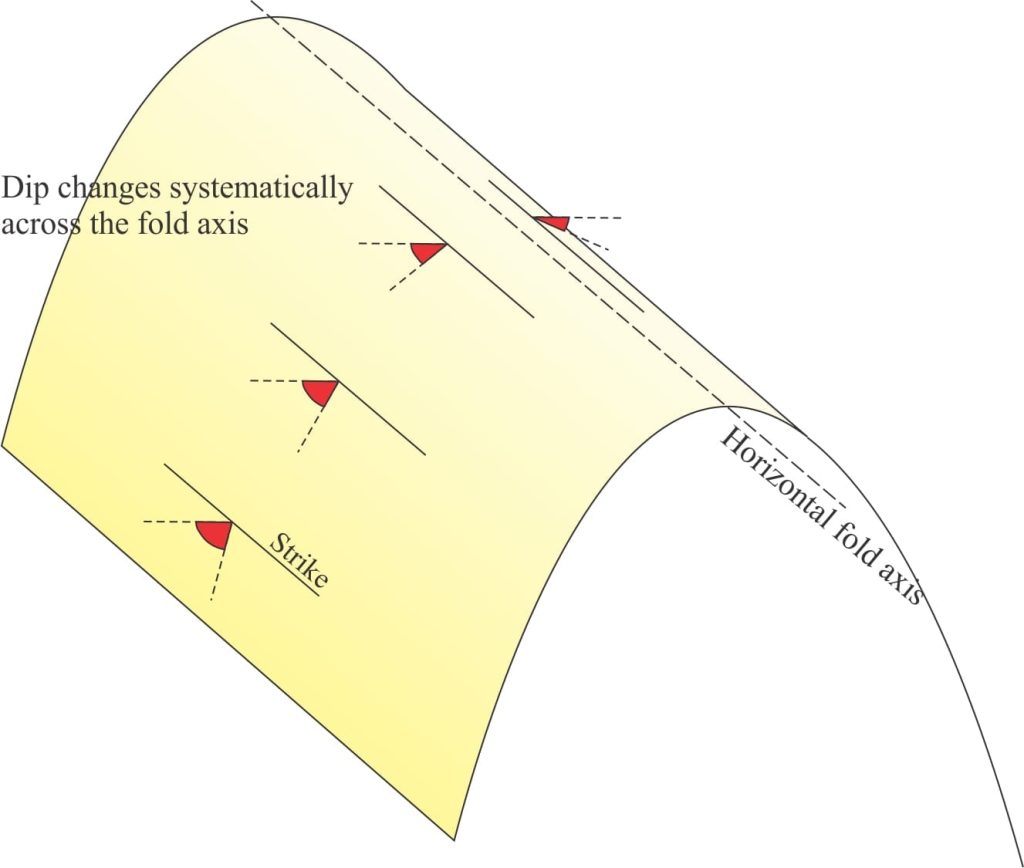
Dip and strike indicate the orientation of a plane at a specific location.  Dips and strikes of folded strata will tend to show systematic changes at different locations. In the example below the fold axis is horizontal and axial plane vertical. Strikes at any point on the fold limbs will all have the same azimuth, but dips will change progressively from one limb to the other.  Dips and strikes recorded on geological maps can be used to reconstruct the 2- and 3-dimensional structure of deformed strata.

Systematic change in dip through an folded plane; in this example the strike remains the same throughout.

Some other useful posts in this series:

Solving the three-point problem

The Rule of Vs in geological mapping

Plotting a structural contour map

Stereographic projection – the basics

Stereographic projection – unfolding folds

Folded rock; some terminology

Facebooktwitterlinkedininstagram
Facebooktwitterlinkedin