Tag Archives: lithospheric flexure

Basins formed by lithospheric flexure

Facebooktwitterlinkedininstagram
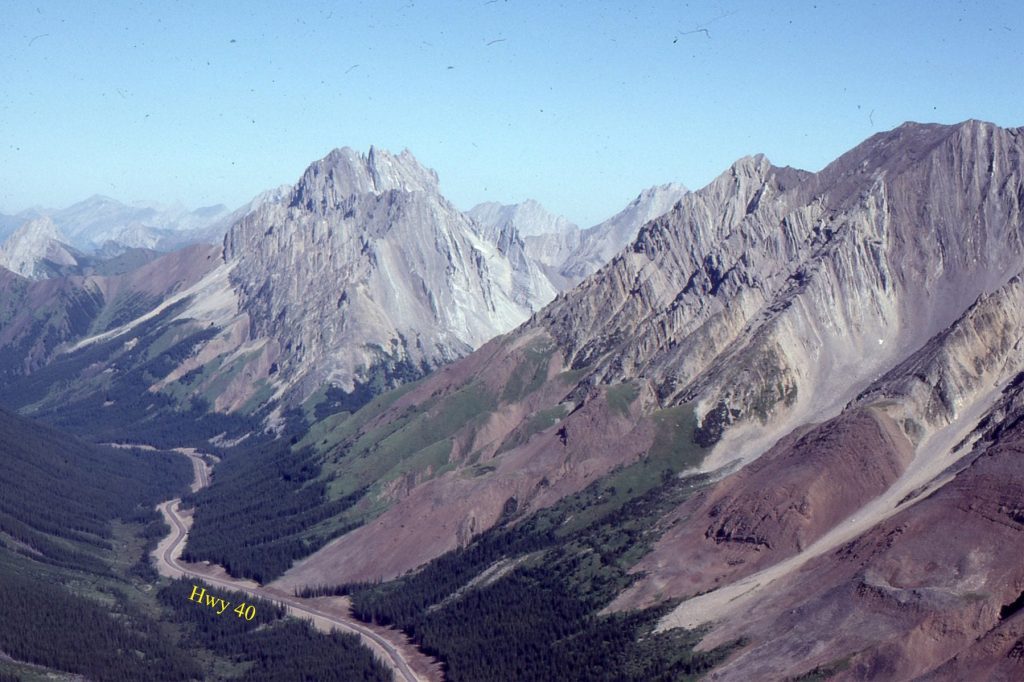
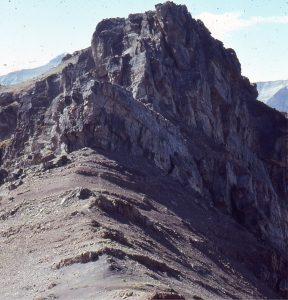
Part of the Alberta Front Ranges fold -thrust belt north of Highwood Pass. Sawtooth-like Lower Paleozoic carbonates are exposed as flatirons in the hanging wall of a thrust immediately east of Lewis Thrust. Late Jurassic – Early Cretaceous foredeep deposits in the valley floor (mostly covered) were involved in the deformation as the orogenic load migrated eastward. Orogenic transport to the right.

Part of the Alberta Front Ranges fold -thrust belt north of Highwood Pass. Sawtooth-like Lower Paleozoic carbonates are exposed as flatirons in the hanging wall of a thrust immediately east of Lewis Thrust. Late Jurassic – Early Cretaceous foredeep deposits in the valley floor (mostly covered) were involved in the deformation as the orogenic load migrated eastward. Orogenic transport to the right.

Basins formed by flexure of oceanic and continental lithosphere;  foreland basin exemplars.

What is flexure?

The way we define the rheological behaviour of tectonic plates creates an interesting paradox. We consider plates to be rigid, and yet we allow them to be non-rigid. Under certain conditions they behave elastically, under other conditions in a viscous or ductile manner. Lithospheric flexure is one of these non-rigid responses; the lithosphere can bend under applied loads and recover elastically if the load is removed. We are witness to this recovery in Scandinavia and Canada where there is measurable uplift or rebound on the heal of the Last Glaciation.

Lithospheric flexure also depends on a reaction in the underlying mantle. Dynamic topography, at wavelengths of several 100 km, is a manifestation of mantle convection. The development of oceanic trenches at subduction zones is partly a function of convection-induced subsidence. Likewise, foreland basin subsidence is probably caused by a combination of tectonic (orogenic) supracrustal loading and dynamic mantle loading by downwelling convection cells.

The oceanic lithosphere is a good place to start examining the causes and consequences of flexure, because it is relatively simple from a compositional and rheological perspective (compared with continental lithosphere). Lithospheric flexure occurs in subduction zones where the oceanographic expression is deep, long, linear trenches. Flexure also occurs beneath large volcanic islands like Hawaii, in this case producing a moat around the islands. In both cases, flexure occurs over wavelengths of 200-300 km.

Lithospheric flexure can be described as a sinusoidal wave. The bathymetric expression of this wave in subduction zones and oceanic islands reveals three main morphological and structural components: the load, a basin that forms immediately outboard of the load, and a forebulge (or peripheral bulge); the forebulge is the mechanical response to flexure of an elastic plate. The amplitude of the forebulge is a small fraction of the total flexure beneath the load. These components are also common to foreland basins on continental lithosphere.
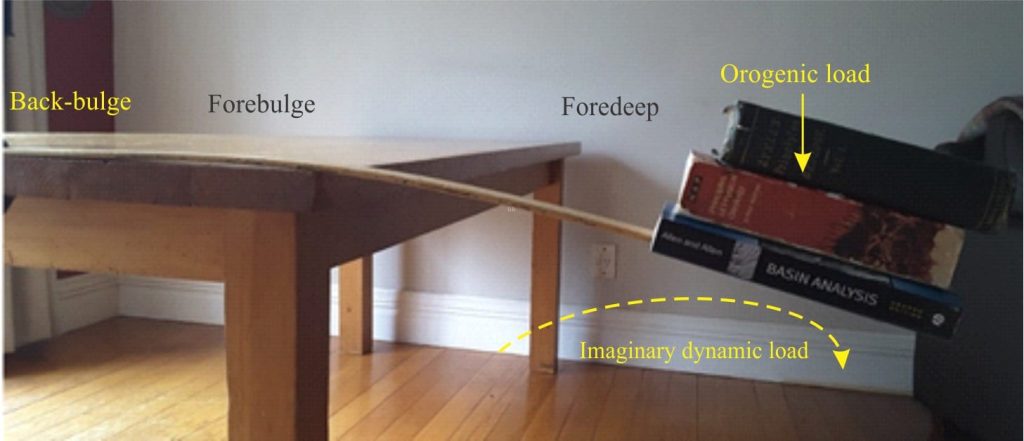
Flexure of a thin, continuous beam beneath a deforming orogen (and an imaginary mantle dynamic load). The amplitude of the forebulge is a small fraction of total flexure.

Flexure of a thin, continuous beam beneath a deforming orogen (and an imaginary mantle dynamic load). The amplitude of the forebulge is a small fraction of total flexure.

Note that loads can act:

  • Vertically as is the case for a volcanic edifice or stack of thrust sheets,
  • As horizontally applied stresses such as mid-ocean ridge push,
  • As a torque that results in bending, and
  • In the mantle by dynamic loading beneath the flexing plate.

Vertical loading by volcanic islands is relatively straight forward. Loading of a subducting slab is more complicated because it involves horizontal push stresses (from a spreading ridge), vertical loading of dense oceanic lithosphere as it sinks, and bending loads where the lithosphere is deflected downwards.

Flexure of oceanic crust depends not just on the load, but on two other factors:

  1. The age of the crust; older crust is colder, thicker, and mechanically stronger, and
  2. The elastic thickness of the lithosphere; thicker lithosphere will flex less than thinner lithosphere.
Left: A bathymetric profile (NE-SW) across the trend of the Emperor volcanic chain, between Oahu and Molokai, shows clear differentiation of the flexural moat and forebulge (on either side of the volcanic chain). Right: Modelled flexural curves for different elastic thicknesses. The Te that best fits is Te = 30 km. From Watts and ten Brink, 1989, Fig 1, Fig. 23.

Left: A bathymetric profile (NE-SW) across the trend of the Emperor volcanic chain, between Oahu and Molokai, shows clear differentiation of the flexural moat and forebulge (on either side of the volcanic chain). Right: Modelled flexural curves for different elastic thicknesses. The Te that best fits is Te = 30 km. From Watts and ten Brink, 1989, Fig 1, Fig. 23.

For the Hawaiian example, a north-south bathymetric profile offshore between Oahu and Molokai clearly shows the moat (basin) and forebulge; the amplitude of the bulge is about 200-400 m, and its wavelength between 100-150 km. The modelled flexural profile (Watts and ten Brink, 1989) is oriented along the axis of the island chain from Molokai to Hawaii. It shows significant flexure towards the massive volcanic load imposed by the big island Hawaii where the volcanic edifice is more than 10km high. The best fitting modelled thickness of the elastic lithosphere is 30 km (Zhong and Watts, 2013, open access) which indicates that the lithosphere has sagged about 4.5 km beneath the load.


Foreland basins

Foreland basins are the flexural response to tectonic loading of continental lithosphere. Like oceanic trenches they are elongate parallel to the load. However, they are fundamentally different to oceanic basins in several respects (information mainly from DeCelles (2012 – a nice review, PDF available); Allen and Allen, 2013):

  1. The basins form over continental crust that is compositionally more felsic, has greater thickness, and is rheologically more complex than oceanic crust. This complexity is exacerbated by internal structural and compositional discontinuities acquired over, in many cases, a billion years and more, including several episodes of mountain building and igneous intrusion.
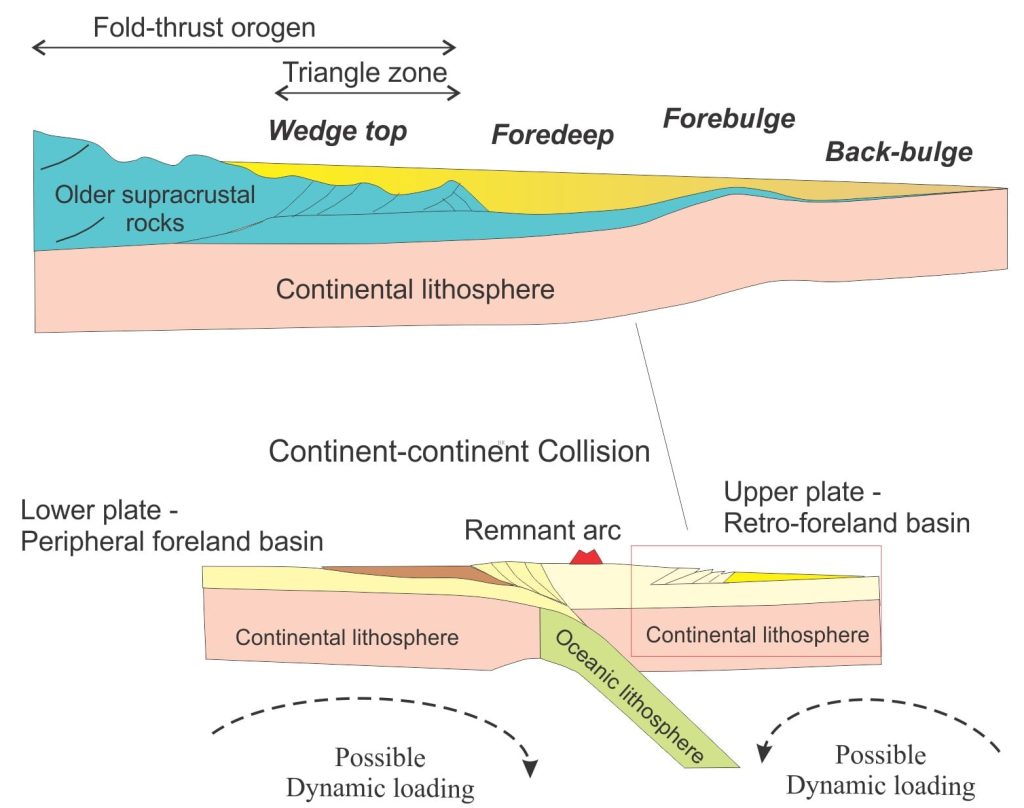
  2.  Foreland basins occur in upper and lower plates depending on the setting of plate convergence. For Andean-type orogens (oceanic trench – continent convergent boundaries) the retroarc foreland basin is in the upper plate (the trench is on the lower, subducting plate). Continent-continent type collisional margins may contain basins on both the lower plate (peripheral foreland basins) and upper plate (retro-foreland basins).
  3. Loading and flexure are dynamically linked to an evolving orogenic belt. The orogen itself forms under compression, where stacking of thrust sheets results in shortening of the upper crust by 100s of kilometres. It is this telescoping of thrust sheets that creates a dynamic supracrustal load – dynamic in the sense that each thrust event increases the topographic load, and therefore the amount of flexural subsidence.
  4.  Dynamic loading coupled to mantle convection may also contribute to subsidence. In this case, the wavelength of any dynamic topographic effects means that the entire foreland basin will be affected.
  5.  Development of topography is accompanied by evolving orographic effects on the distribution of precipitation, erosion, and delivery of sediment to the basin.
  6.  The amount of flexural subsidence in a foreland basin depends on the load, the elastic thickness of the lithosphere, and whether the flexing plate is continuous or broken; a broken plate is one with significant structural discontinuities, such as terrane or old plate boundaries. Flexure is fundamentally an elastic (or possibly viscoelastic) response. An important corollary of this behaviour is that the lithosphere will also respond to unloading. Erosion of elevated terrain accomplishes two things: it reduces the load, and it provides sediment for the adjacent foreland basin. Erosion, if it proceeds far enough, will induce an isostatic response – namely, uplift (e.g. Heller et al. 1988). The change from thrust load induced flexural subsidence to isostatically induced uplift may be preserved in the basin stratigraphic record as an influx of conglomerate.

    Thin interbedded fluvial sandstone-mudstone (uppermost Elk Formation, Lower Cretaceous) abruptly overlain by crossbedded conglomerate (braided river facies – Cadomin Formation). The gravel pulse was probably shed across the wedge top during uplift and erosion of the Early Cretaceous orogenic topography.

    Thin interbedded fluvial sandstone-mudstone (uppermost Elk Formation, Lower Cretaceous) abruptly overlain by crossbedded conglomerate (braided river facies – Cadomin Formation). The gravel pulse was probably shed across the wedge top during uplift and erosion of the Early Cretaceous orogenic topography.

  7.  Foreland basins have asymmetric profiles, deepest close to the frontal thrusts of the orogen.
  8.   A useful 4-fold partitioning of foreland basins (DeCelles and Giles, 1996), based on structural position and the loci of deposition, recognises a (structural) wedge top depozone, a foredeep outboard of the frontal thrust, a forebulge that is part of the flexural wave, and a shallow back-bulge area that tapers toward the continent to a basin margin.

    Foredeeps in the upper and lower plates that form during continent-continent collisions (after DeCelles, 2012, Fig. 20.2b). A schematic of the four depozones of a typical foreland basin are shown in the expanded view (from DeCelles and Giles, 1996

  9.  The basin axis will migrate towards the continent in concert with the flexural wave during incremental orogenic loading. The foredeep, forebulge and back-bulge will move in tandem with these axial excursions. This is illustrated below for the Western Interior Basin over the period Campanian to Paleocene – in this case the hingeline between foredeep and forebulge is plotted. There is a general northward migration of the foredeep over about 25 million years, albeit with a few twists and turns. The driving force for this pulse of foreland basin development corresponds with the docking of Insular superterrane to the western margin of North America (Insular Superterrane consists primarily of Wrangellia and Alexander terranes.

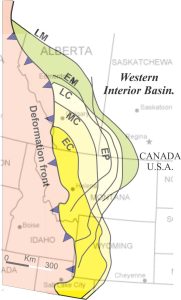
    Fore deep migration mapped for a 25 million year interval (Campanian to Early Paleocene), for the Western Interior (foreland) Basin. EC = Early Campanian; MC = middle Campanian; LC = Late Campanian; EM = Early Maastrichtian; EP = Early Paleocene. From Miall and Catuneanu, 2019.

    Fore deep migration mapped for a 25 million year interval (Campanian to Early Paleocene), for the Western Interior (foreland) Basin. EC = Early Campanian; MC = middle Campanian; LC = Late Campanian; EM = Early Maastrichtian; EP = Early Paleocene. From Miall and Catuneanu, 2019.

  10. Foreland basins are filled with sediment derived from the adjacent orogen. Stratigraphic thicknesses commonly exceed 5 km.
  11. Proximal foredeep deposits inevitably become involved in the deformation as the frontal thrust moves towards the continent.
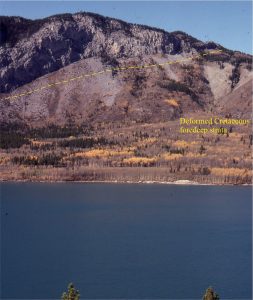
Devonian-Mississippian carbonates thrust over softer, less resistant Upper Cretaceous foredeep deposits.

Devonian-Mississippian carbonates thrust over softer, less resistant Upper Cretaceous foredeep deposits.

A few notes on foreland basin depozones

Each depozone is characterized, in a general way, by sedimentary processes and stratigraphic architecture that reflect proximity to the topographic load, periodically active thrust faults and associated antithetic-synthetic structures, and depozone migration in concert with the flexural wave. Thus, in an ideal case, the wedge top will eventually overlie and perhaps structurally incorporate deposits of the axial foredeep, that in turn will overlie deposits on the peripheral bulge and back-bulge. These transitions may be represented stratigraphically, with wedge top deposits at the top of the pile. However, given the structural dynamics of these basins, deposits from any of the depozones may be missing, or cannibalised by the advancing thrust front.


Wedge top

The surface created at the front of an orogenic wedge is often topographically low relative to thrust-related topography in the older part of the orogen. The locus of deposition across the wedge top will to a large extent be guided by faulting; deposits may even be carried piggy-back style with advancing frontal thrusts. Deposits will typically form coarse-grained alluvial fans and low-sinuosity fluvial channels that eventually merge with the adjacent foredeep. Finer grained sediment will mostly bypass the wedge top and accumulate in the foredeep. Basinward migration of the orogenic wedge may see older foredeep and wedge top deposits cannibalised and reworked into younger segments of the wedge top. Structurally induced unconformities are common.


The foredeep

Foredeeps are the most extensive, deepest, and stratigraphically the thickest depozone of any foreland basin. Although coarse-grained sediment may spill across the shallow, foredeep coast, the bulk of sediment in this depozone is dominated by sand and mud. The foredeep axis is closest to the deformation front and thus is the deepest part of the basin, shallowing towards the peripheral bulge.

Fluvial depositional systems, originating on the wedge top, may feed deltas or shallow shelves; these systems can develop on both the orogen and forebulge margins. If marine, these shallow environments will be subjected to tectonically and eustatically induced sea level fluctuations where a shelf is exposed to fluvial processes, and where sediment is transported to the deep basin to accumulate as submarine fans.


The forebulge

With theoretical amplitudes on the order of 10s of metres, and widths <100 km to >400 km, any forebulge will be a relative subtle topographic feature compared to the adjacent foredeep. In real foreland basins the stratigraphic record of forebulge development is commonly ambiguous.

Sediment supply is mainly from the foredeep with contributions from the continent and back-bulge basin. Carbonate platforms may develop where the supply of terrigenous sediment is low. Where submerged they are represented by thin sedimentary units including condensed stratigraphic sections. Where exposed they are subjected to erosion and development of regoliths, and in some cases aeolian deposition. Unconformities are common. The principal stratigraphic architectures involve onlap on the orogen side, and downlap on the continent side of the bulge.
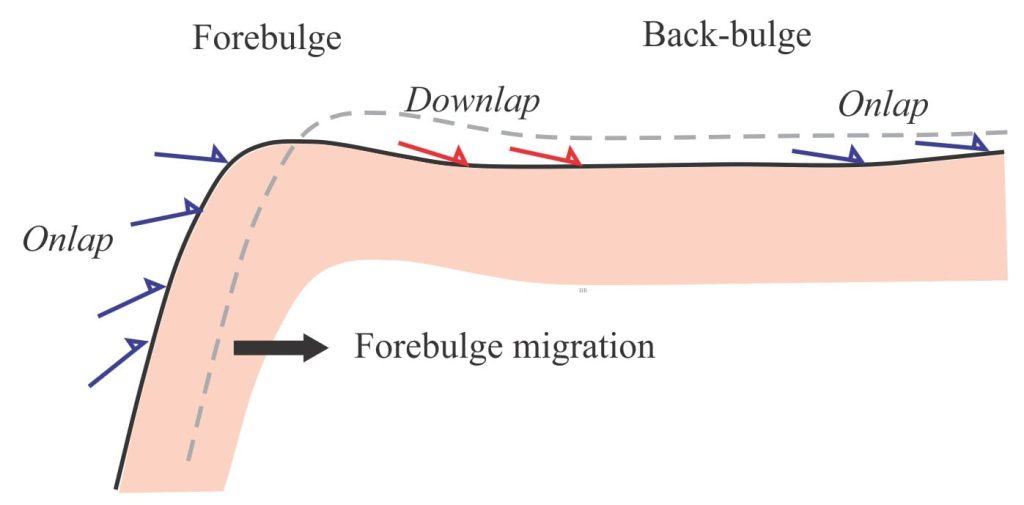
Typical apout relationships of stratigraphic units across the forebulge and back-bulge depozones. Changes in the location of the bulge with the flexural wave will result in unconformities across most stratigraphic surfaces.

Typical lapout relationships of stratigraphic units across the forebulge and back-bulge depozones. Changes in the location of the bulge with the flexural wave will result in unconformities across most stratigraphic surfaces. From DeCelles, 2012, Fig. 20.1

Back-bulge

The depozone between the forebulge and continent is shallow; sediment is derived from the foredeep but tends to be fine-grained. Some sediment will be contributed by the exposed continent. Strata will onlap the unconformity with continental rocks.


Other posts in this series

Sedimentary basins: Regions of prolonged subsidence

Defining the lithosphere

The rheology of the lithosphere

Isostasy: A lithospheric balancing act

The thermal structure of the lithosphere

Classification of sedimentary basins

Stretching the lithosphere: Rift basins

Nascent, conjugate passive margins 

Thrust faults: Some common terminology

Accretionary prisms and forearc basins

Basins formed by strike-slip tectonics

Allochthonous terranes – suspect and exotic

Source to sink: Sediment routing systems

Geohistory 1: Accounting for basin subsidence

Geohistory 2: Backstripping tectonic subsidence

Facebooktwitterlinkedininstagram
Facebooktwitterlinkedin

The rheology of the lithosphere

Facebooktwitterlinkedininstagram


The mechanical behaviour, or rheology of the lithosphere.

Sedimentary basins are regions of long-term subsidence of, in most cases, the entire lithosphere (the crust and mantle lithosphere). This truism rolls easily off the tongue, but its implications are important – subsidence involves deformation that effects the whole lithosphere; the mechanics of that deformation determine the kind of basin that will form.

We can think of rheology in terms of the relationship between stress (force) and strain (deformation). Deformation occurs if the stress applied is greater than the strength of the rock body. The most familiar expressions of rock and sediment deformation are those we visualize in outcrop, mountain sides, and satellite images of entire mountain belts: Faults and fractures, tectonic and soft-sediment folds, translation of rock bodies from one place to another, cleavage, even compaction. The conditions for these deformations are reasonably well known; some can even be reproduced in the laboratory. Several factors influence this stress-strain relationship:

  • The magnitude of the stress.
  • The strength of the rock body, influenced by its composition and the presence of internal inhomogeneities or discontinuities (also called anisotropy), such as pre-existing fractures or fabrics like mineral alignment.
  • Temperature; as a general rule, ductility, or the ability to flow increases with temperature in concert with a decrease in yield strength (i.e. the point at which it deforms). Temperature is an important determinant of the transition from brittle to ductile behaviour.
  • Confining pressure; the yield strength of rock tends to increase with confining pressure.
  • Strain rate; Most rocks will fracture at very high rates of deformation (e.g. during earthquakes), but the same rocks may deform by ductile flow at geologically extended strain rates.

We can describe the behaviour of rock and sediment using three basic mechanical, or rheological models: elastic, plastic, and viscous behaviour. These rheological models can be applied to the lithosphere and asthenosphere in much the same way that we apply them to the deformation we see in outcrop and mountain belts.


Elasticity of the lithosphere

Flying through turbulence can be disconcerting, particularly if you have a window seat where you can see the aircraft wings moving up and down. This is not a flaw in wing design; it is quite deliberate.  The wings are responding to stresses developed during the violent changes in aircraft trajectory and air pressure.  If the wings were more rigid, they would be at greater risk of breaking off. Happily, there is no permanent deformation in the wing framework; they have responded elastically to the applied stress.

Most Earth materials respond to stress elastically where deformation up to some yield strength (the elastic limit) is non-permanent; the rock or sediment recovers its original shape. Deformation is permanent beyond this limit in rock strength. How this deformation occurs depends on the conditions noted above (e.g. confining pressure, temperature etc.). Deformation (extension or compression) at relatively shallow crustal levels tends to be brittle; at greater depths there is a transition from elastic to plastic behaviour (ductile flow).

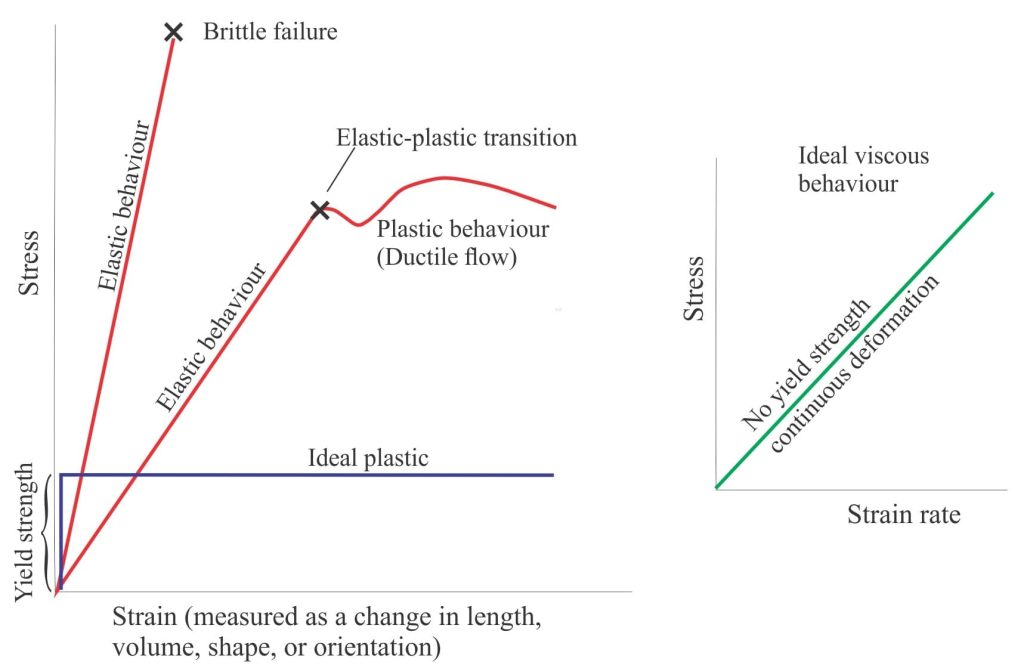
The stress-strain relationships representing the three rheological models is shown in the diagram.  For elastic strain (deformation), stress is proportional to strain until the point of failure. Elastic deformation begins immediately a stress is applied; there is no yield stress (unlike plastic behaviour). In elastic bodies, this means that stress is stored until either it is released during recovery, or at the point of failure.


Basic stress-strain relationships for elastic and plastic behaviour (left), and viscous behaviour (right). Note that strength in viscous materials is represented as a strain rate. From multiple sources.

Basic stress-strain relationships for elastic and plastic behaviour (left), and viscous behaviour (right). Note that strength in viscous materials is represented as a strain rate. From multiple sources.

Lithospheric elasticity is one of the more important determinants of sedimentary basin formation; it allows the lithosphere to flex in response to loads. The term “load” applies to stresses that act:

  • Vertically; this includes physically emplaced sediment, volcanic or tectonic loads, plus the loading caused by temperature changes (such as cooling and density increase of oceanic crust), and
  • Horizontally, for example far-field horizontally-oriented stresses adjacent to convergent margins.

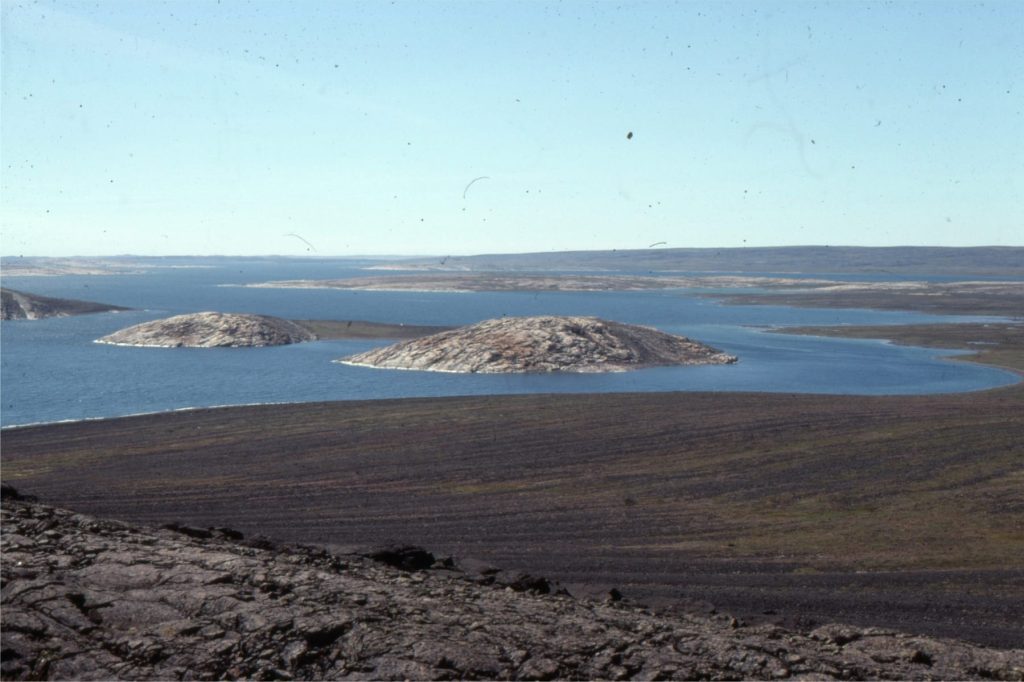
One of the more obvious manifestations of lithospheric flexure is the rebound of landmasses following retreat of large ice sheets. Post-glacial rebound of Belcher Islands in Hudson Bay, close to the centre of the former Laurentide Ice sheet, was a whopping 9-10 m/100 years about 8000 years ago, decreasing to its present rate of about 1 m/100 years. In this case rebound is recorded by spectacular flights of raised beaches, each one abandoned as the landmass rose above sea level.


The staircase of raised beach ridges, over an altitude gain of about 100 m from present sea level, has formed in response to lithospheric rebound following melting of the Laurentide Icesheet. The present rate of uplift is about 1 m/100 years. Tukarak Island, Hudson Bay.

The staircase of raised beach ridges, over an altitude gain of about 100 m from present sea level, has formed in response to lithospheric rebound following melting of the Laurentide Ice sheet. The present rate of uplift is about 1 m/100 years. Tukarak Island, Hudson Bay.

Lithospheric flexure is also the dominant mode of subsidence in foreland and forearc basins where the crust is tectonically loaded by thrust sheets. The amount of flexure, and therefore subsidence is controlled to a large degree by the elastic thickness of the lithosphere – thinner lithosphere will tend to bend more than thicker.


Flexure of an elastic beam resulting from progressive tectonic emplacement of loads (from the right). Deformation can be reversed by removal of the load.

Flexure of an elastic beam resulting from progressive tectonic emplacement of loads (from the right). Deformation can be reversed by removal of the load.

Plastic behaviour

Materials that resist deformation up to a certain yield stress, or yield strength, exhibit plastic behaviour (this is the mechanical context of the term plastic, rather than the more parochial term for things like plastic bags). Deformation beyond the yield strength is permanent.  As is shown on the stress-strain diagram, for an ideal plastic there is no deformation until the critical stress is reached.

In this model, deformation can occur in two ways (Ershov and Stephenson, 2006):

  • Instantaneously and discontinuously as brittle failure, or
  • Continuously as in ductile flow.


Viscous behaviour

Viscosity measures resistance to deformation, specifically that caused by flow. Thus, the dimensional units of measure are Force (in this case shear stress) multiplied by Time, all divided by Area. The standard unit is the poise, or in SI notation, Pascal-seconds (Pa.s).

In common language we usually apply the term viscosity to fluids or liquids, like paint or syrup. We can also apply the term to rocks, but we need to think of rock viscosity in a geological time frame, rather than the time it takes to apply shear stress (i.e. pouring) maple syrup on your pancakes. Some commonly used values of viscosity are listed below: the differences are measured in orders of magnitude (units of Pascal-seconds):

  • Water at 20oC 10-3
  • Maple syrup 10-1
  • Basalt lava 102
  • Granite 1020
  • Mantle 1023
  • Average crust 1025

Viscous deformation is also known as creep. During viscous behaviour, creep begins at the point stress is applied such that strain rate (rate of deformation, or in this case the rate of shear) is a function of stress; i.e. there is no yield strength. Viscous deformation is permanent.


Strength envelopes

The strength of the lithosphere, and therefore its rheological behaviour in response to stress (brittle, ductile, or viscous) is determined primarily by its composition and temperature, both of which change with depth. These variables distinguish crust from upper mantle; for temperature, this is a function of geothermal gradient. This means that, with depth (and location) there will be transitions from one kind of behaviour to another – from brittle to plastic (e.g. ductile), and from ductile to viscous.

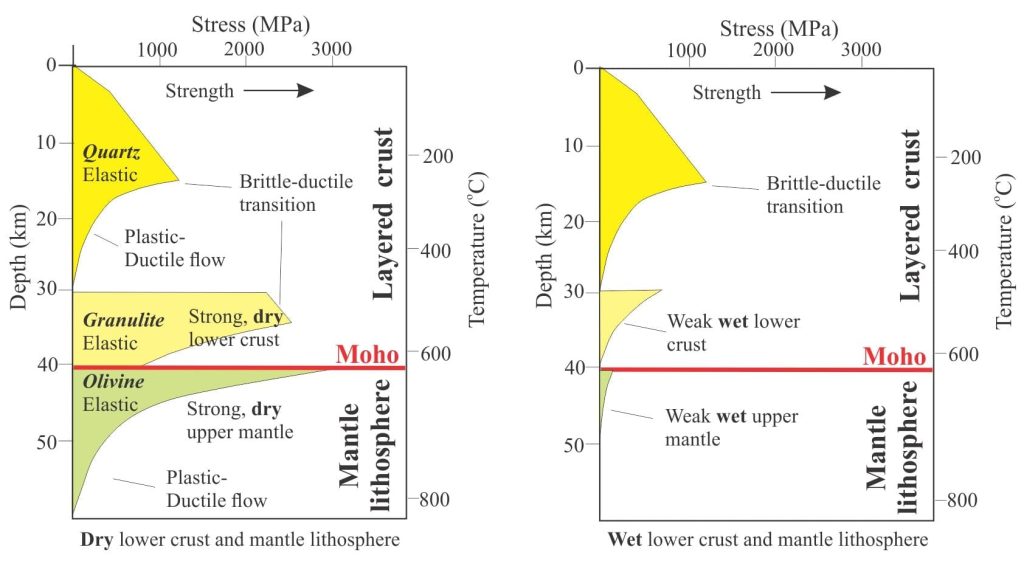
Lithosphere strength is commonly represented diagrammatically as a yield strength envelope (YSE). YSEs can be constructed for oceanic and continental lithosphere, to show how strength varies according to temperature and composition of the crust and mantle lithosphere. The boundaries of each domain represent the point of failure; the rheology within each domain is elastic (Ershov and Stephenson, 2006). These diagrams are an excellent way to portray the rheological changes across the MOHO. They also demonstrate the changes in relative strength when comparing the degree of hydration of crust and uppermost mantle; wet conditions tend to weaken crust and uppermost mantle layers.

The diagram shows the strength envelopes for the upper part of continental lithosphere with a layered crust (modified from Allen and Allen, 2013, Fig. 2.38). The panels show two extremes – one with ‘dry’ lower crust and uppermost lithosphere mantle, the other with both layers hydrated. As noted by Allen x 2 in their commentary, under ‘wet’ conditions both the lower crust and upper mantle lithosphere are very weak, such that lithosphere strength is maintained almost entirely by a strong upper crust.


Typical yield strength envelopes for two sets of conditions in the upper 60 km of continental lithosphere: Left – strong, dry lower crust and mantle lithosphere, where strength is distributed with depth; Right – weak and wet lower crust and mantle lithosphere, where most of the strength is in the upper, brittle crust. Conditions within each envelope promote an elastic response. Beyond the envelopes the response to deformation is ductile. Strength increases to the right. Modified from Allen and Allen, 2013, Fig 2.38.

Typical yield strength envelopes for two sets of conditions in the upper 60 km of continental lithosphere: Left – strong, dry lower crust and mantle lithosphere, where strength is distributed with depth; Right – weak and wet lower crust and mantle lithosphere, where most of the strength is in the upper, brittle crust. Conditions within each envelope promote an elastic response. Beyond the envelopes the response to deformation is ductile. Strength increases to the right. Modified from Allen and Allen, 2013, Fig 2.38.

Some generalisations

It is reasonably straight forward to define the three rheological models but applying them to the lithosphere-asthenosphere adds a different level of complexity. As a general rule we can think of the upper crust as responding elastically to the point of brittle failure, the lower crust and upper mantle as a transition from elastic to plastic behaviour (e.g. ductile flow), and the asthenosphere as viscous (which permits convective flow). However, complications with this simple story arise if, for example, the crust is layered, and again if the lower crust is dry (generally stronger) or wet (weaker). Through any section of lithosphere all three processes will operate simultaneously. The depth at which each process acts also varies laterally, depending on factors such as geothermal gradients and changes in composition.


Topics in this series

Sedimentary basins: Regions of prolonged subsidence

Defining the lithosphere

Isostasy: A lithospheric balancing act

Classification of sedimentary basins

Stretching the lithosphere: Rift basins

Nascent conjugate, passive margins

Basins formed by lithospheric flexure

Accretionary prisms and forearc basins

Basins formed by strike-slip tectonics

Allochthonous terranes – suspect and exotic

Source to sink: Sediment routing systems

Geohistory 1: Accounting for basin subsidence

Geohistory 2: Backstripping tectonic subsidence
 

Related topics

Crème brûlée, jelly sandwich, and banana split; the manger a trois of layered earth models

The sea level equation

Sea level change: busting a few myths

The thermal structure of the lithosphere


Facebooktwitterlinkedininstagram
Facebooktwitterlinkedin