
Local shoreface ravinement along part of the Galveston coast (Texas) is eroding older salt marsh-lagoonal muds as the shoreline migrates landward. The resulting stratigraphy will eventually place tidal flat and local shoreface ravinement along part of the Galveston coast (Texas) is eroding older salt marsh-lagoonal muds as the shoreline migrates landward. The resulting stratigraphy will eventually place shoreface and tidal flat sands over whatever is left of the mud facies.
Outcrop expression of maximum regressive, maximum flooding, and ravinement surfaces
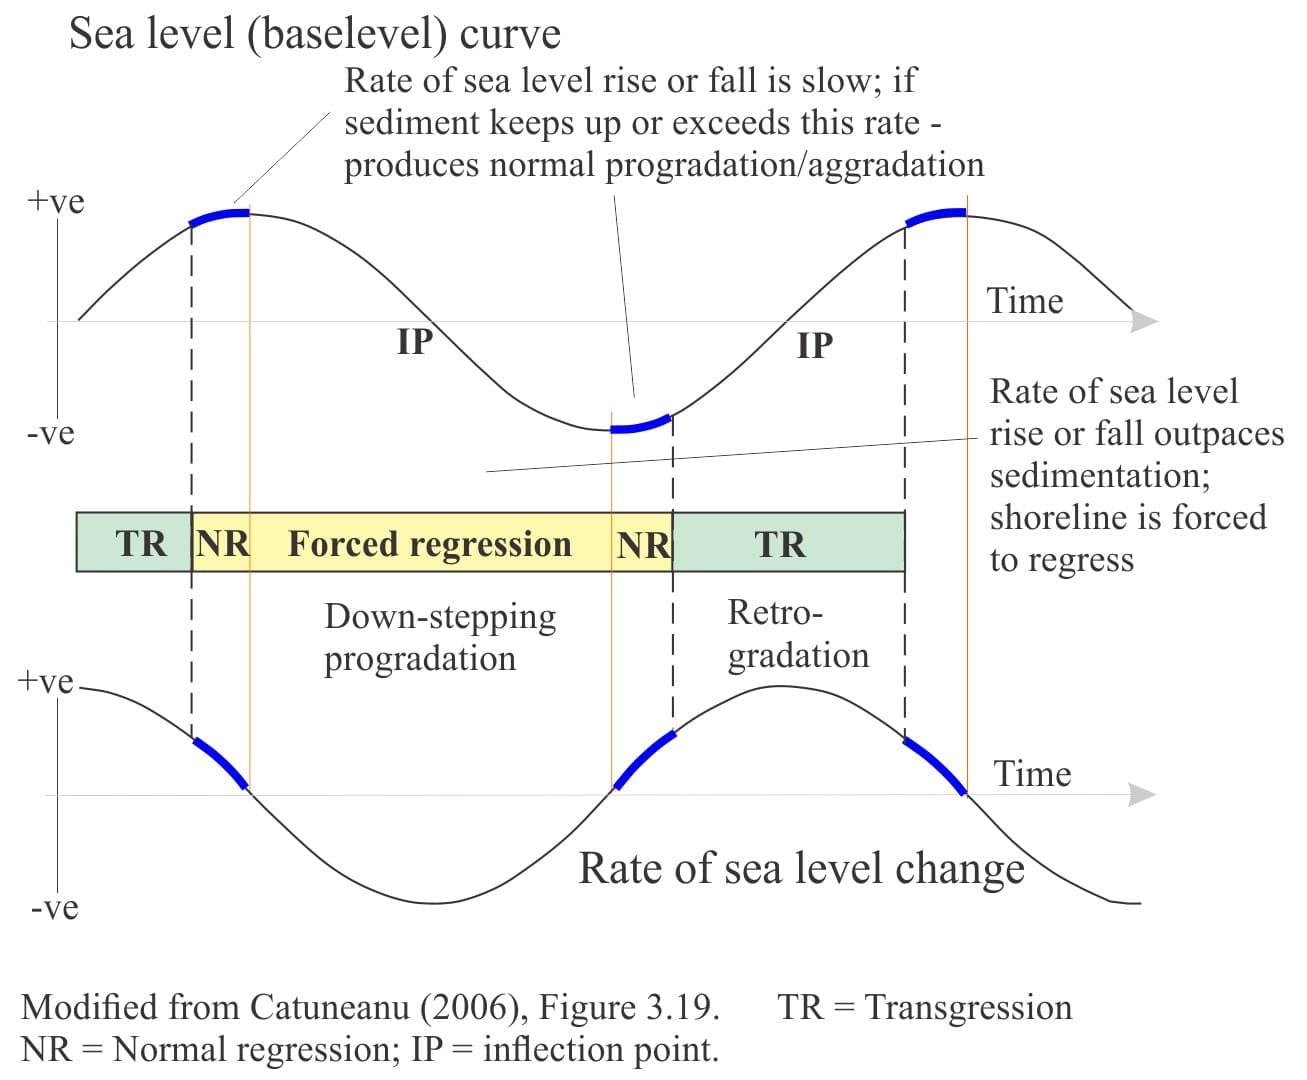
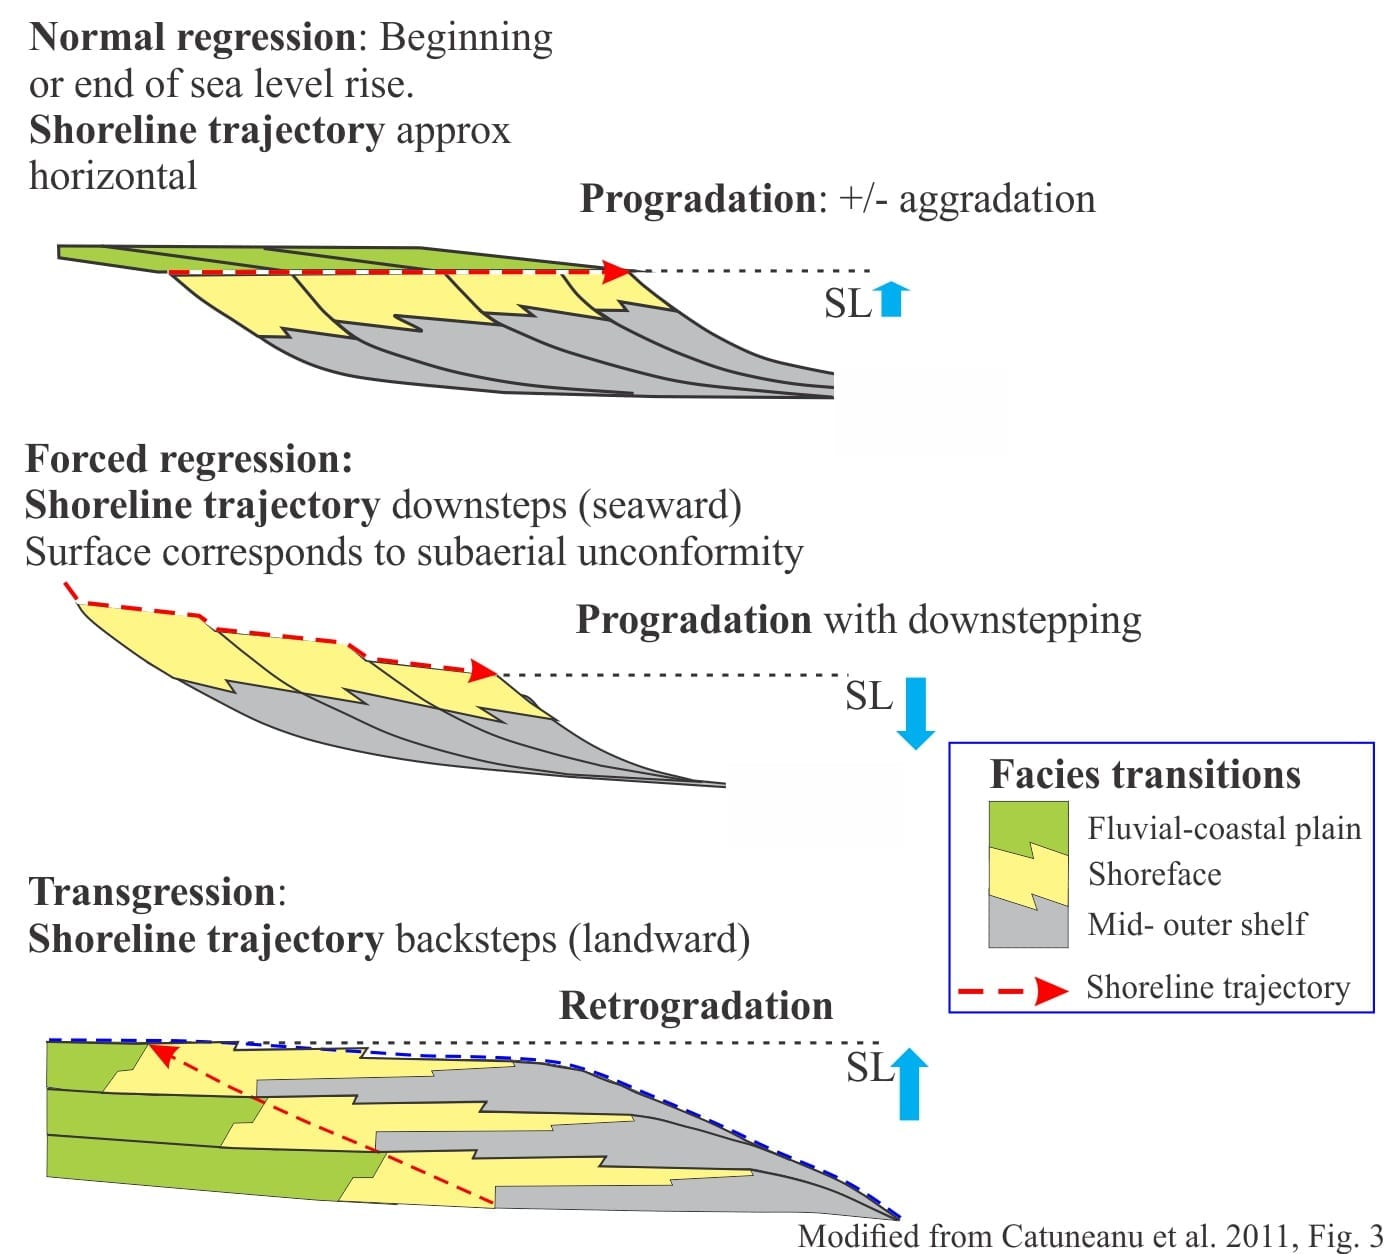
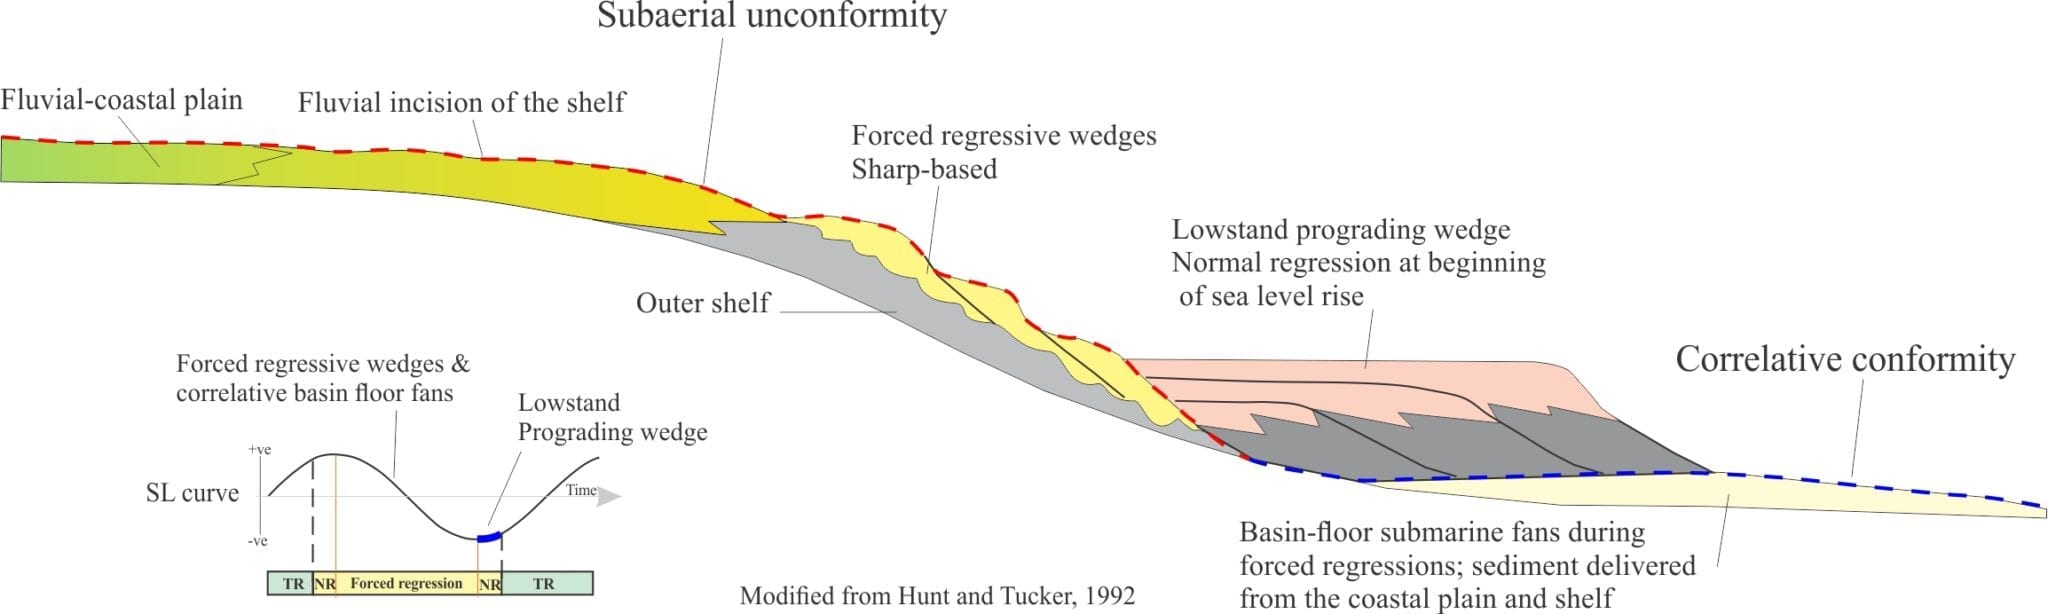
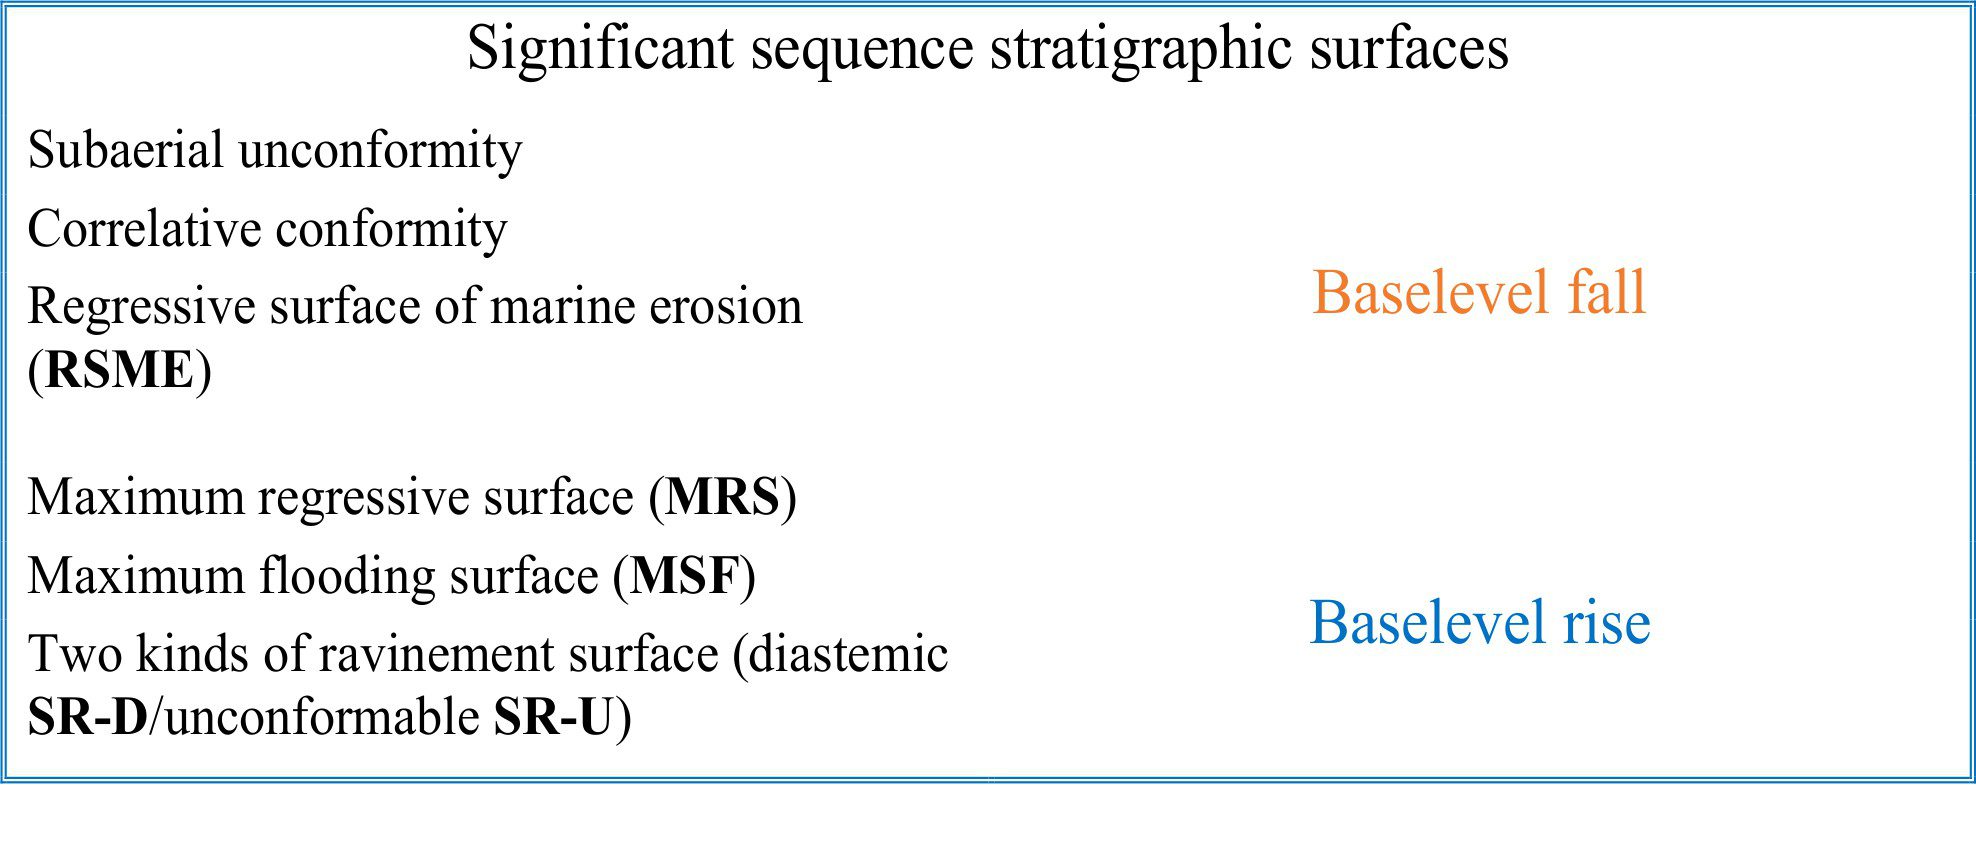
Six stratigraphic surfaces define the important boundaries of stratigraphic sequences and their system tracts. The significance of these surfaces in sequence stratigraphy is based on a model of baselevel change, a model that, in turn is based on interpretation of facies and stratigraphic trends, experimental studies (e.g., flumes), theoretical considerations, and numerical simulations. The baselevel model dictates that surfaces develop as a function of changes in sediment accommodation and supply, migrating shorelines, and the consequent shifts in environmental conditions.

A schematic representation of the baselevel model that makes a bold statement about shoreline trajectories and stratigraphic trends in terms of accommodation space and sediment supply.
The diagnostic criteria for recognition of these surfaces in outcrop and core are based on sedimentary, bio-, and chemical facies and, if the exposure is panoramic, bed geometries such as onlap and offlap.
Five of these surfaces are included here; there are no criteria that ensure definitive identification of correlative conformities in outcrop. These are best identified on seismic profiles where reflections can be traced from the shelf or platform to the deeper basin.
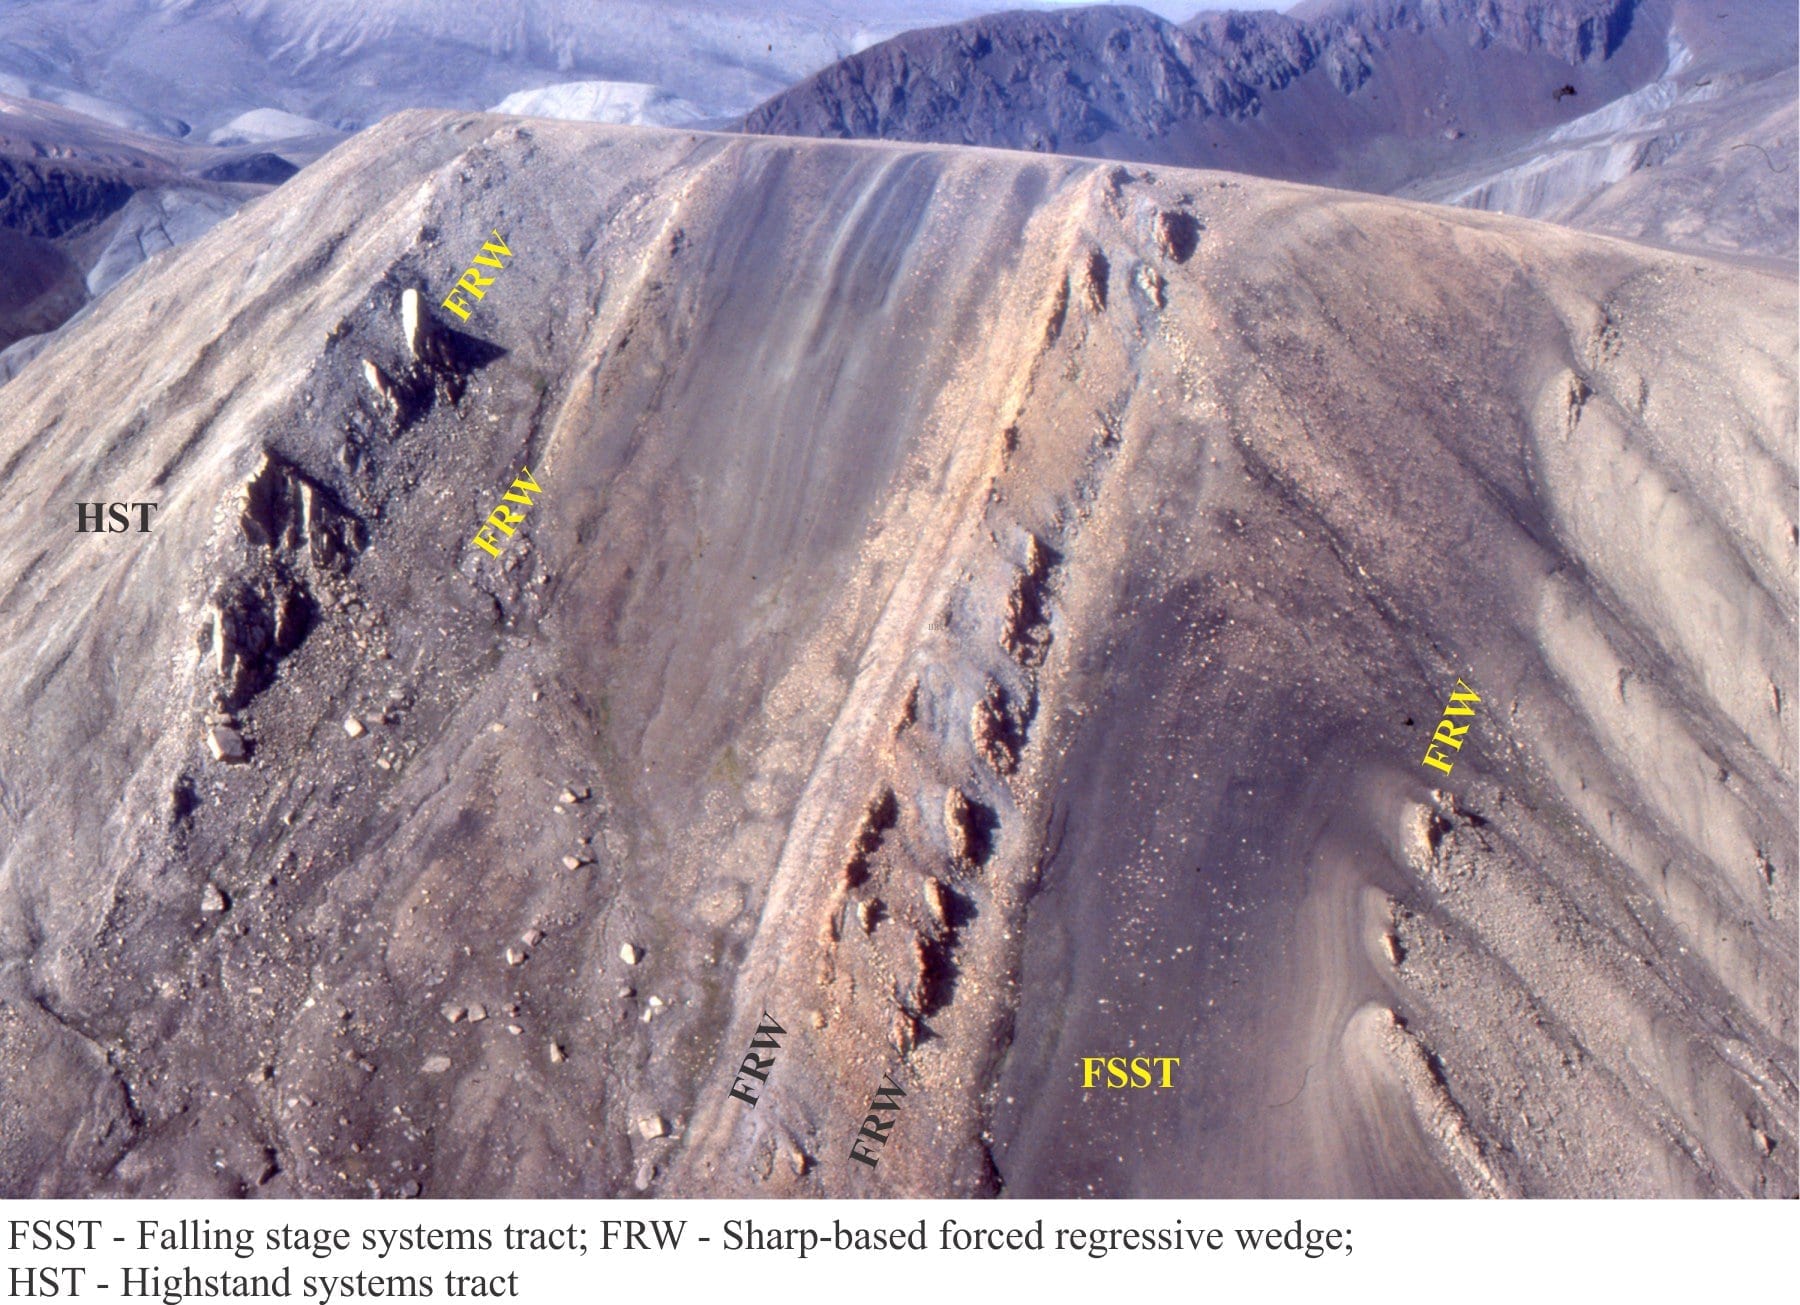
A companion article looks at sequence stratigraphic surfaces formed during baselevel fall.
Several Sverdrup Basin images here and in the companion post on Falling baselevel have been generously donated by Ashton Embry. Some key references are added at the bottom of the page.
Maximum Regressive surface
The maximum regressive surface (MRS – also called the transgressive surface) forms when baselevel fall and the shoreline trajectory turn around and transgression begins. It represents the transition from progradation to retrogradation where baselevel rise is faster than sediment supply. These conditions dictate widespread changes in the dynamics of sedimentation such that the MRS may extend from the shelf to coastal and fluvial environments (because all these environments are potentially affected). Below the shoreface the MRS will be conformable; closer to the shoreline the surface may be scoured locally. The MRS is overlain by transgressive stratigraphy that usually terminates in a maximum flooding surface. However, the MRS may be removed during transgression depending on the depth of erosion beneath the shoreface ravinement surface.
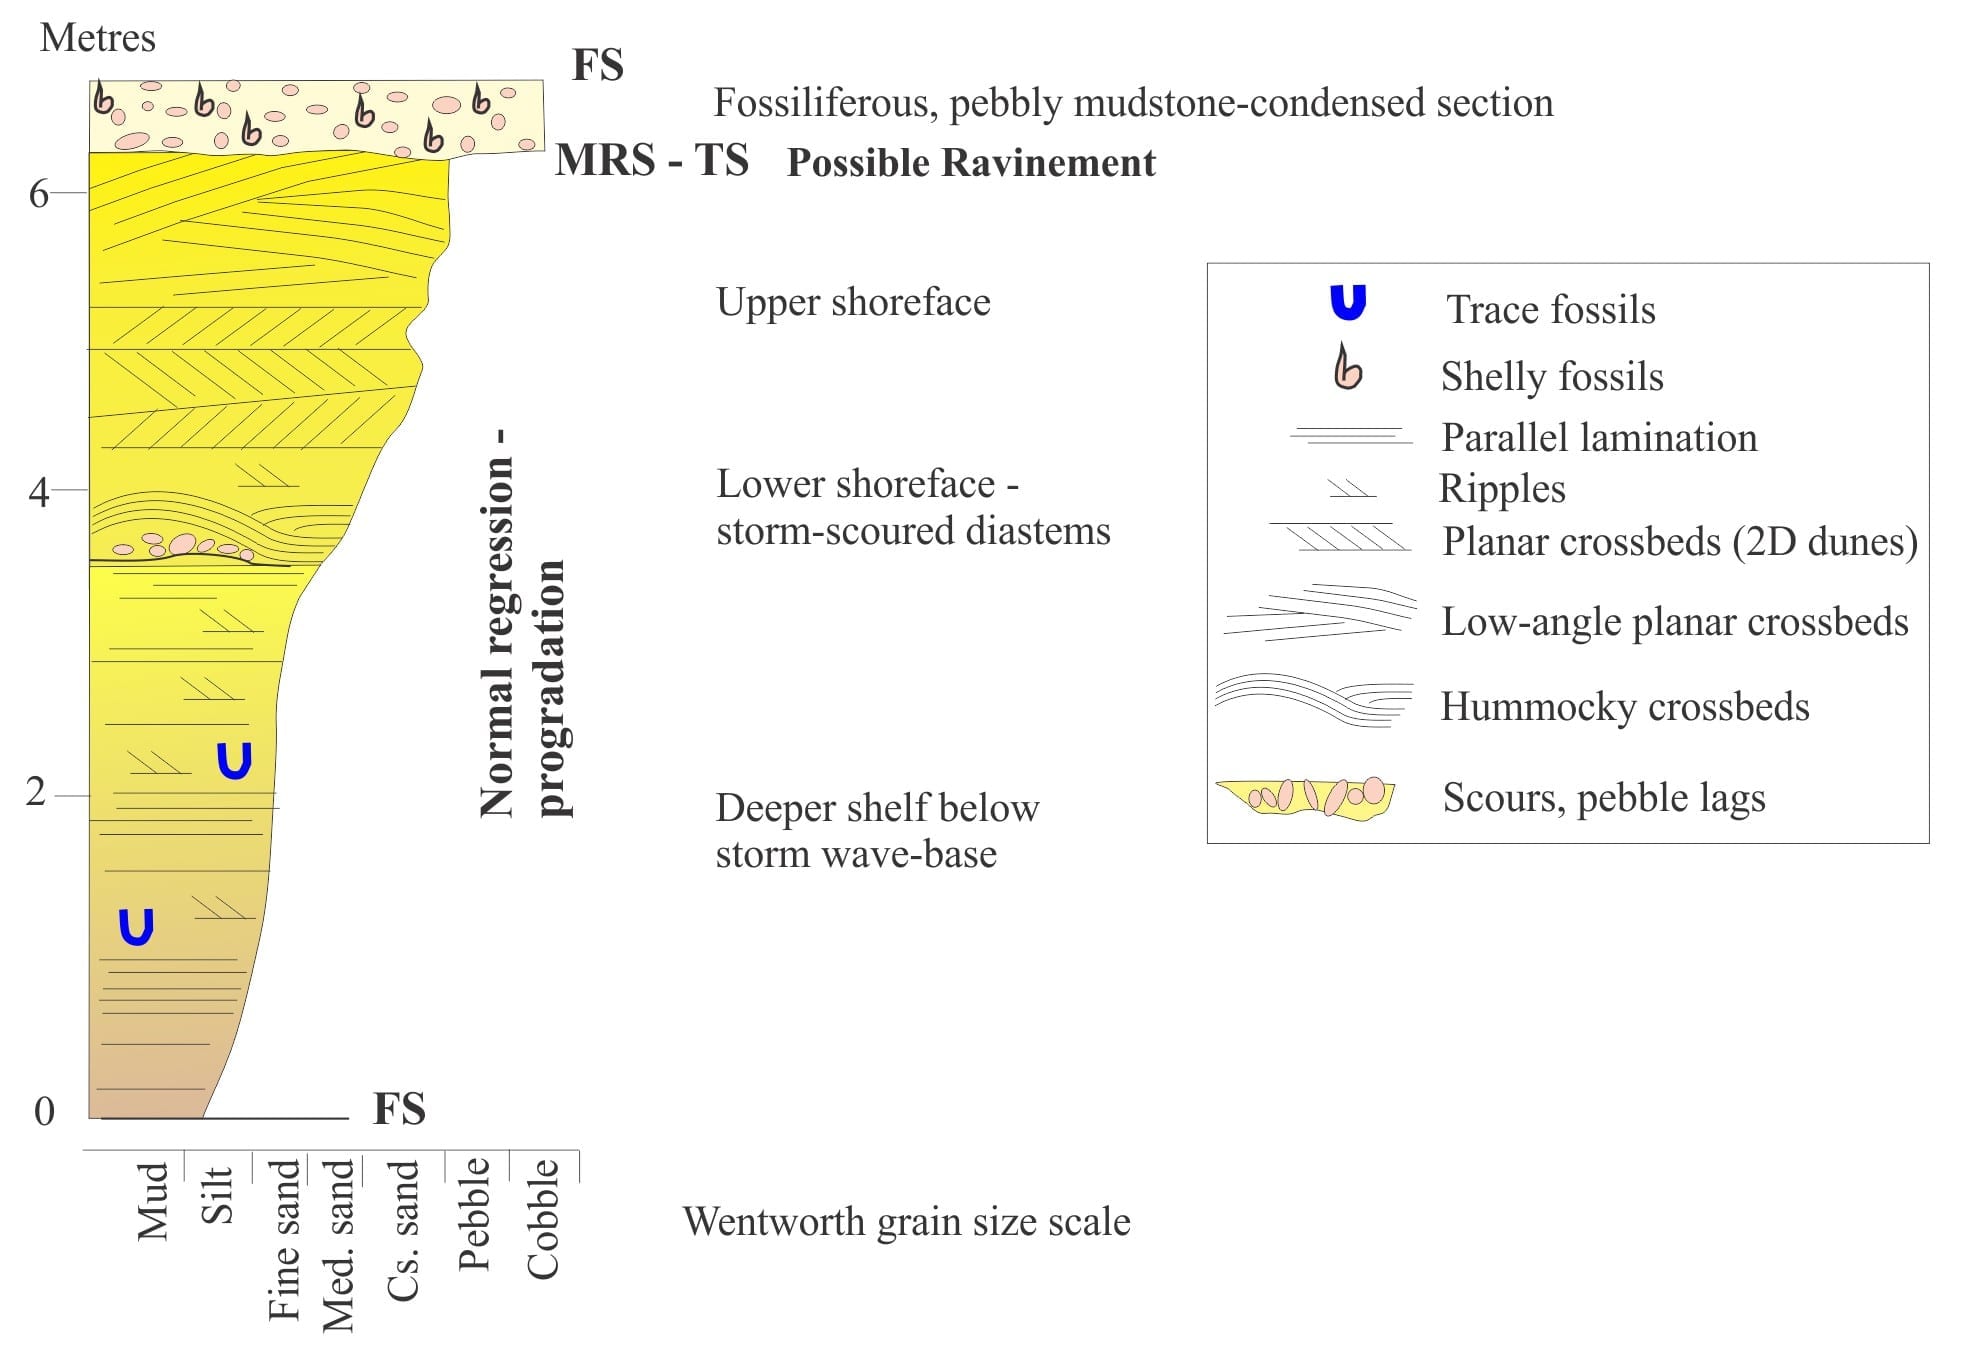
In outcrop the MRS will tend to overlie coarsening-upward shelf-shoreface deposits (this is where it has the highest preservation potential). It will also overlie lowstand deposits if they are preserved. The succession between the MRS and maximum flood surface will also be condensed if sedimentation rates are low.
Bowser Basin, northern British Columbia

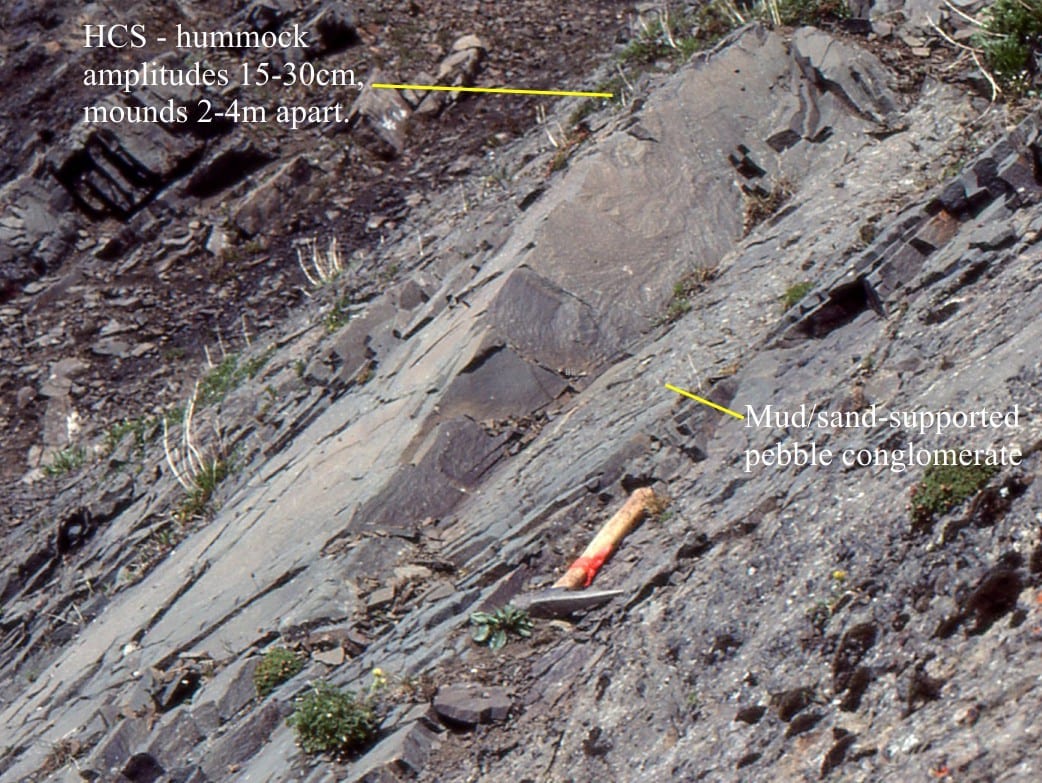
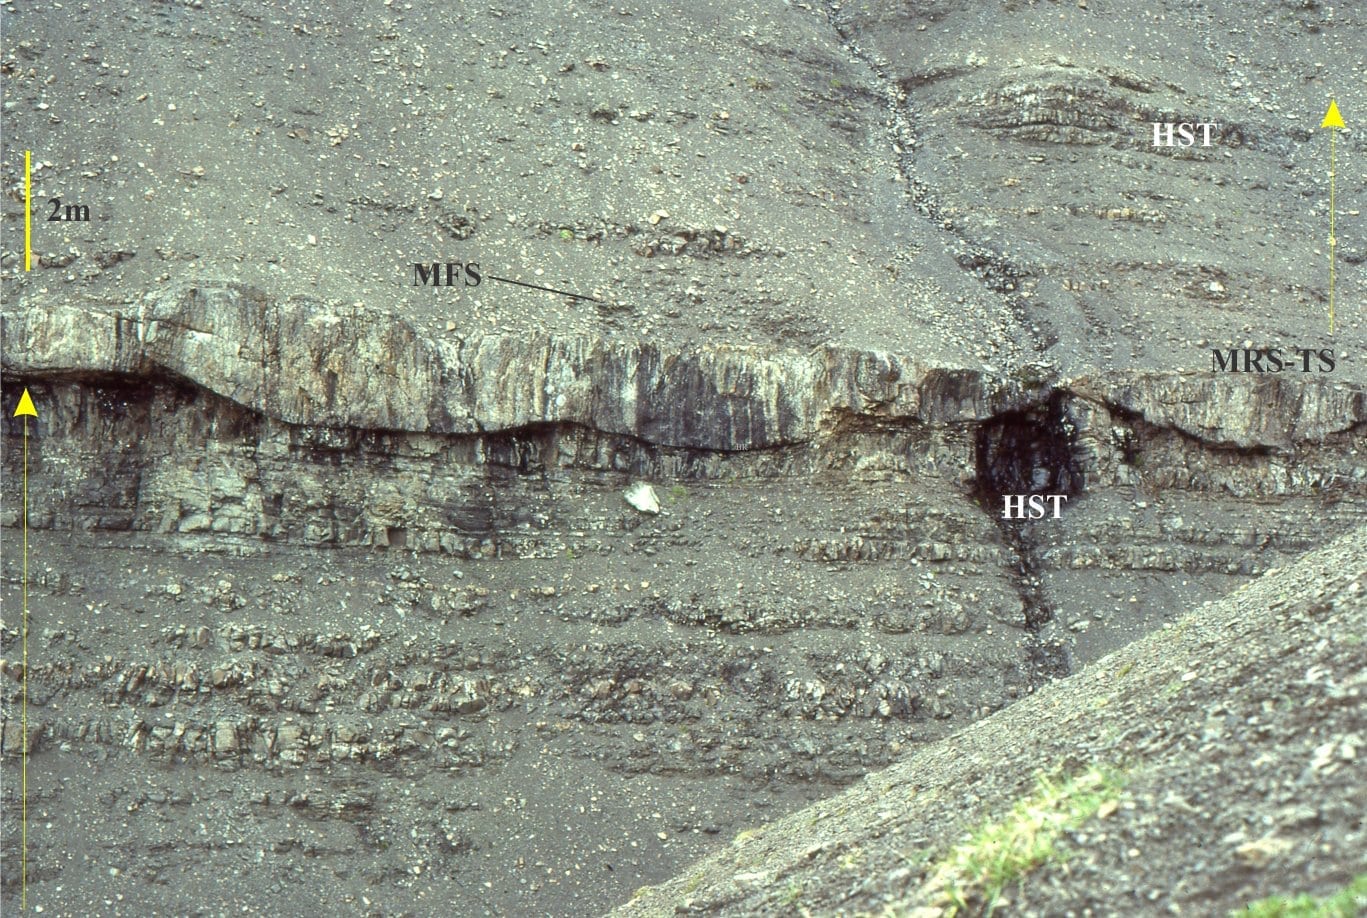
Coarsening-upward shelf cycles (yellow arrows), each beginning with an MRS that signals the start of baselevel rise. The top of the upper cycle is truncated by fluvial, possibly tidal channels that eroded the normal regressive deposits on the exposed shelf – these are interpreted as lowstand channels. They contain abundant trough crossbeds in pebbly sandstone. The channels are overlain by a fossiliferous, pebbly sandstone, the base of which is the MRS, that in turn is overlain by thin, calcareous siltstone, the top of which is the MFS. Details of these surfaces are shown below. Jurassic Bowser Basin, northern British Columbia.
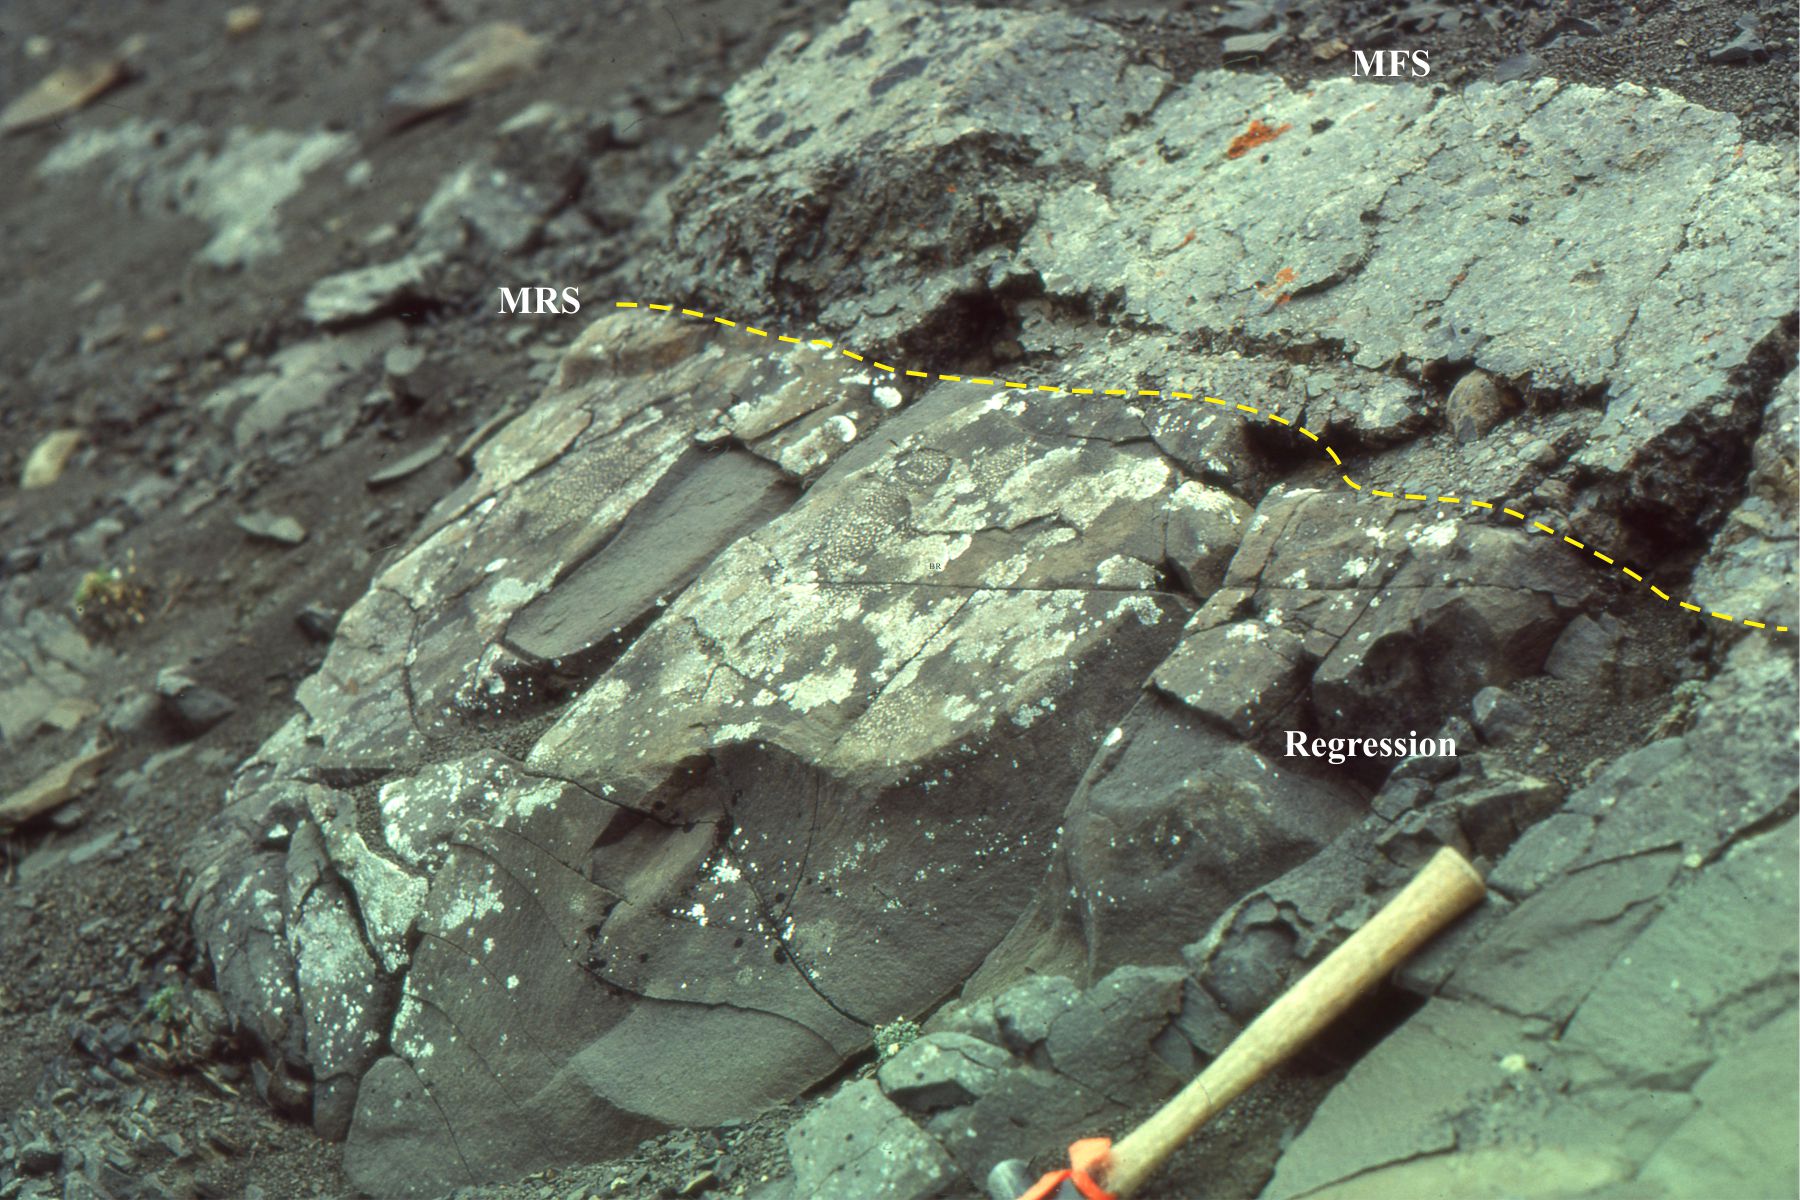
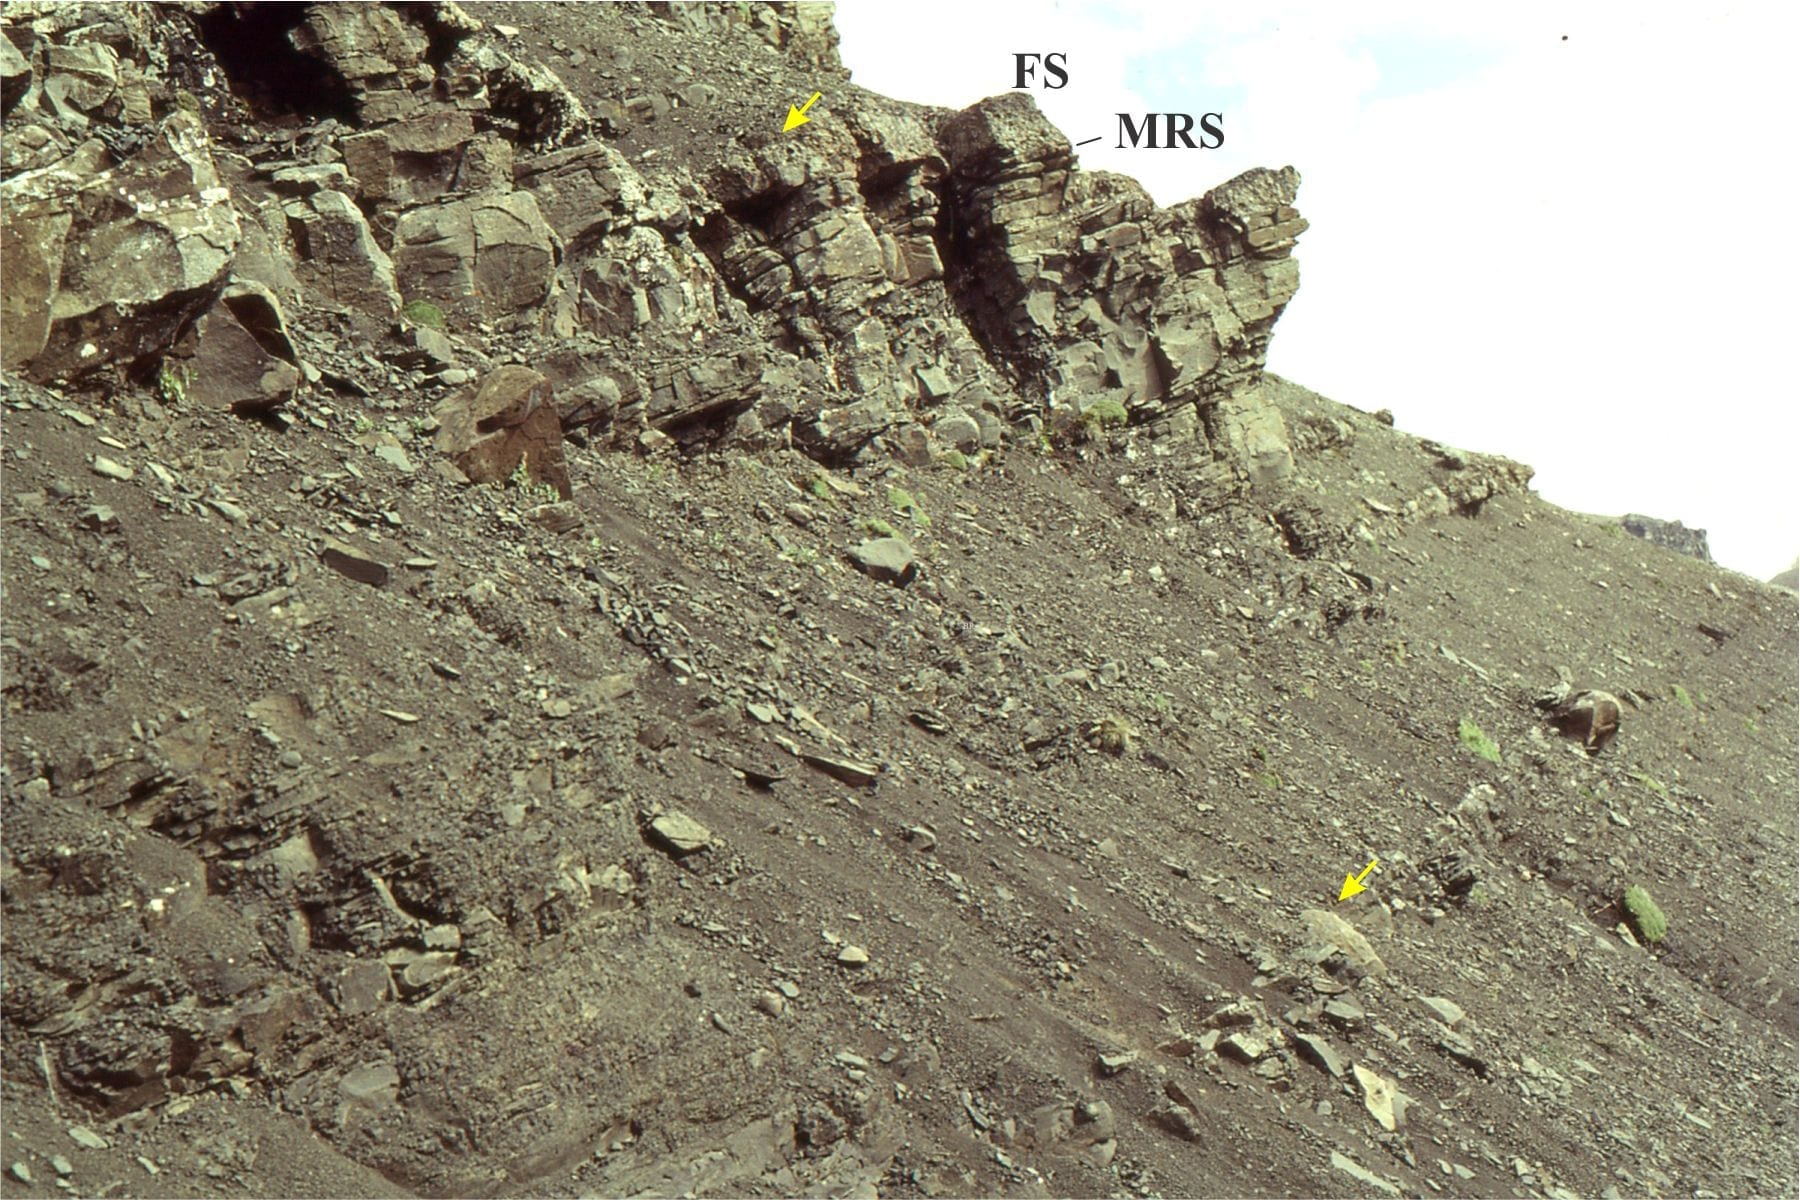
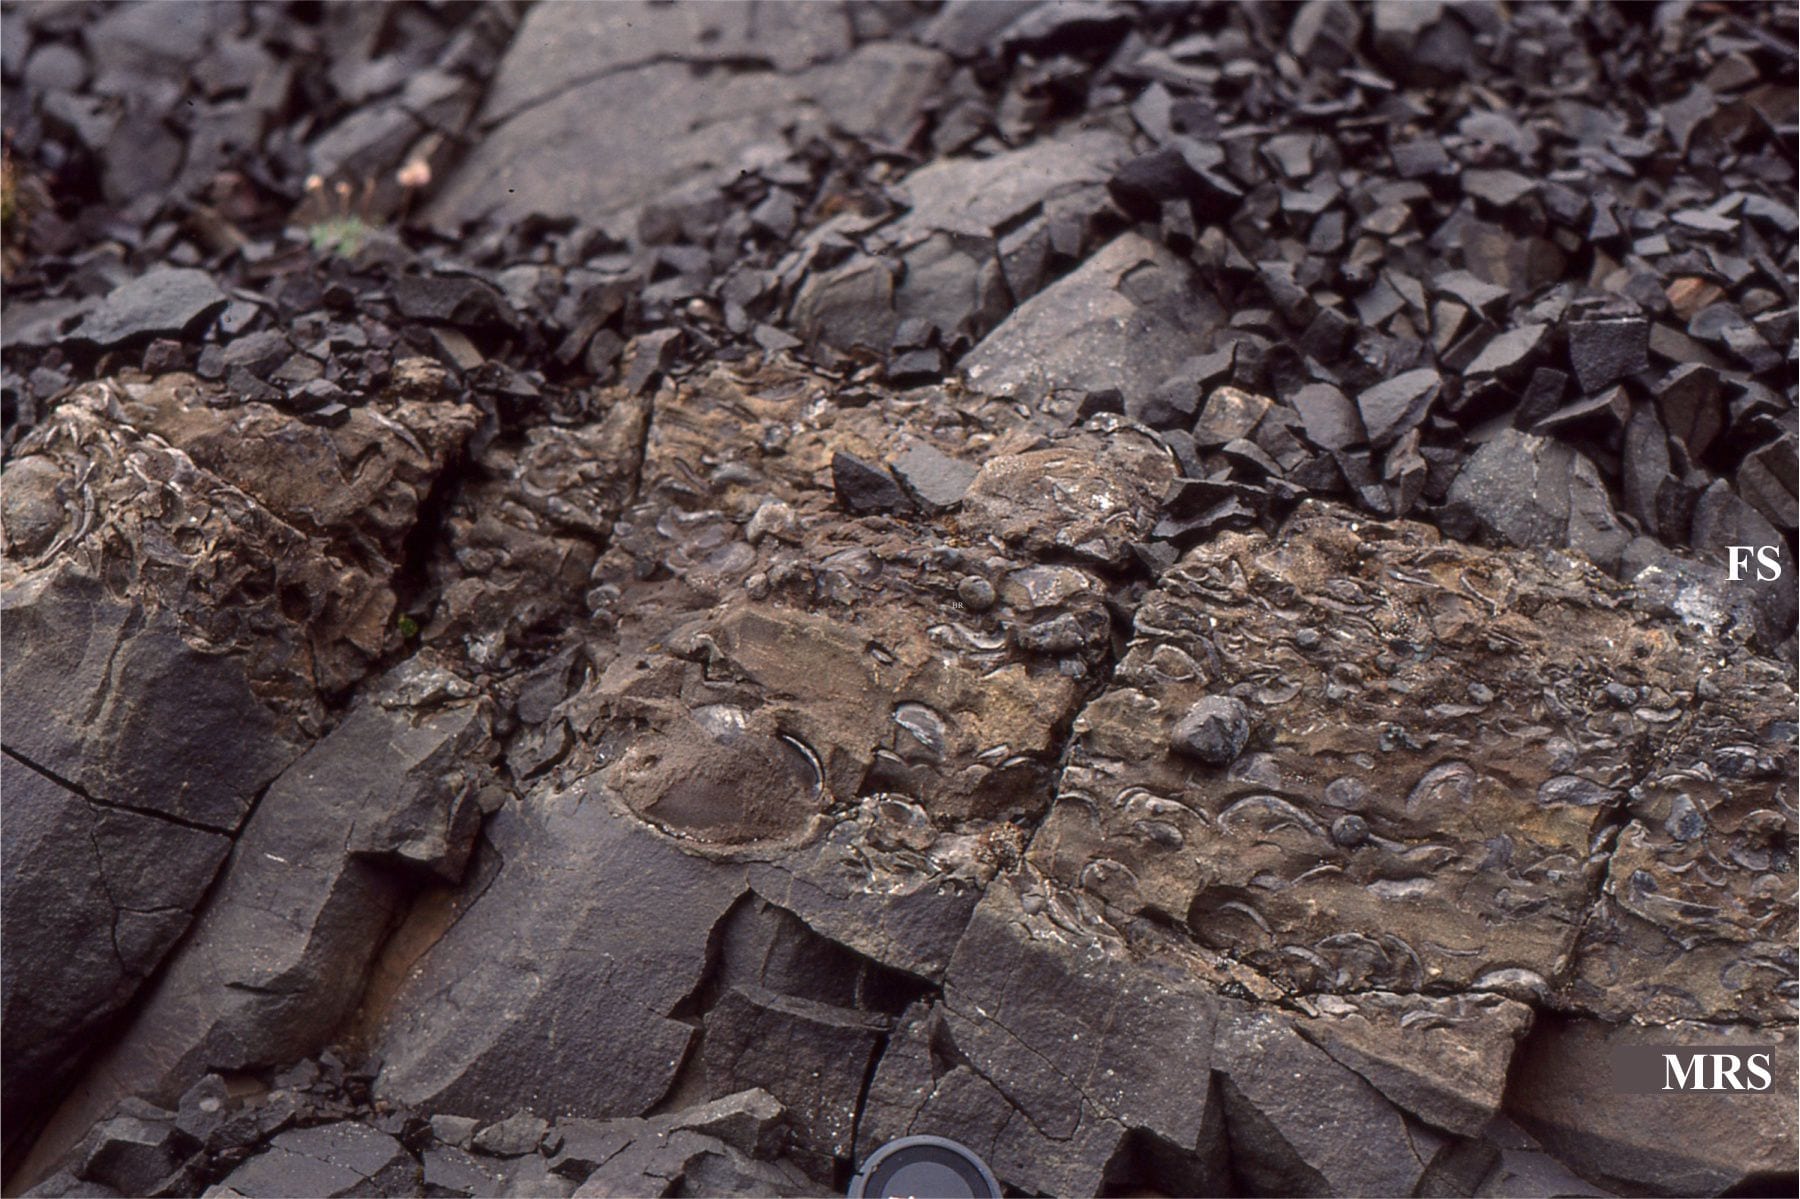
Crossbedded sandstone (at the hammer), deposited during regression, is overlain by a pebbly mudstone (dashed line) that contains abundant whole and broken bivalves, gastropods, ammonites, and encrusting bryozoa; this is the maximum regressive surface, the record of baselevel rise. The pebbly bed is conformably overlain by calcareous siltstone that in turn is overlain by shale and thin sandstone beds that form the basal part of the next coarsening-upward regressive package. The top of the calcareous siltstone is a maximum flooding surface (the end of transgression – the condensed stratigraphy between the MRS and MFS is the stratigraphic record of transgression. Jurassic, Bowser Basin, northern British Columbia.
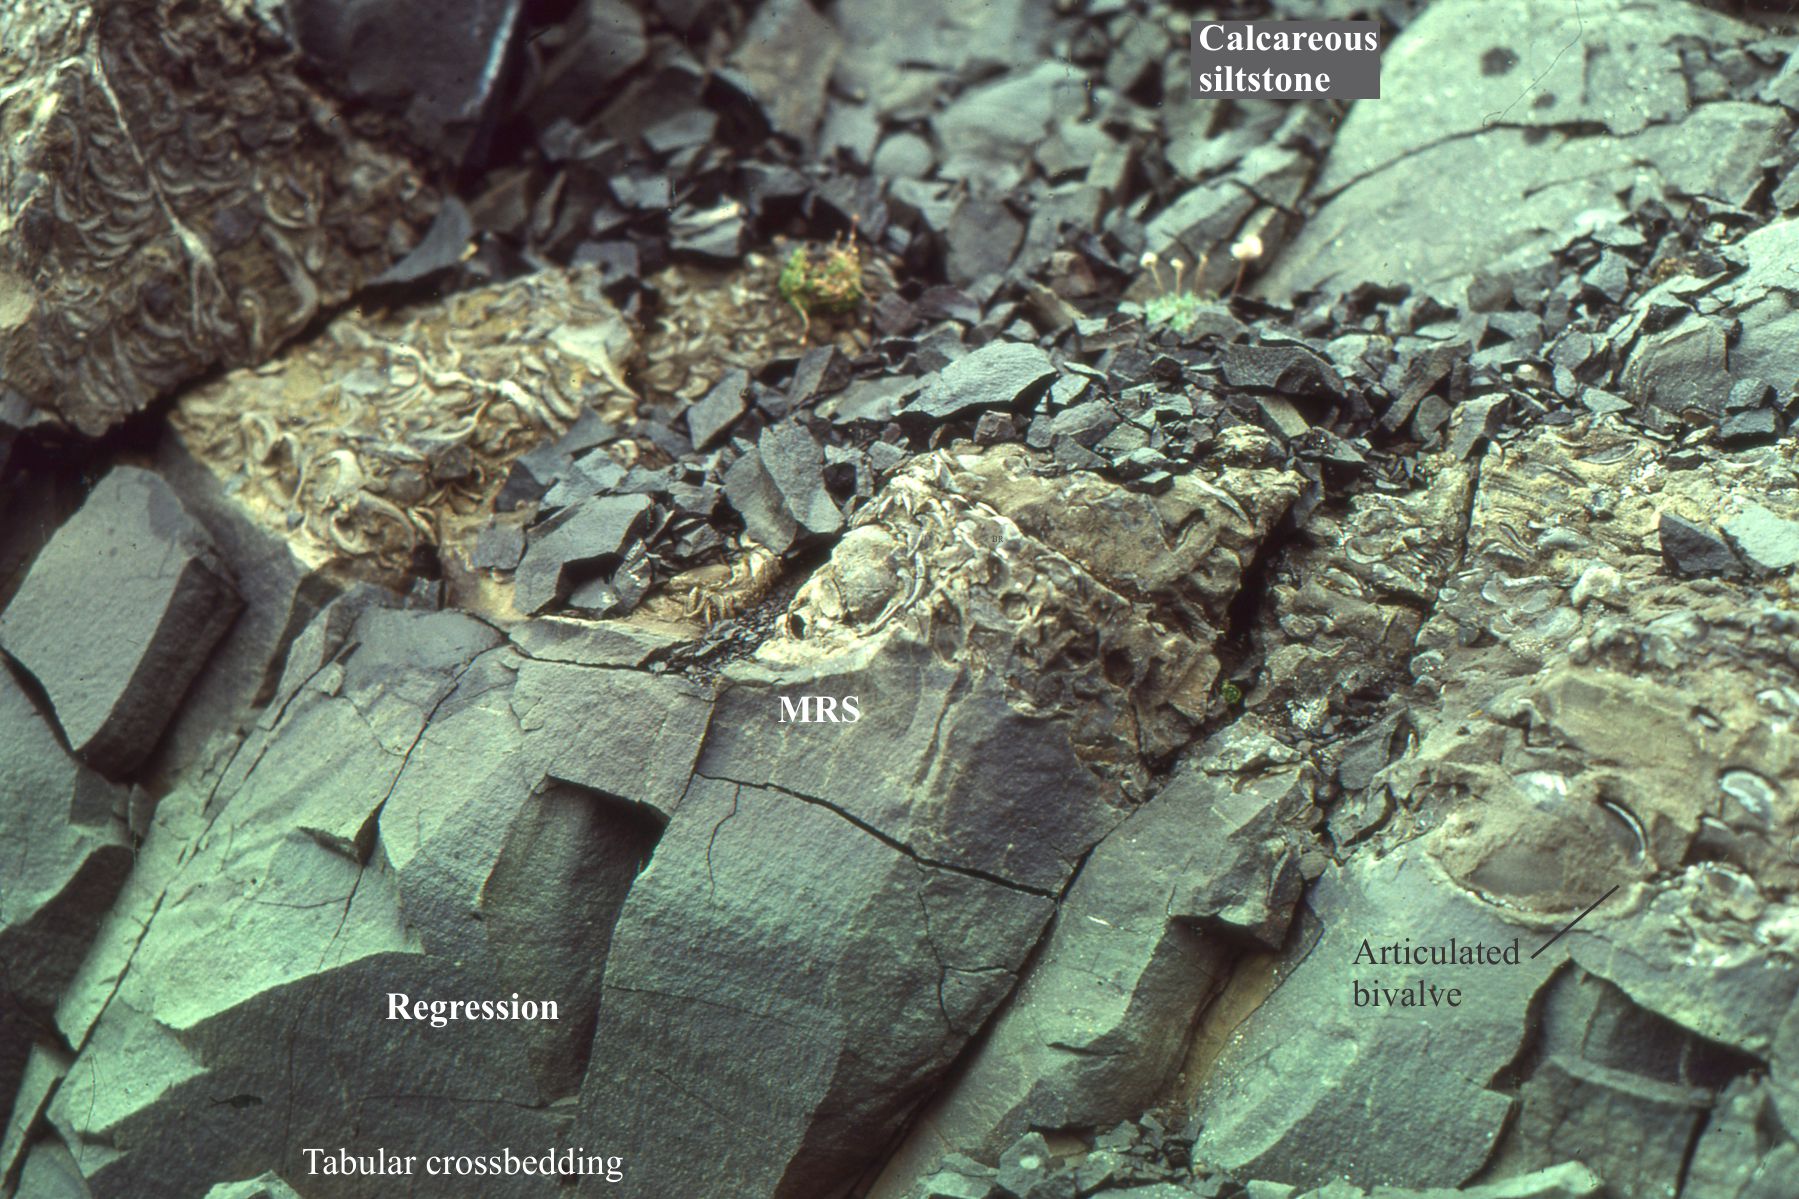
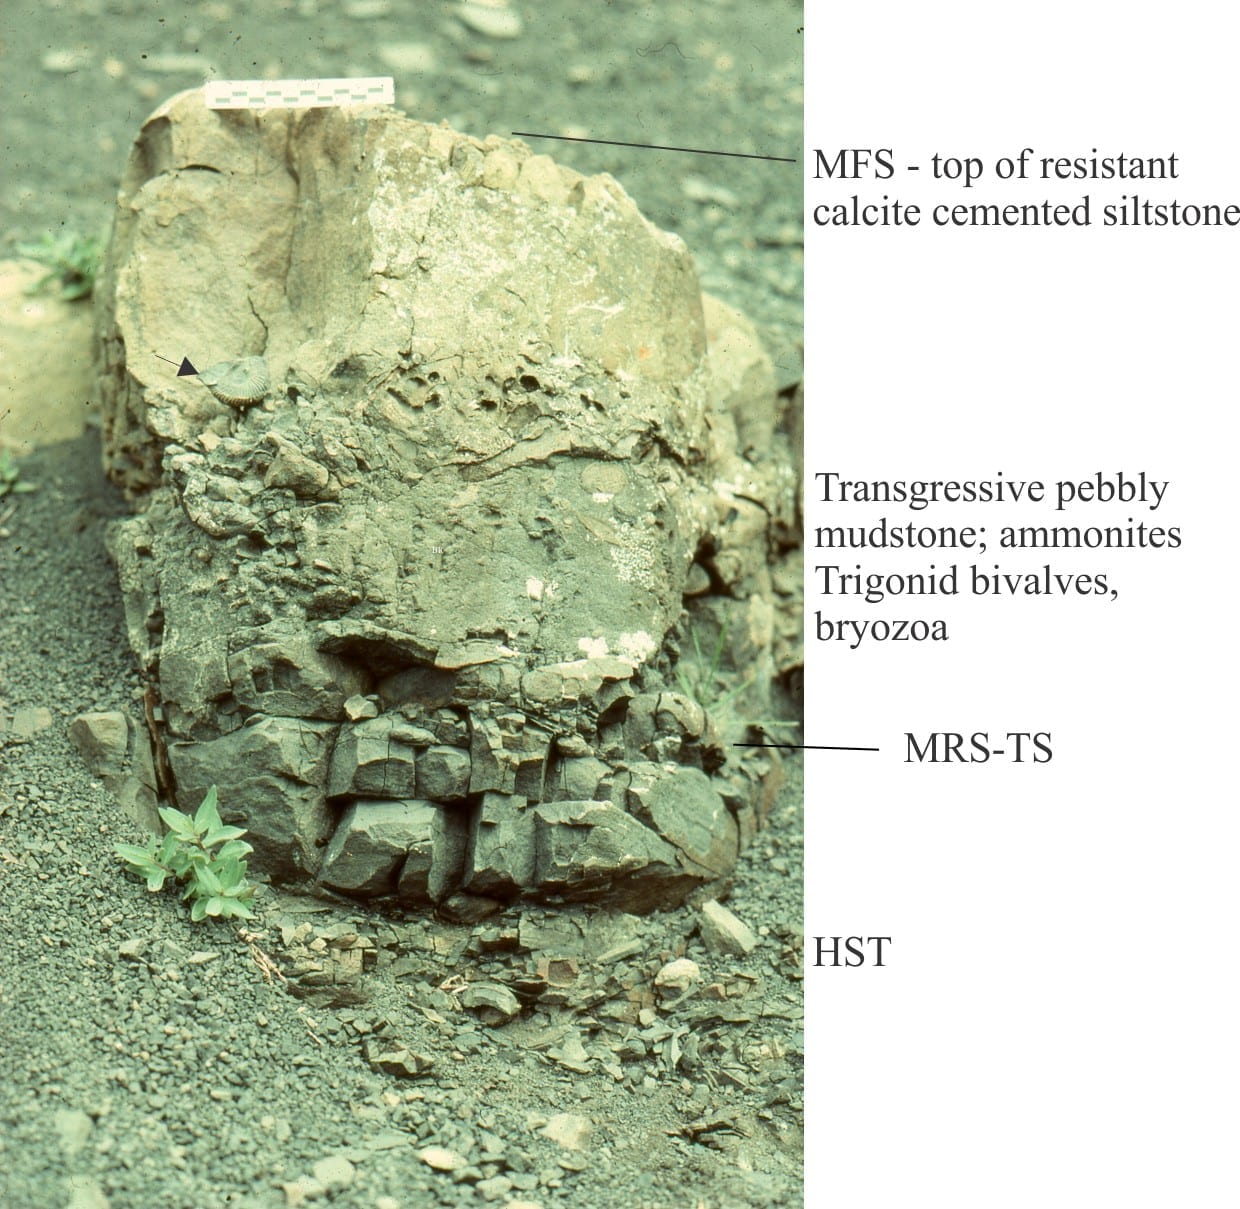
A closer look at the regressive – MRS contact and the calcareous, pebbly mudstone-siltstone (the basal part of a condensed, transgressive package). Many of the fossil molluscs are intact; the bivalves are articulated and encrusted by bryozoa, indicating minimal reworking across the sea floor. Their abundance signals very low sedimentation rates during transgression. The pebbly mudstone is overlain by calcareous siltstone that is part of the transgressive package, overlain abruptly but conformably by coarsening-upward shale-sandstone – the contact is the maximum flooding surface (just out of the picture). Jurassic, Bowser Basin, northern British Columbia.
Sverdrup Basin, Arctic Canada
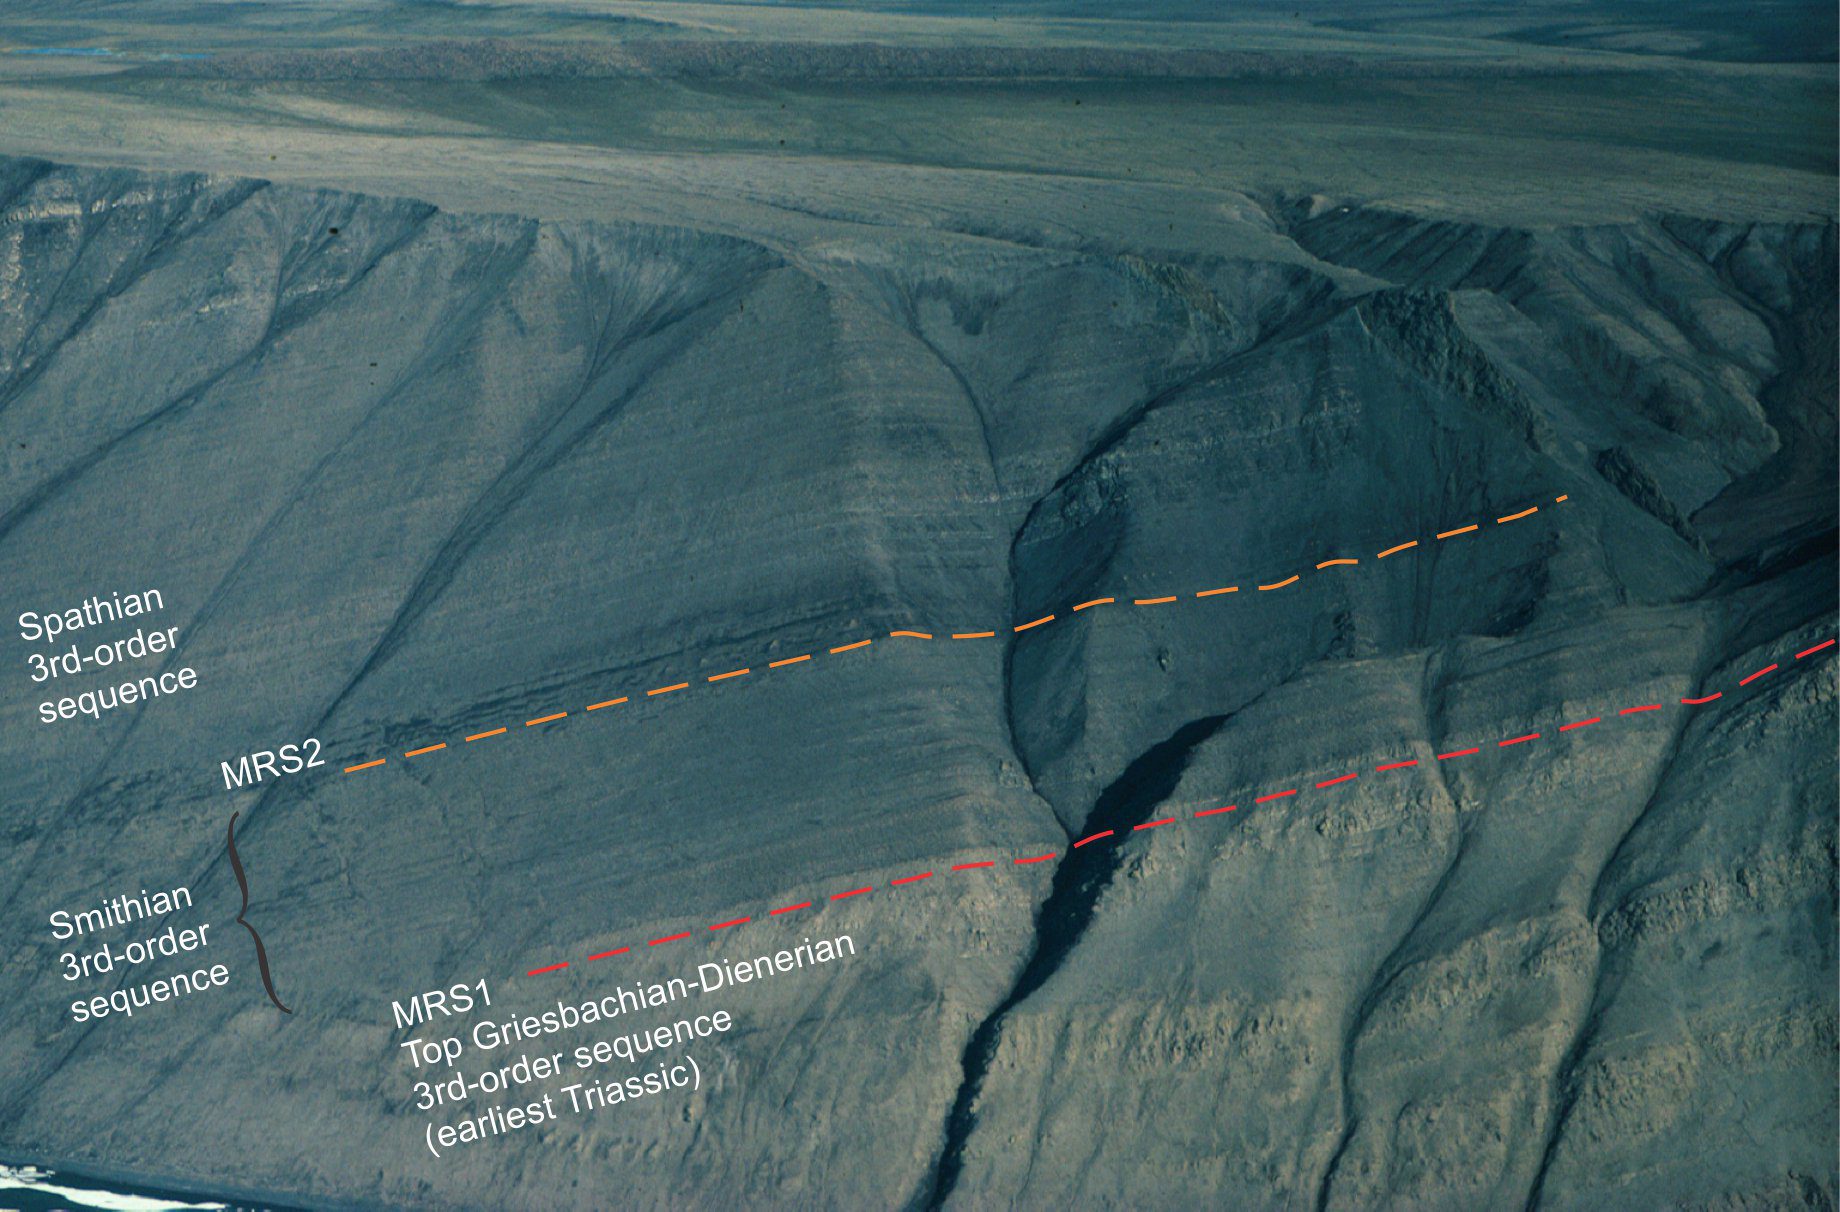
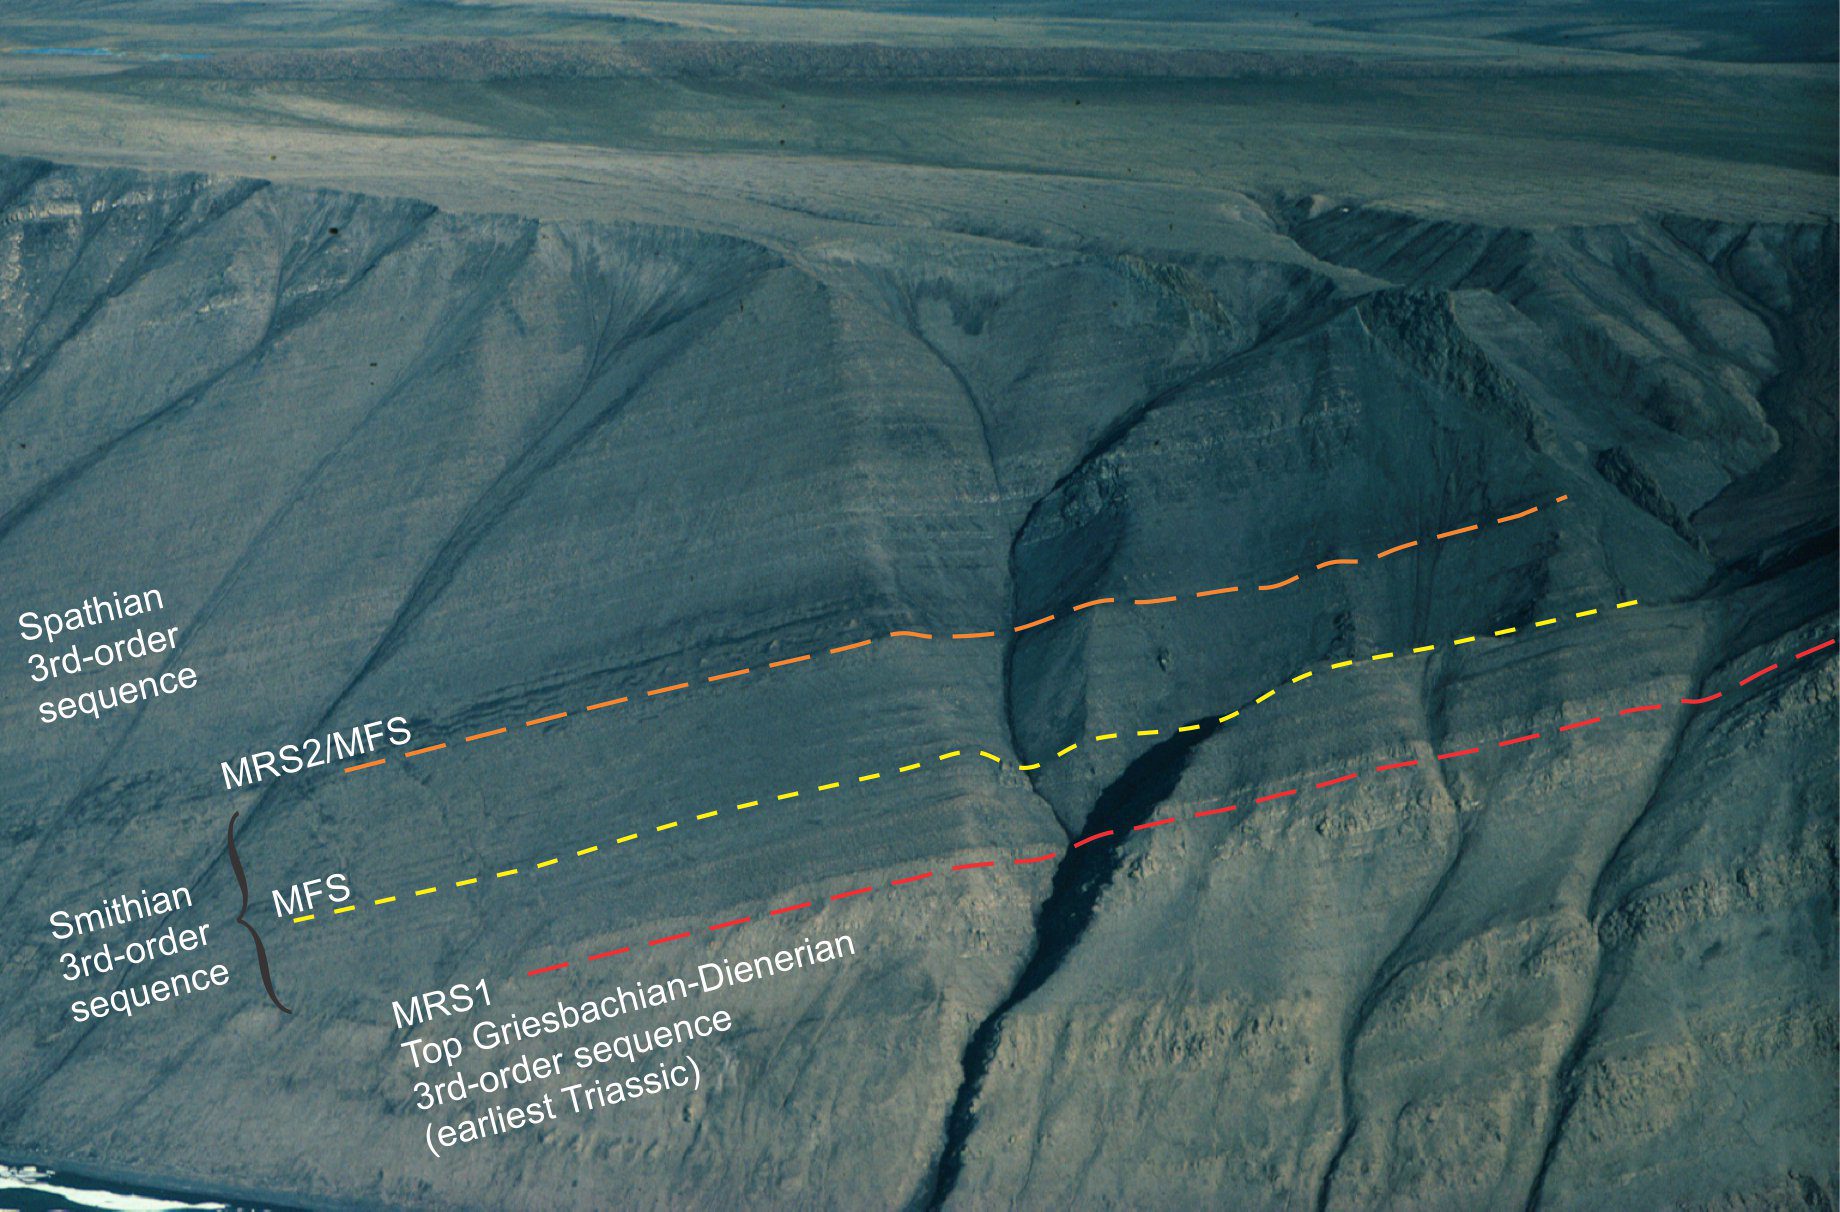
A panoramic view of maximum regressive surfaces for three 3rd-order sequences in the Lower Triassic Blind Fiord Fm, Sverdrup Basin. MRS1 is placed where sandstone beds become finer grained and contain more intense bioturbation than sandstones below the MRS. The decrease in sediment supply provided greater opportunities for grazing-burrowing critters on the sea floor. Although the MRS1 signals a shift in baselevel and a reduction in sediment supply, sand remaining in residence across the shelf is still available for reworking and deposition. The cessation of sand supply is marked by the relatively abrupt sandstone-shale contact immediately above the MRS1. MRS1 signals the end of the Griesbachian-Dienerian sequence, and the beginning of the shale-dominated Smithian sequence. MRS2 signals the end of the Smithian sequence and the beginning of the Spathian sequence. Smith Cliffs, Sverdrup Basin. Image courtesy of Ashton Embry.
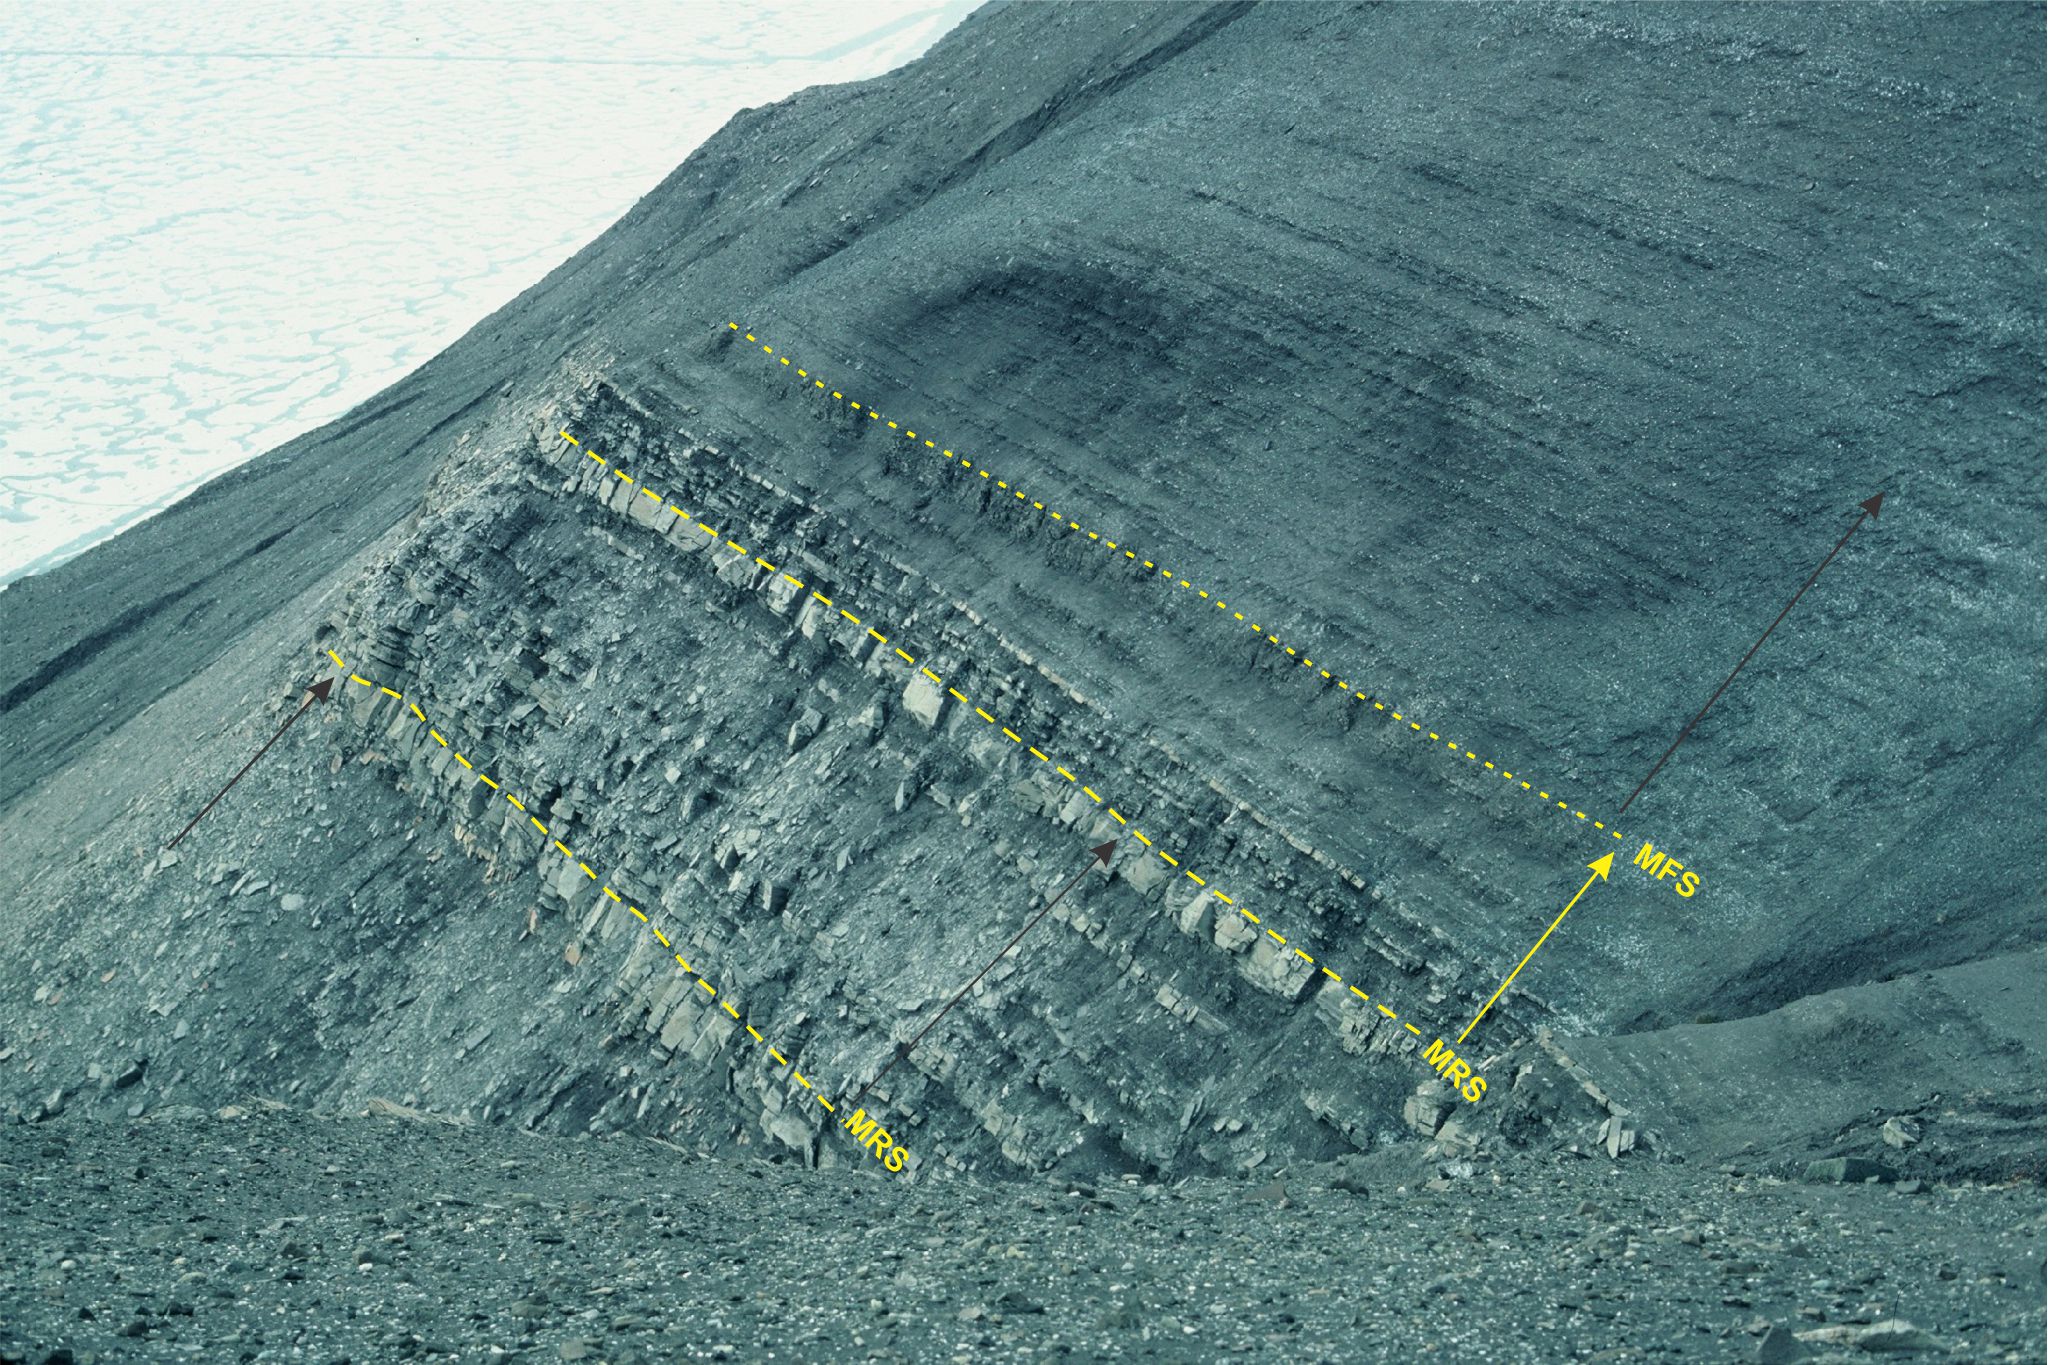
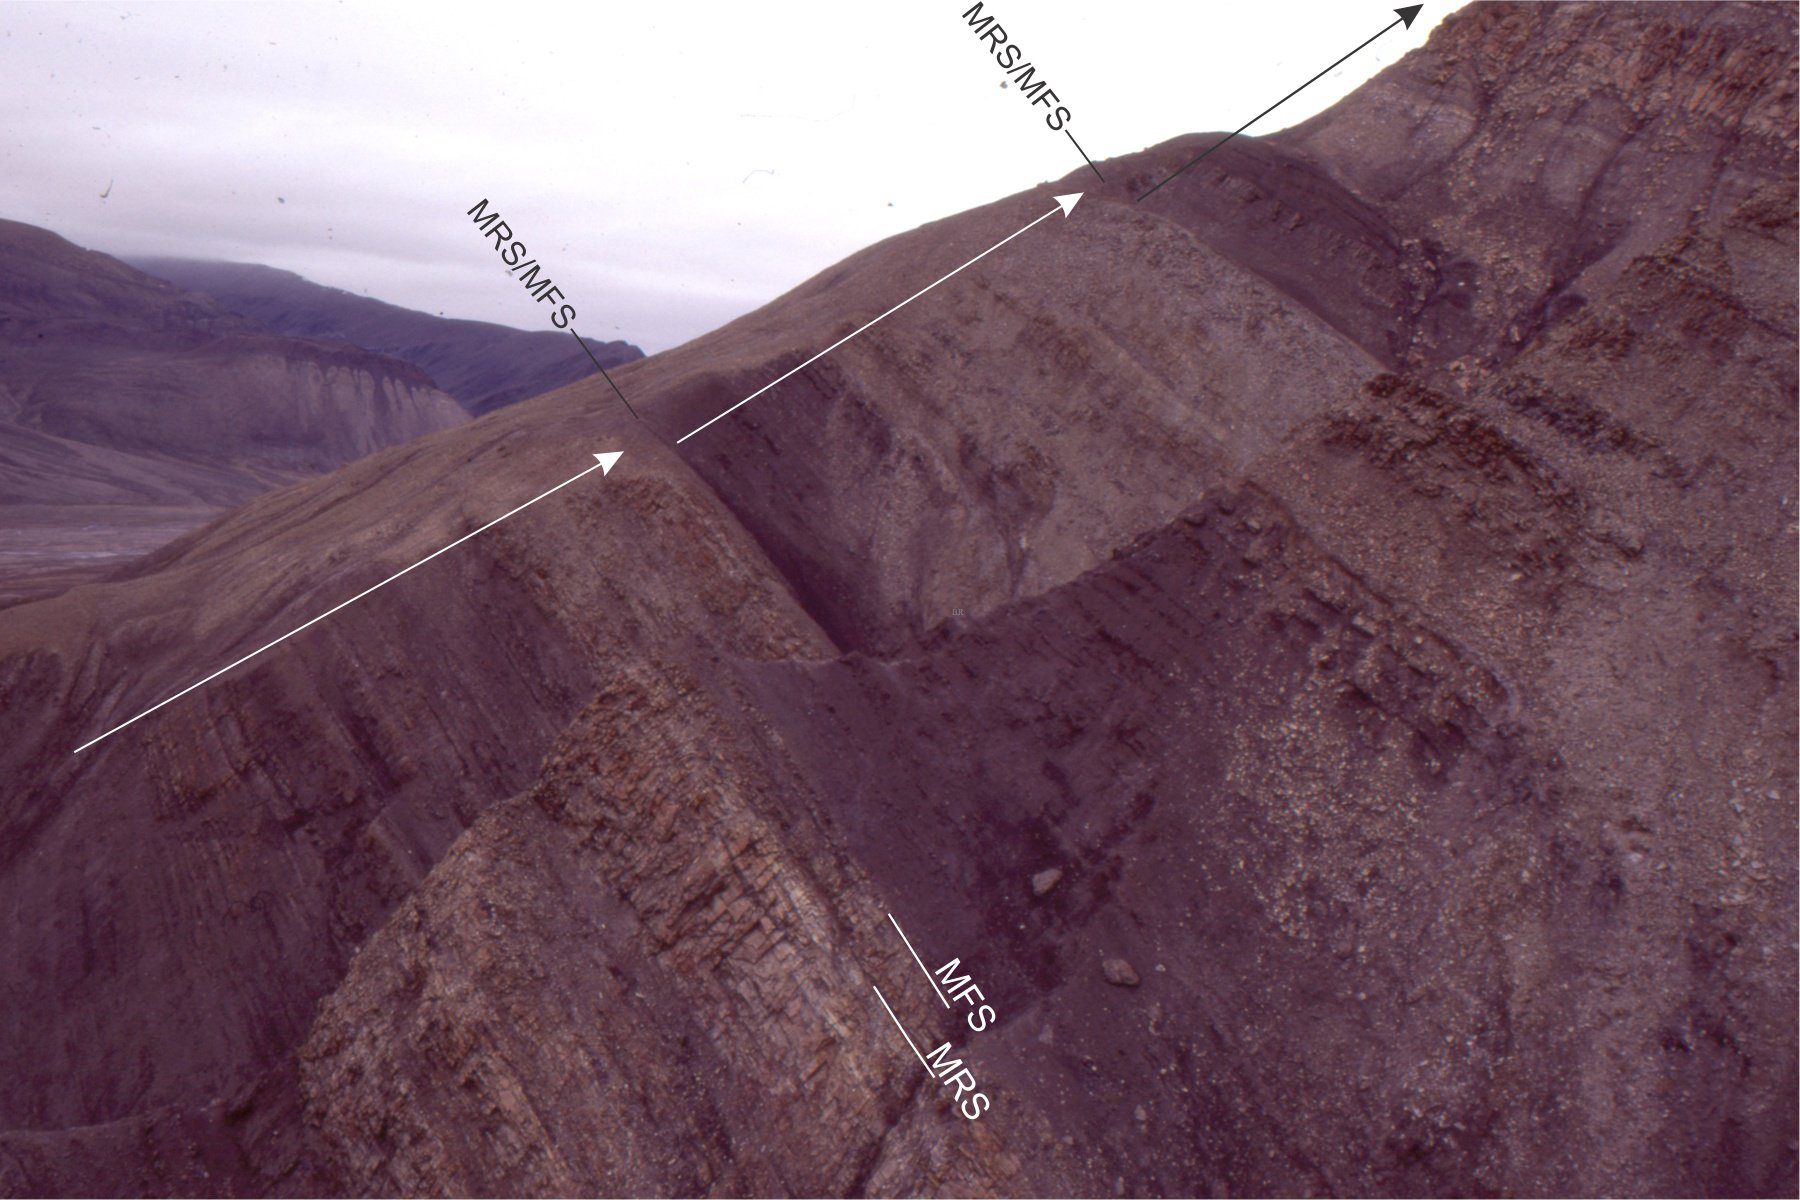
Three high-order coarsening-upward shelf cycles at the top of the Blind Fiord Fm (Lower Triassic), with the maximum regressive surfaces (MRS) indicated at the top of prominent sandstone beds. The middle unit is about 3 m thick. Black arrows indicate coarsening- upward; yellow arrow is fining-upward. A maximum flooding surface is identified at the change from fining-upward to coarsening-upward trends. Smith Cliffs, Sverdrup Basin, Arctic Canada. Image courtesy of Ashton Embry.
Shoreface ravinement surfaces (SR)
Shoreface ravinement is the product of shoreface erosion during baselevel rise. They extend up depositional dip from the most seaward extent of a shoreline at the beginning of (relative) baselevel rise, to the landward extent at the end of baselevel rise. The surface is discordant, truncating lagoonal, estuarine and in some cases fluvial strata deposited during the previous episode of baselevel fall. Erosion may also remove the maximum regressive surface (MRS) and the subaerial unconformity. Ravinement surfaces are onlapped by shallow marine deposits commonly organised as deepening-upward, retrogradational successions (for a review see Cattaneo and Steel, 2003).
Ravinement surfaces are categorised in two ways. The first relies on an interpretation of the main erosion processes involved (based on stratigraphic trend and facies associations). Shoreface erosion by waves tends to occur on open coasts (wave ravinement); shoreface erosion by tidal currents predominates in coastal embayments, lagoons and estuaries (tidal ravinement). However, the wave-generated surface may eventually override and completely remove the tide-generated surface as the shoreline migrates landward.
Ravinement surfaces can also be categorised on the basis of the regional extent of the discordance and the duration of the hiatus that it represents. Again, two types of surfaces are recognized (e.g., Embry, 2009, open access):
– Shoreface ravinement unconformable (SR-U), that has regional significance as an unconformity (at least in terms of its extent across a sedimentary basin); the RS-U may remove earlier formed surfaces like the MRS and subaerial unconformity.
– Shoreface ravinement diastemic (SR-D) is of more local extent and represents a hiatus that is not generally resolvable biostratigraphically or chronostratigraphically. Erosion beneath this diastem is not so great as to remove a subaerial unconformity. For example, excavation by channels usually results in some kind of diastemic discordance.
I prefer this descriptive scheme because it makes a statement about the chronostratigraphic significance of the RS that does not rely on interpretation of the dominant erosional process. However, the SR-U and SR-D can be qualified as wave- or tide- dominant if sufficient information is available.
Shoreface ravinement unconformable
Taranaki Basin, New Zealand

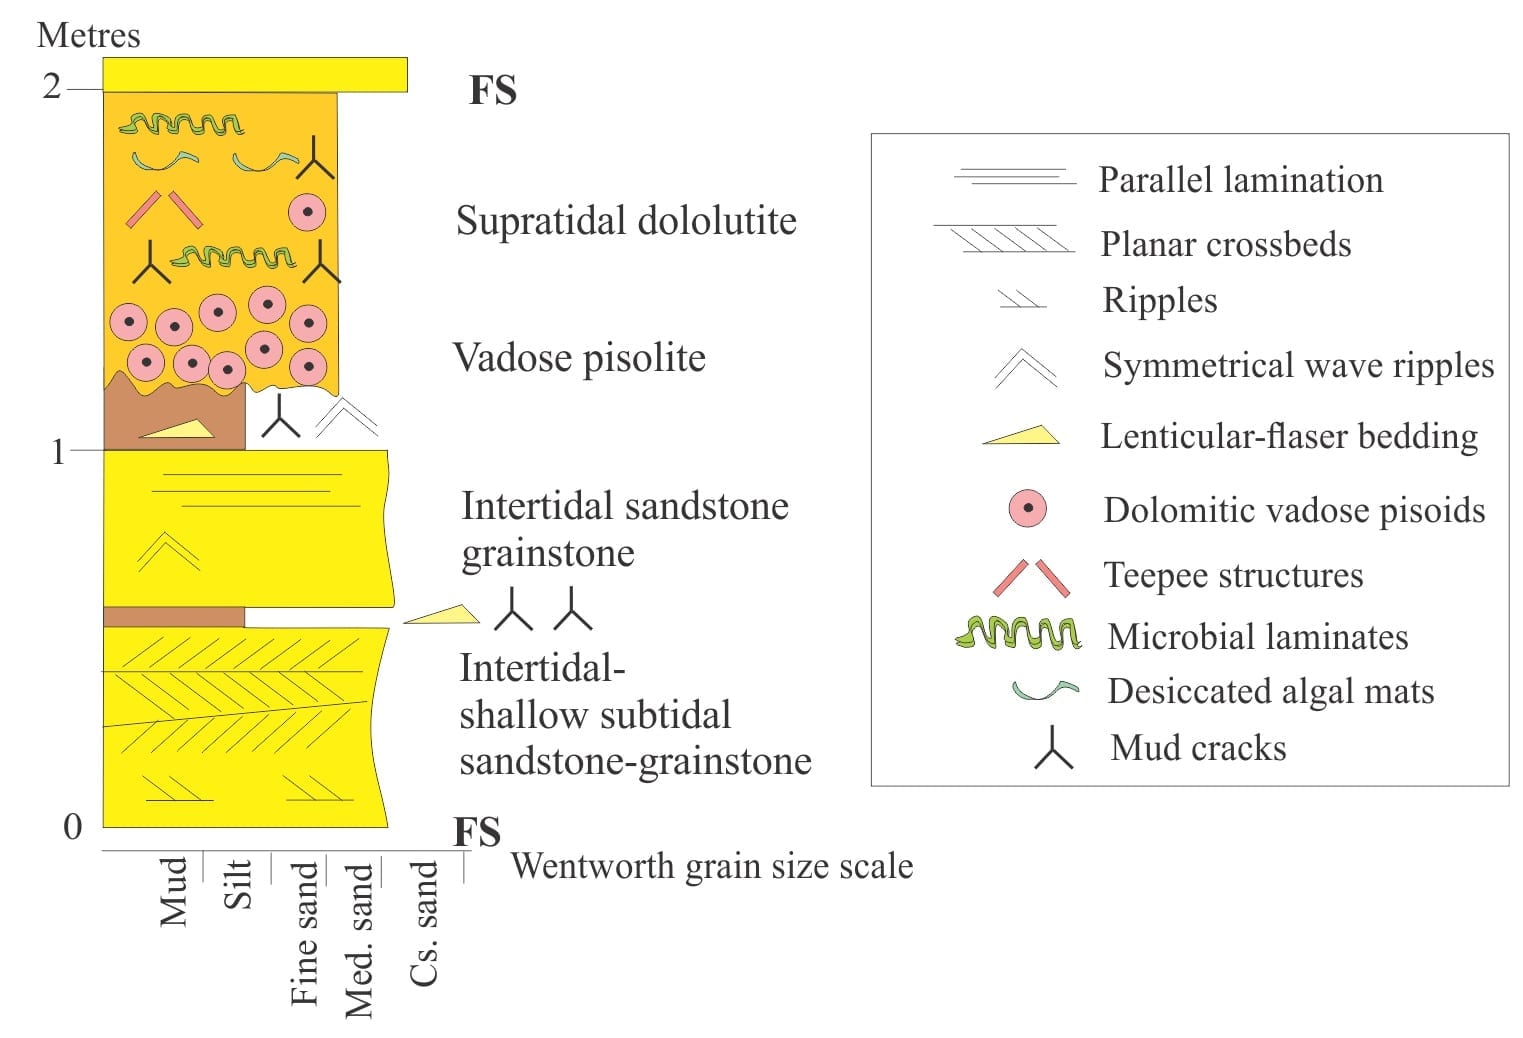
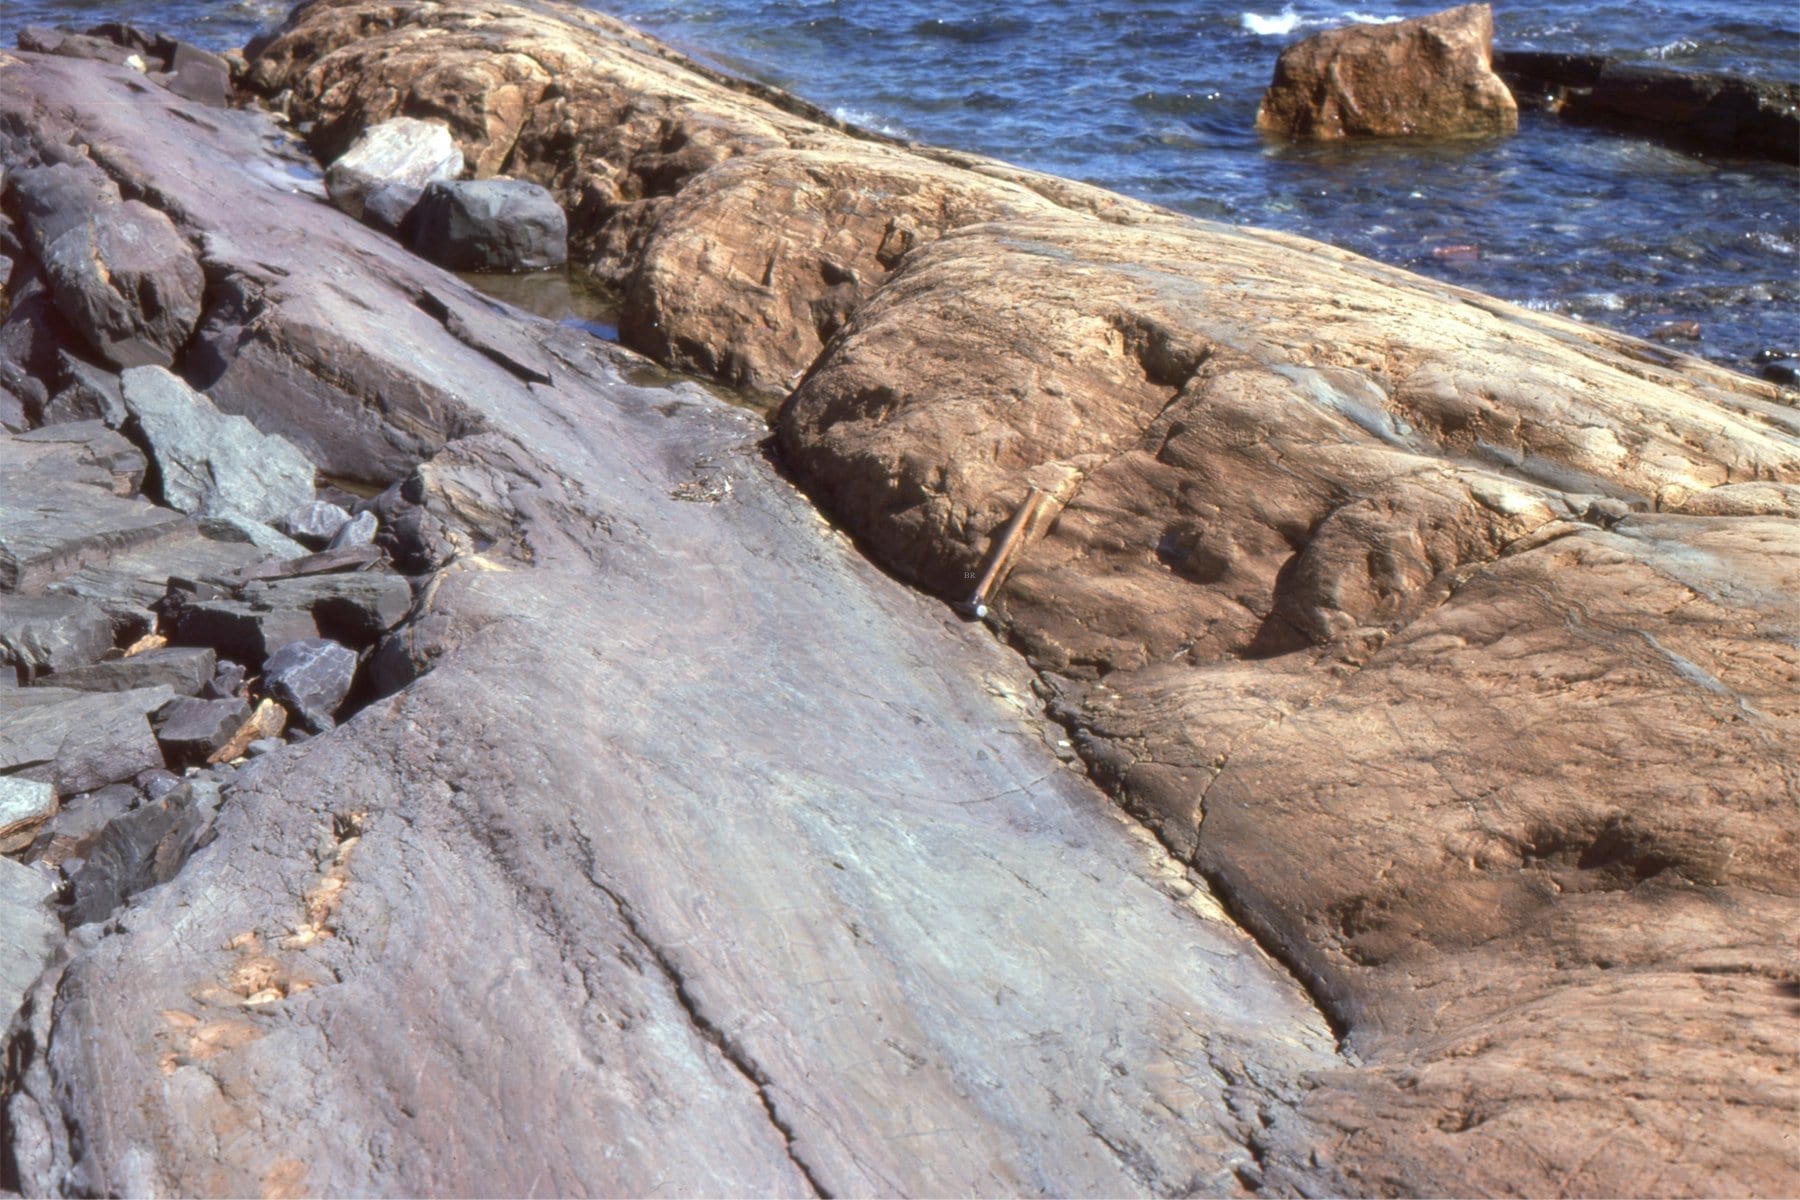
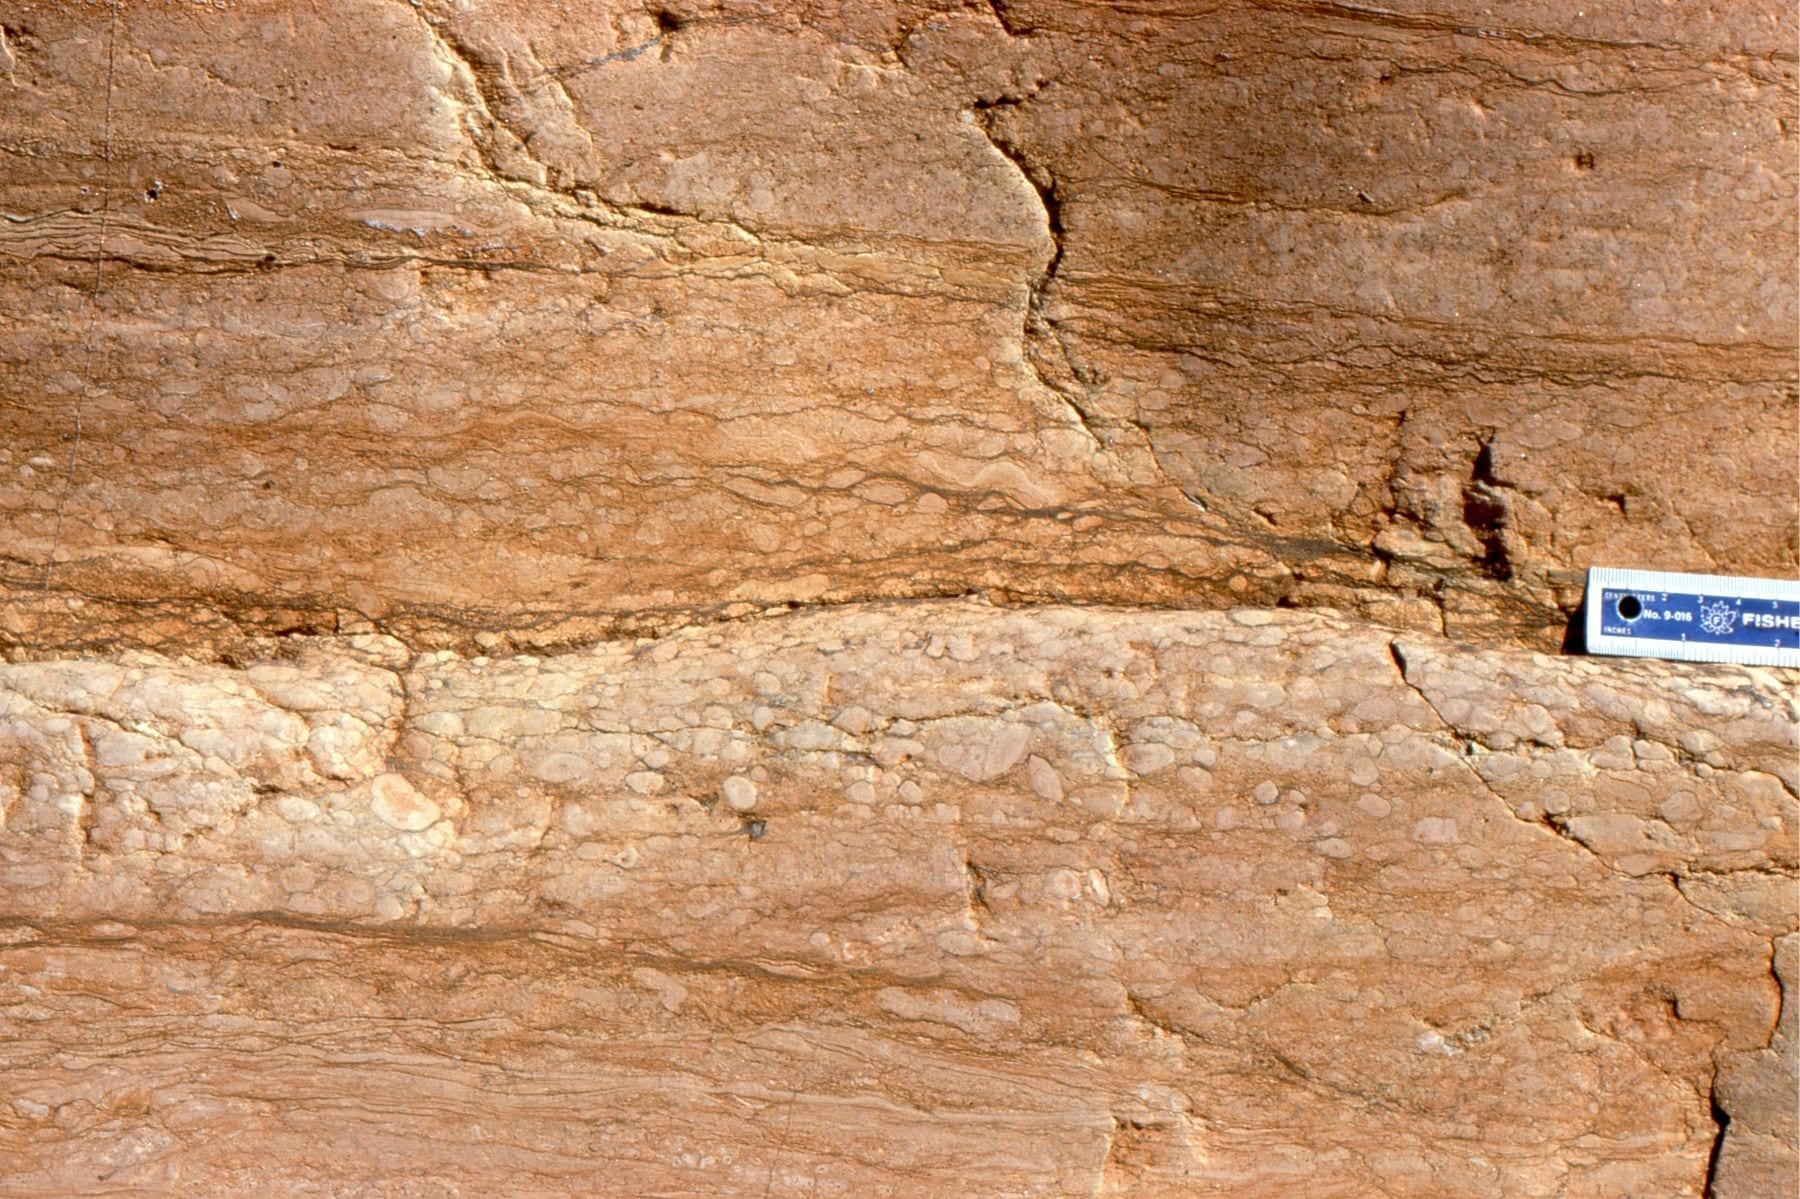
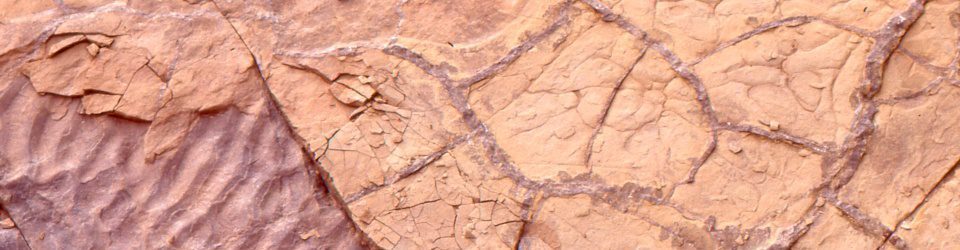
Shelf mudrocks of the Tangahoe Fm. (Late Pliocene – 3-3.4 Ma,) were eroded during the last Interglacial transgression. The ravinement surface (SR-U), that here developed as a bedrock shore platform, is characterised by prominent gutters and potholes. The overlying brown pebble conglomerates and sands (Late Pleistocene Rapanui Fm.) were deposited about 120,000 years ago as the shoreline and shoreface migrated landward. The sandy lithologies contain ripples, lenticular and flaser bedding that are usually associated with current reversals across intertidal and shallow subtidal mud-sand flats and estuaries. South Taranaki coast, New Zealand.
Sverdrup Basin, Arctic Canada

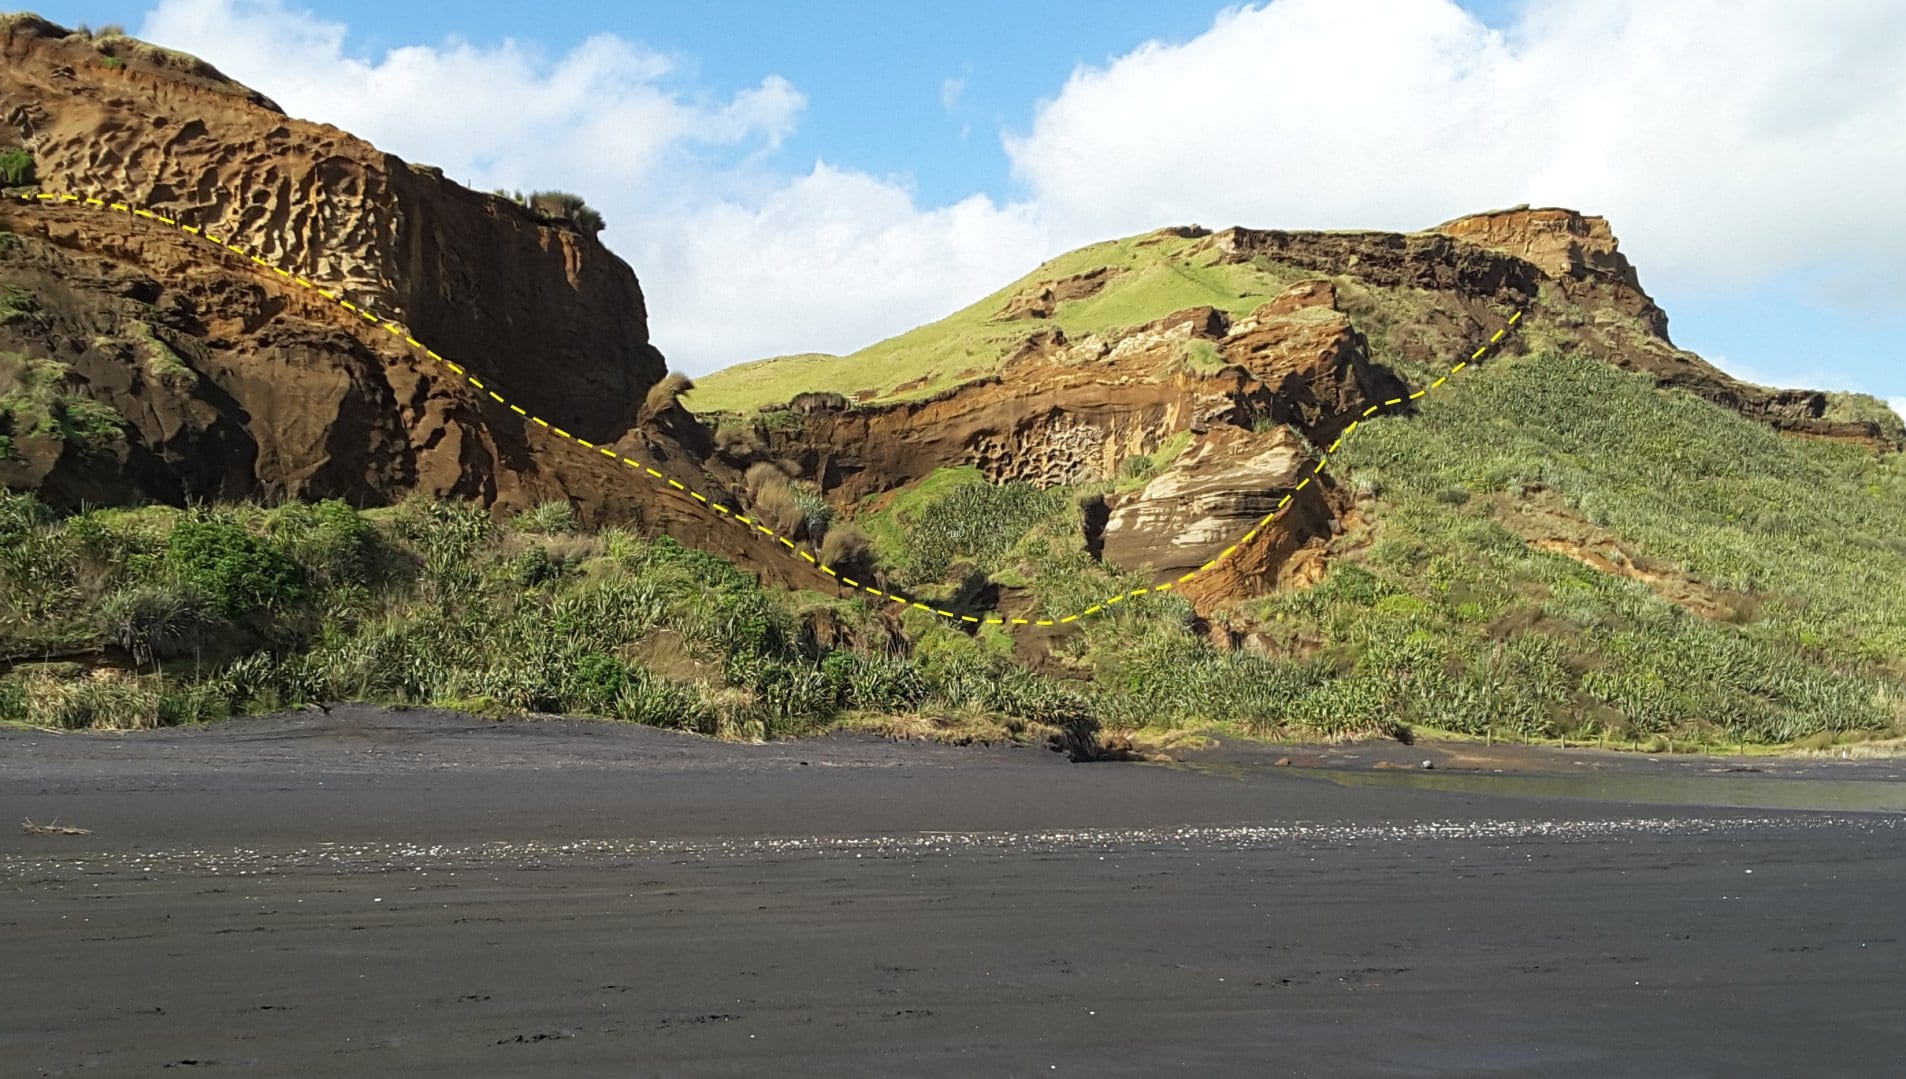
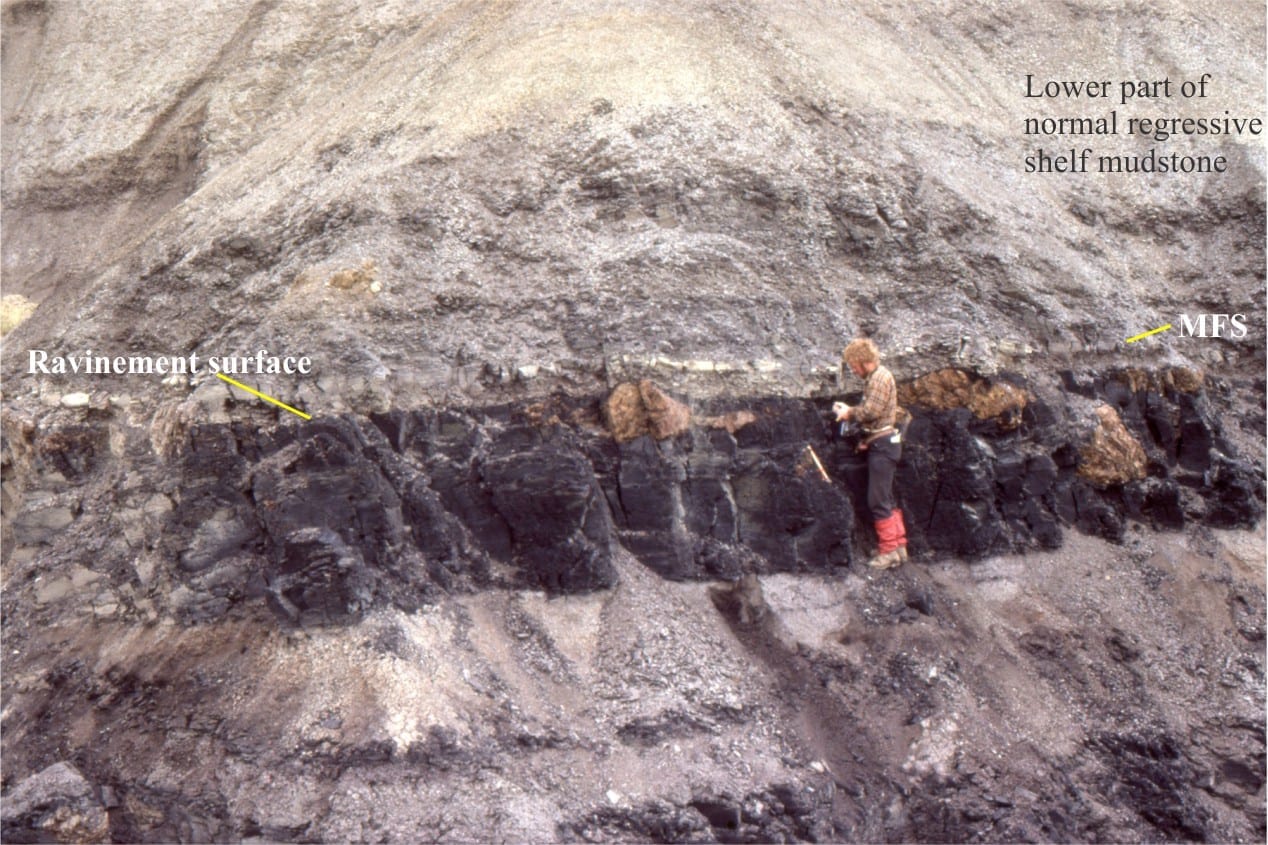
A spectacular exposure at Yelverton Pass (Ellesmere Island) showing two unconformable shoreface ravinement surfaces that embrace an entire cycle of baselevel rise – fall – rise recorded in a thin deep-water shale of Norian age (Barrow Fm.). The lowest SR-U that erodes folded Carboniferous rocks was the culmination of a hiatus lasting 117 million years – ravinement removed much of the evidence for subaerial exposure. The SR-U between the Barrow shales and Heiberg Formation encompasses the Late Norian to Early Rhaetian (Late Triassic) and heralds an extended period of delta construction that continued into the Early Jurassic. Image courtesy of Ashton Embry.
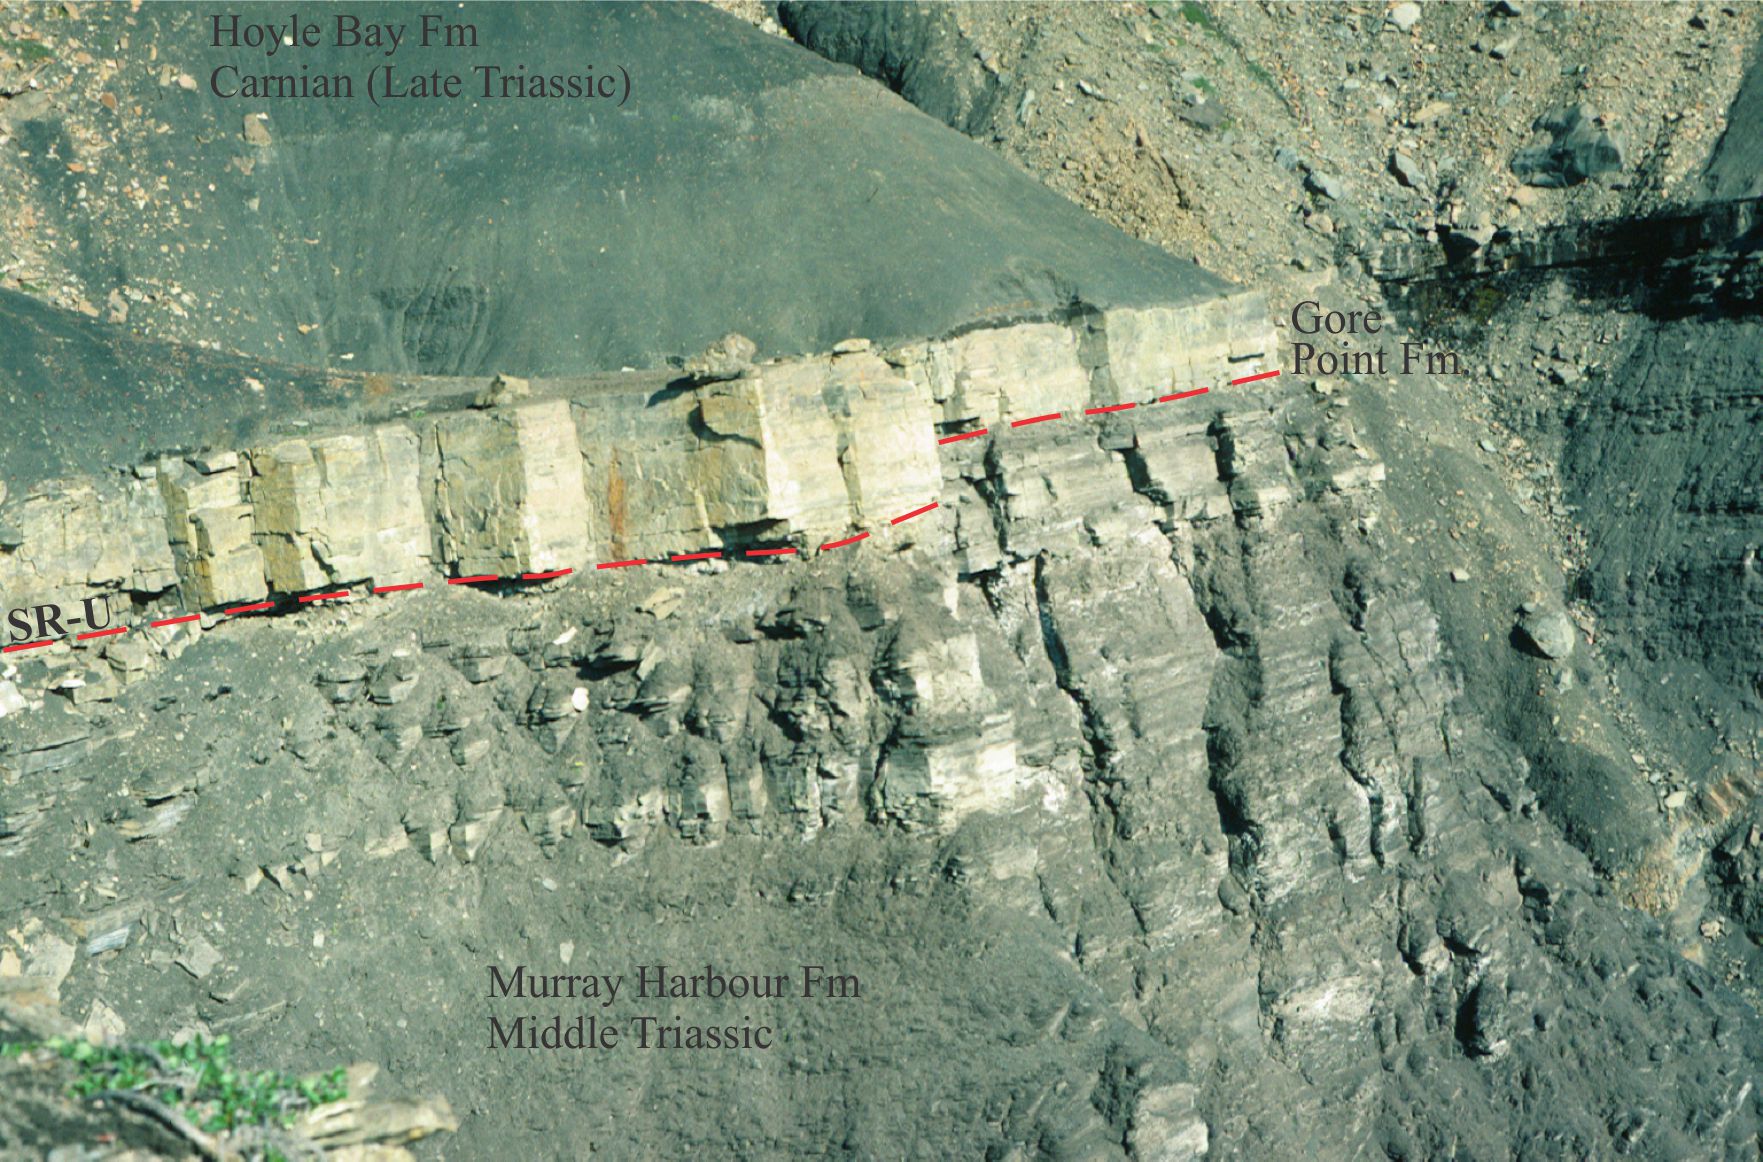
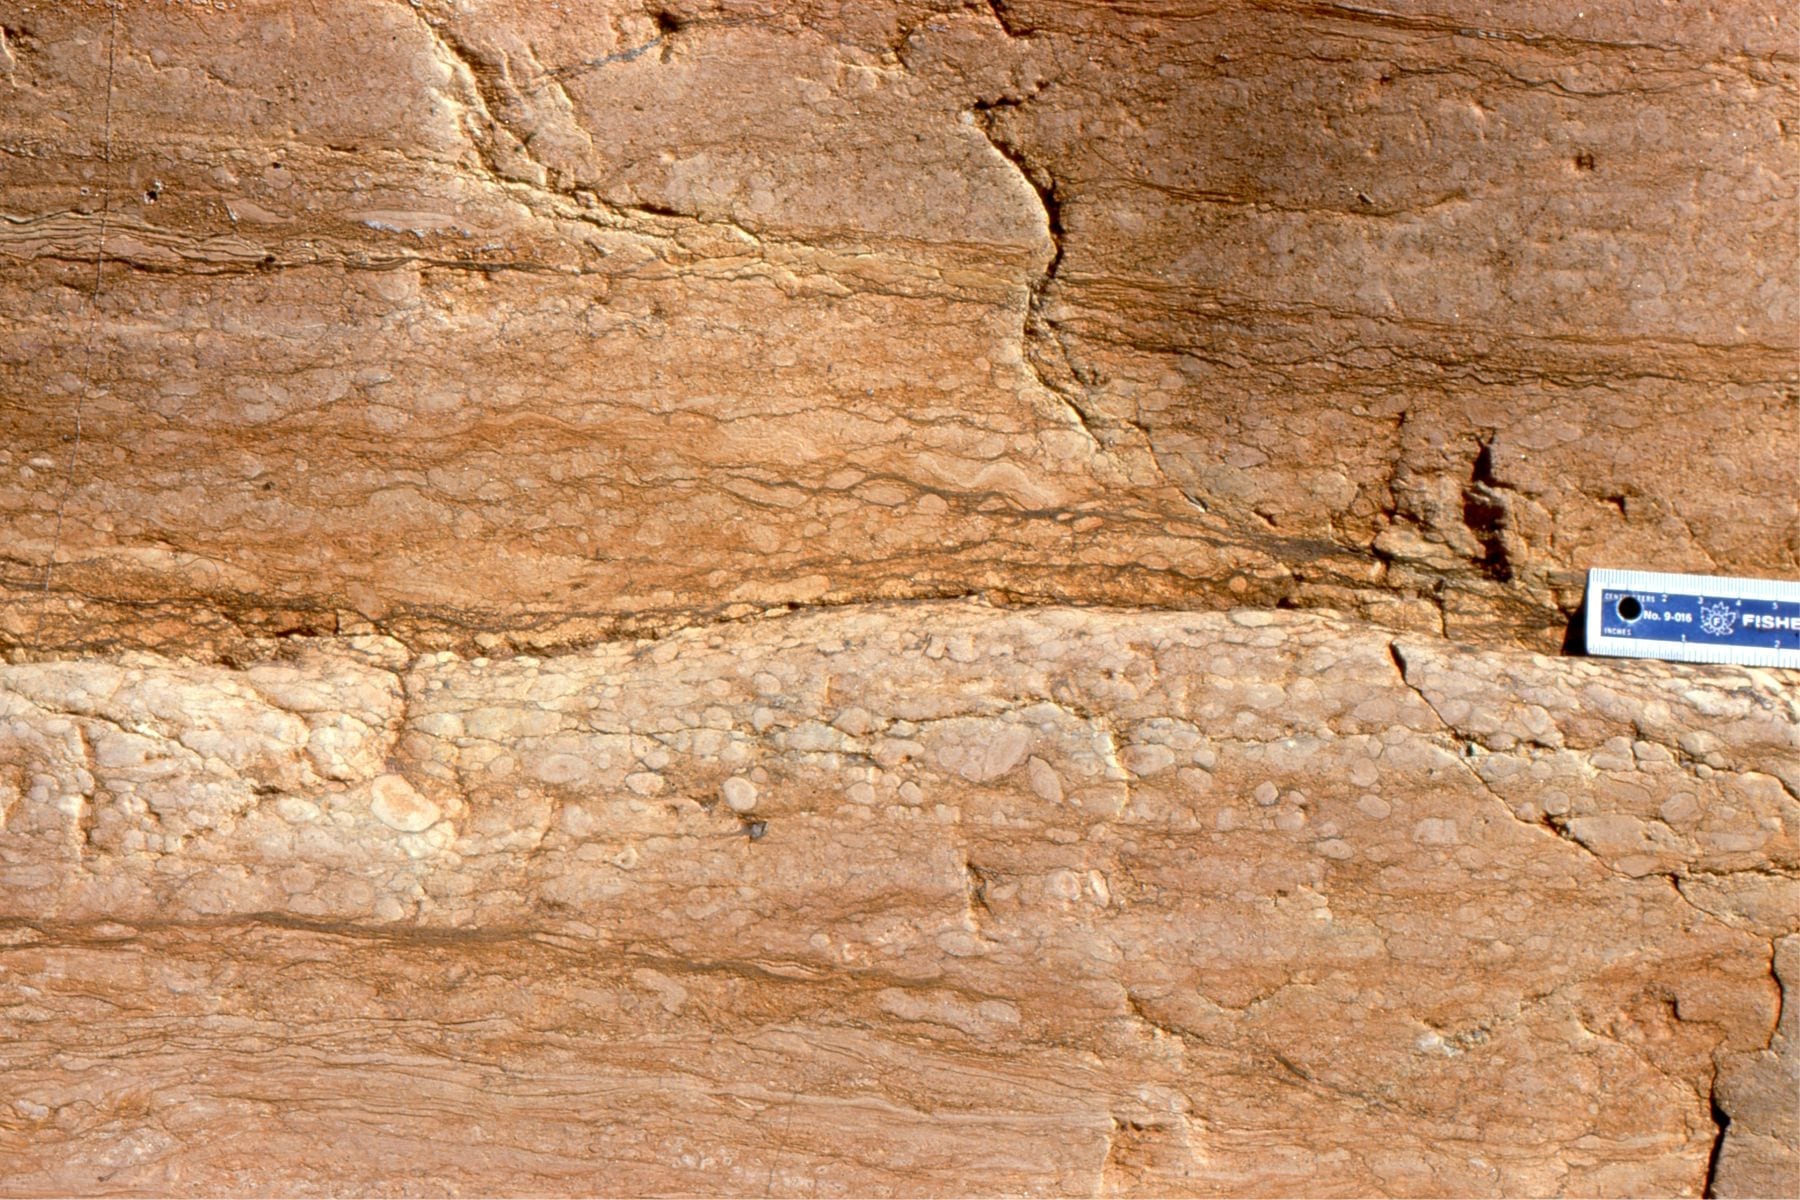
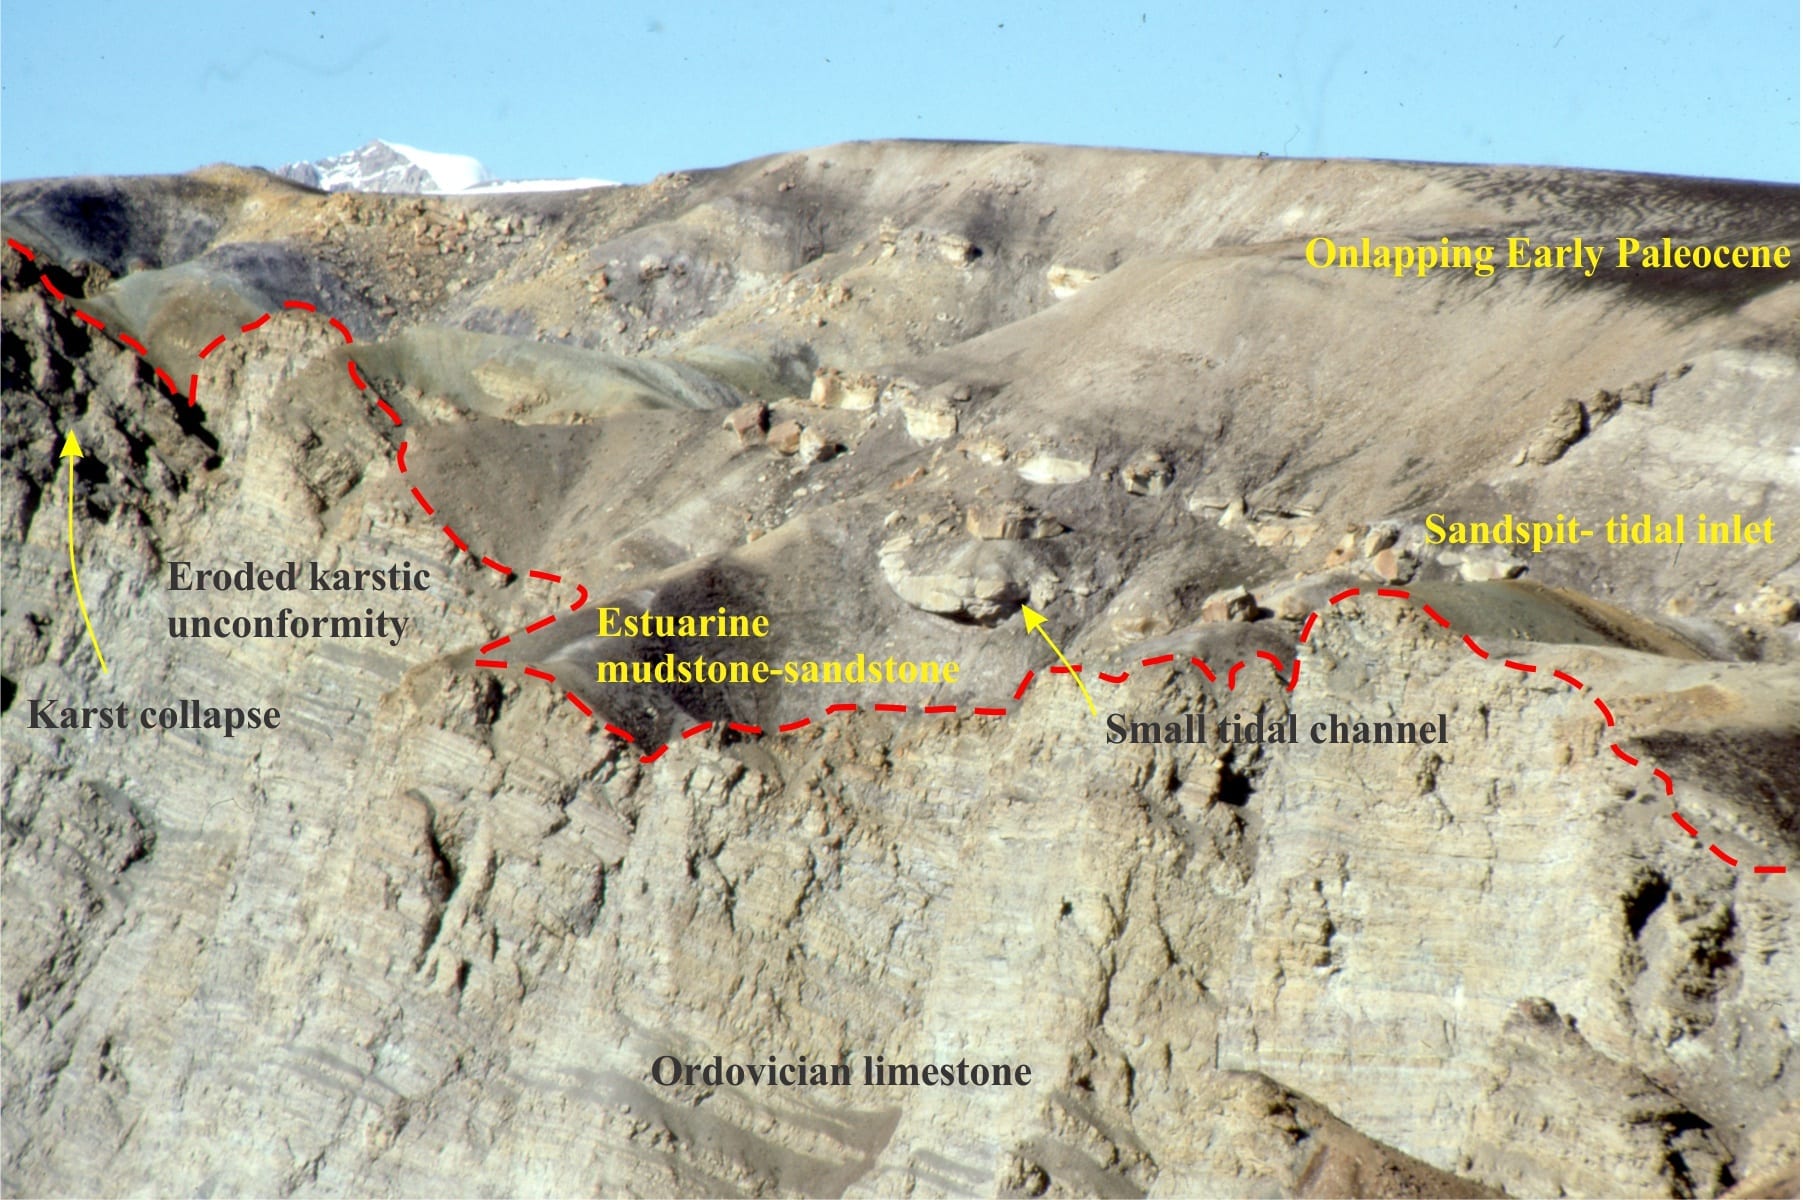
In this Late Triassic succession, a resistant unit of micritic limestone (about a metre thick) overlies an unconformable shoreface ravinement (SR-U) that (probably in combination with the subaerial unconformity) removed late Ladinian to early Carnian strata – a hiatus of about 10 million years. The transgressive limestone (Gore Point Fm. Middle Carnian) represents accumulation on a shelf at a time when terrigenous sediment supply was very low. Interbedded shale-sandstone beds below the SR-U (Murray Harbour Group) also accumulated on a shelf but during a period of greater sediment supply. Esayoo Bay, Sverdrup Basin. Image courtesy of Ashton Embry.
Shoreface ravinement diastemic
South Auckland, New Zealand
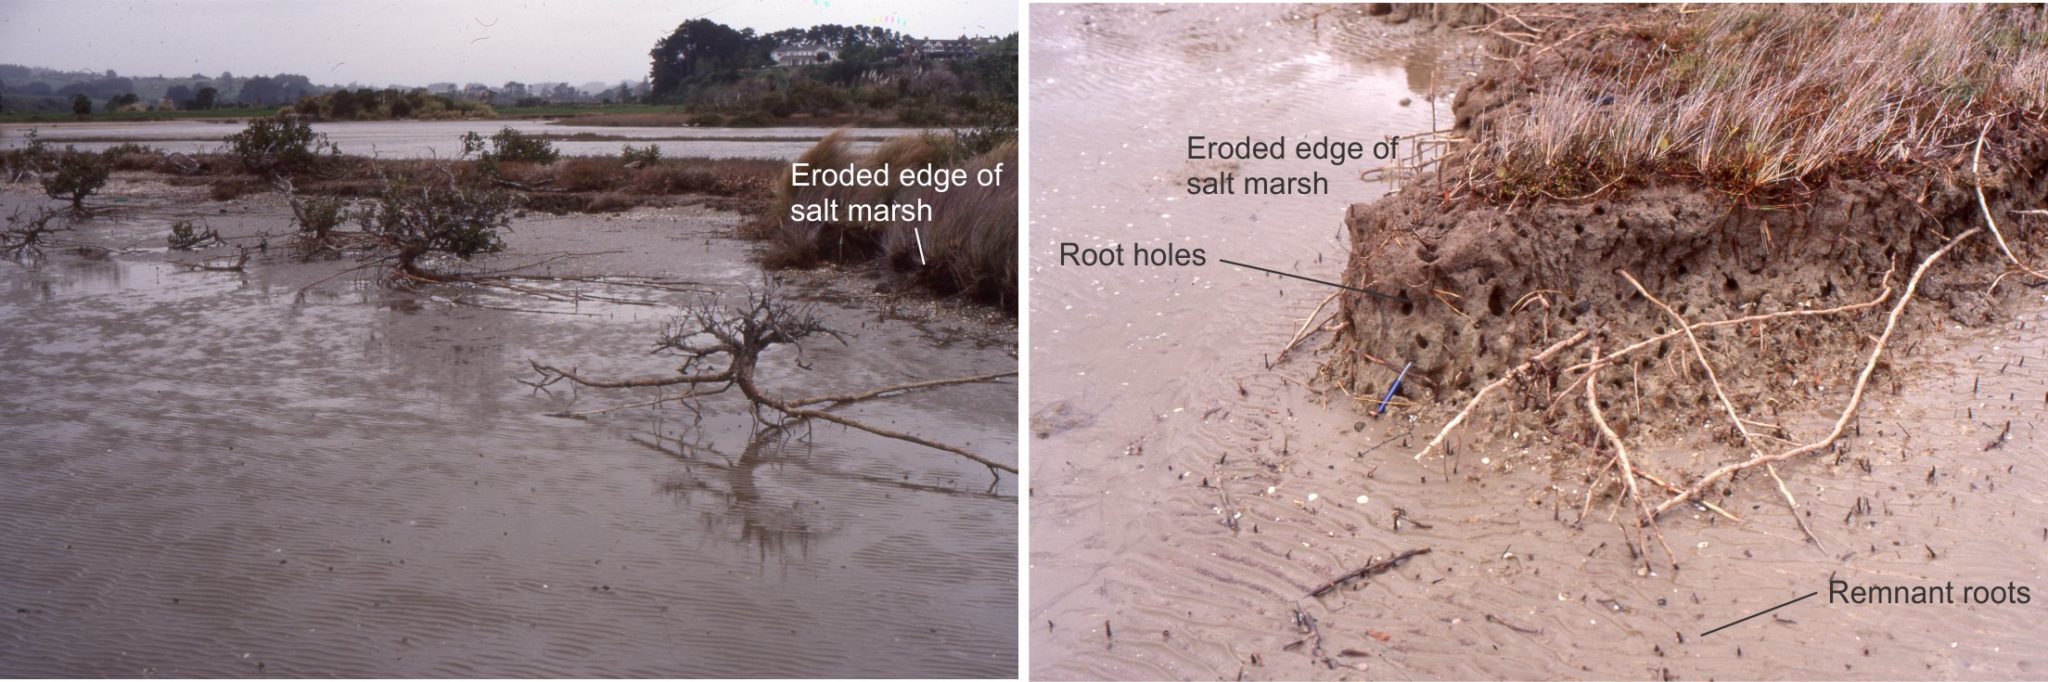
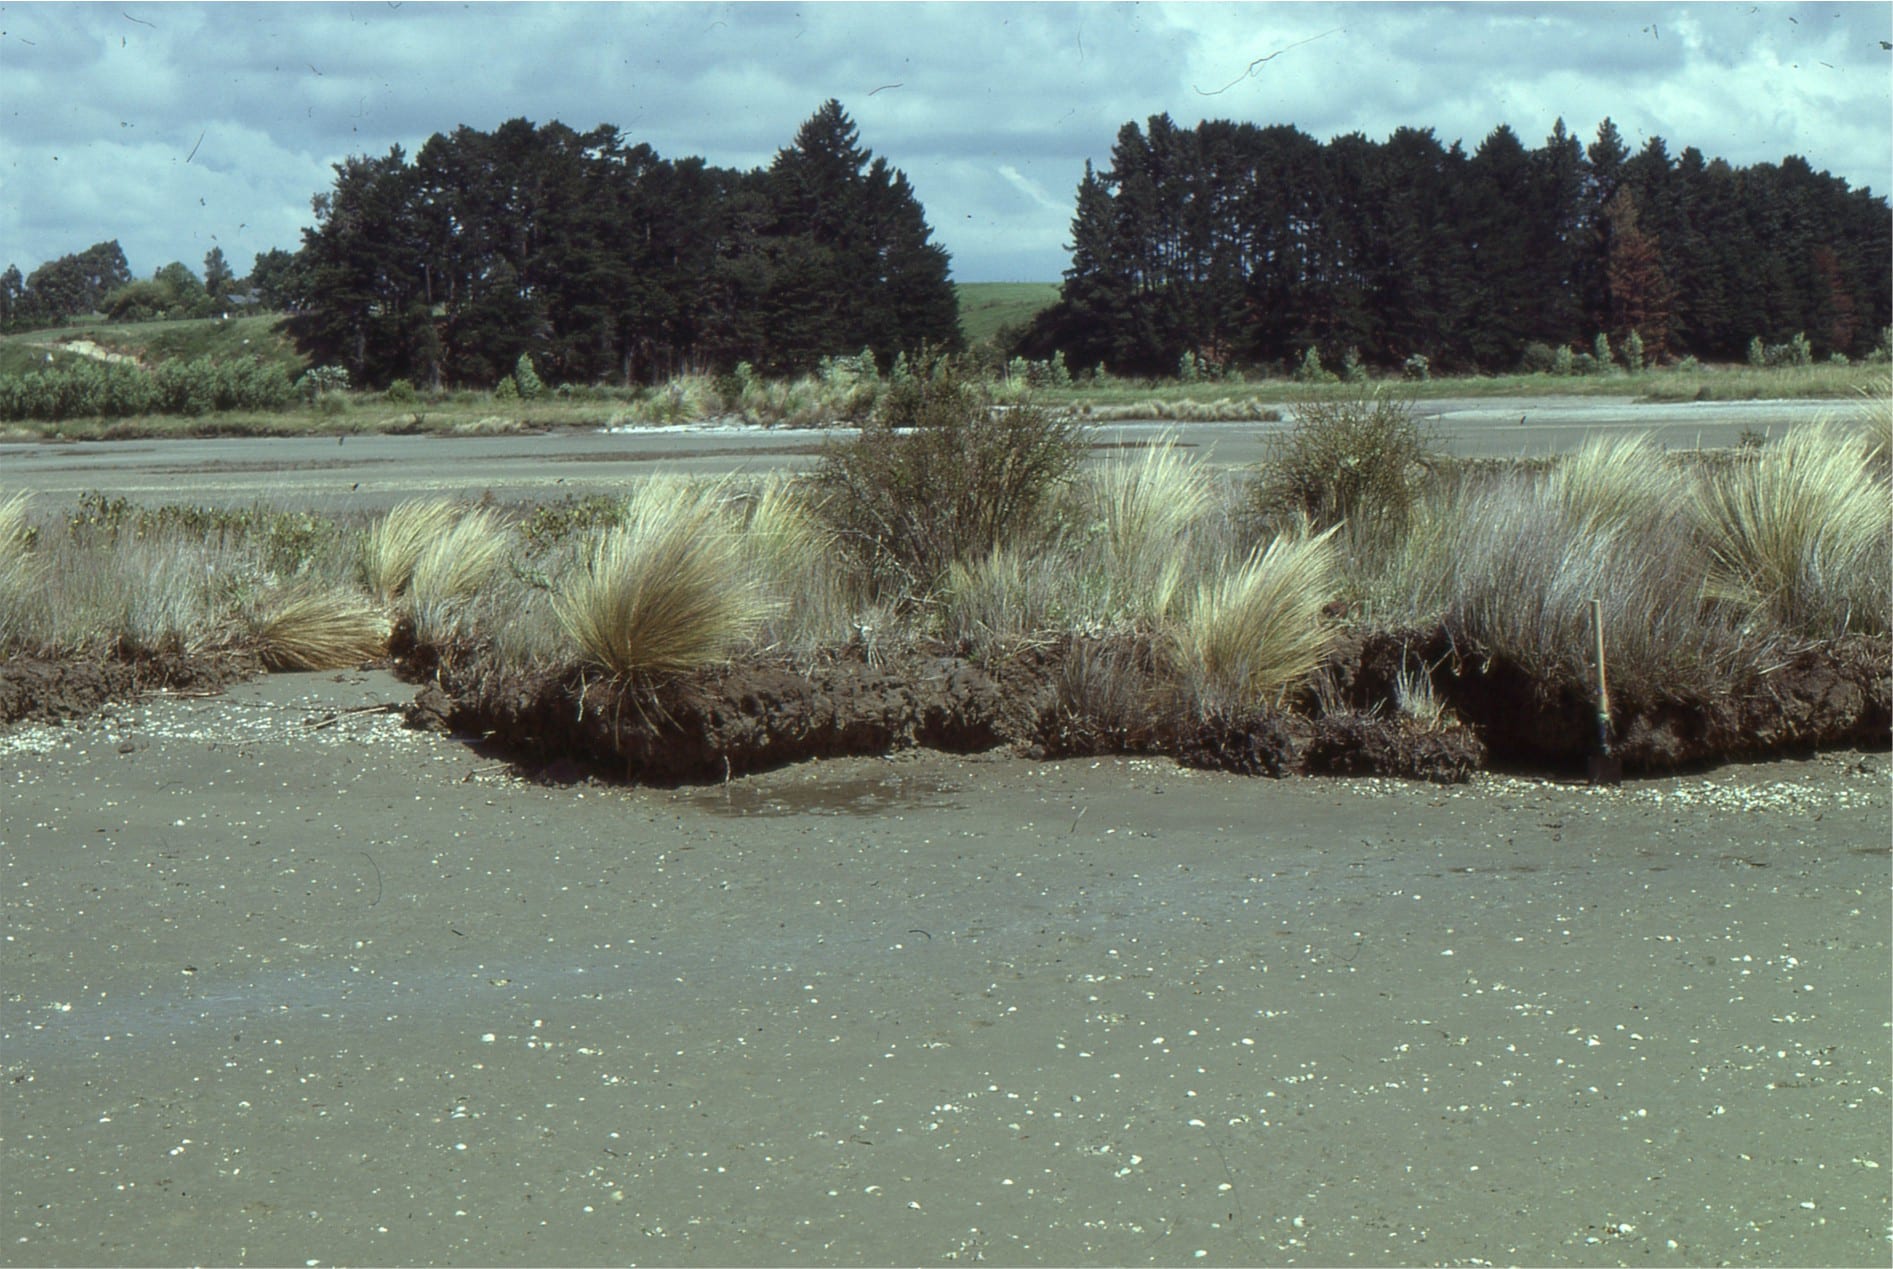
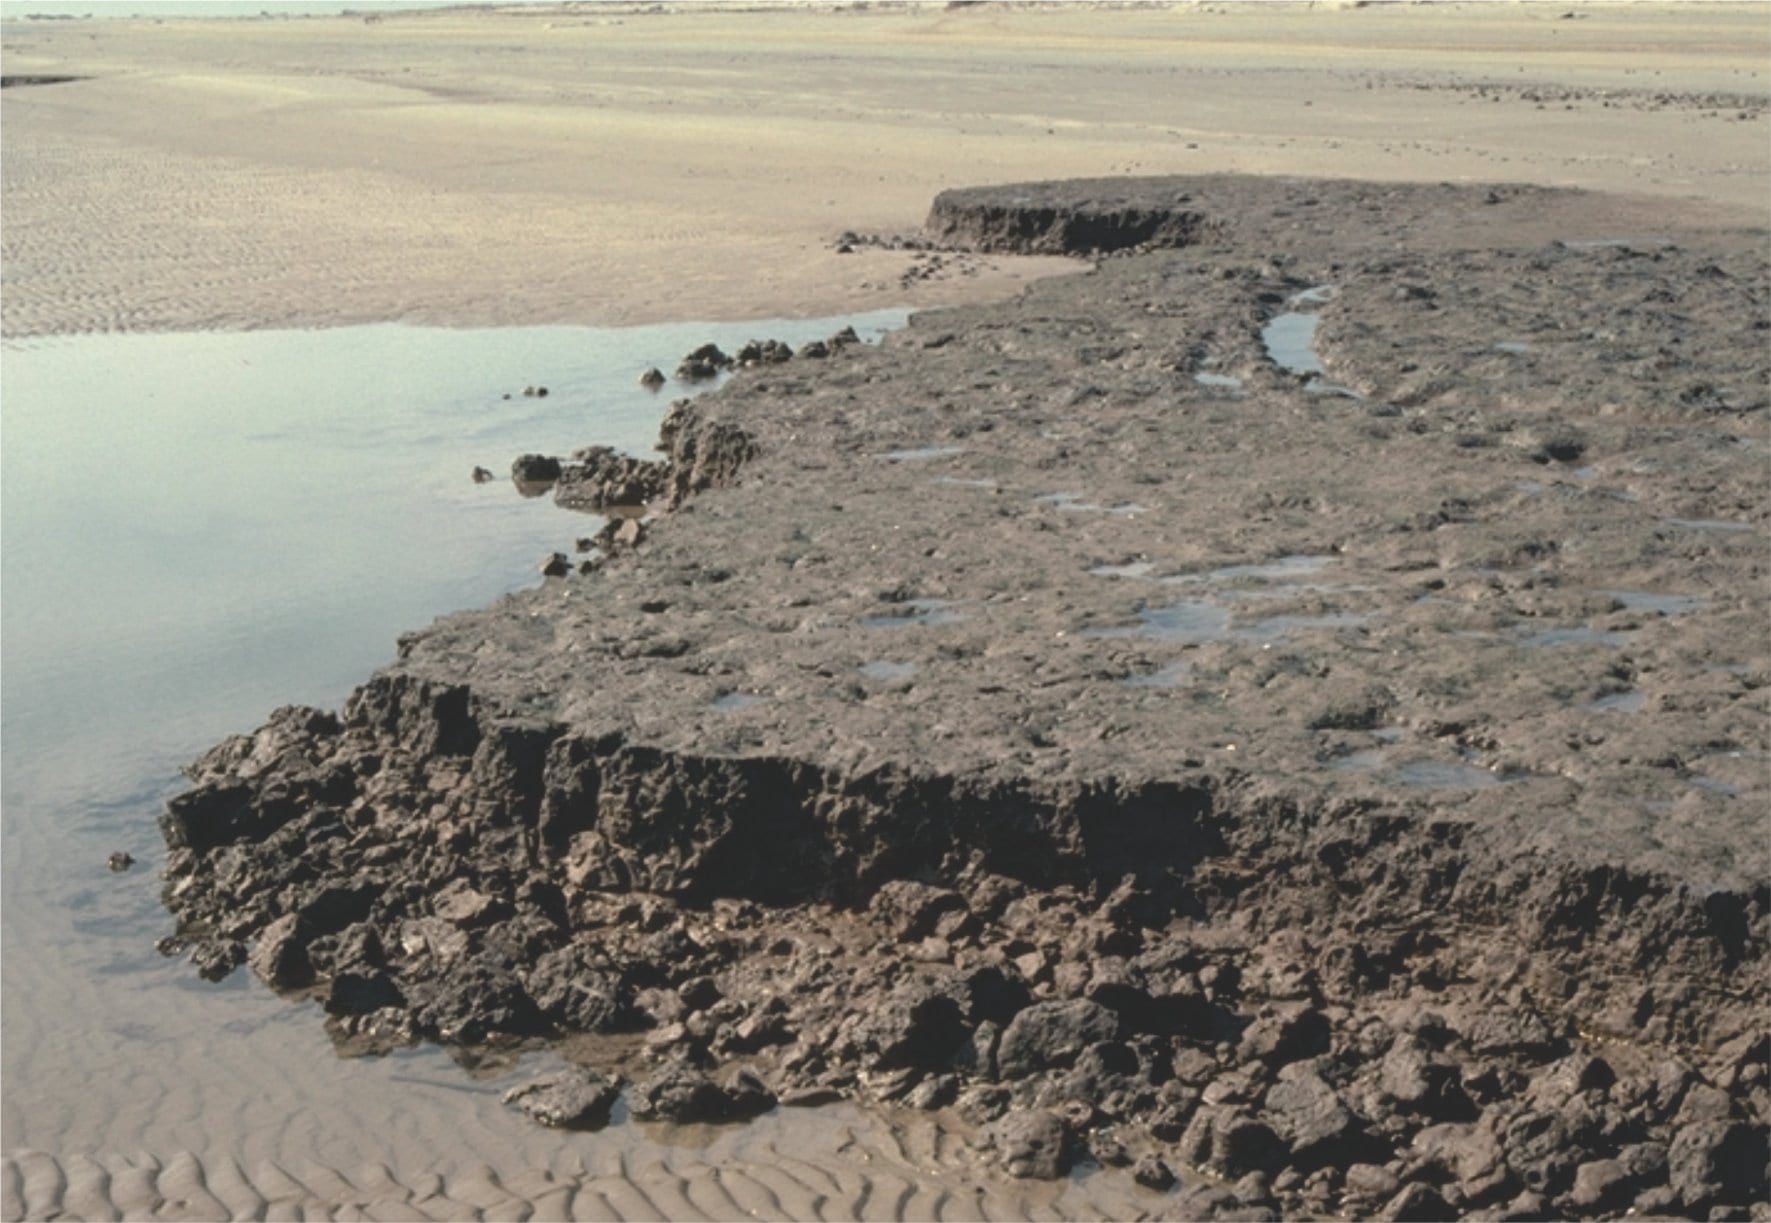
A modern diastemic ravinement (SR-D) developing in an estuary along the south Auckland coast, New Zealand. Salt marsh deposits are gradually being eroded by encroaching intertidal and subtidal sands. The left image shows remnants of the salt marsh muds and dead or dying mangroves with roots exposed by erosion. The right image shows some detail of the eroded marsh deposits, where the roots of Salicornia and rushes are exposed. Most of the open holes were formerly occupied by roots that decayed once they were exposed. Excavations through these deposits show that about 90% of the salt marsh unit will be removed, leaving only a veneer preserved in the rock record.
Sverdrup Basin, Arctic Canada
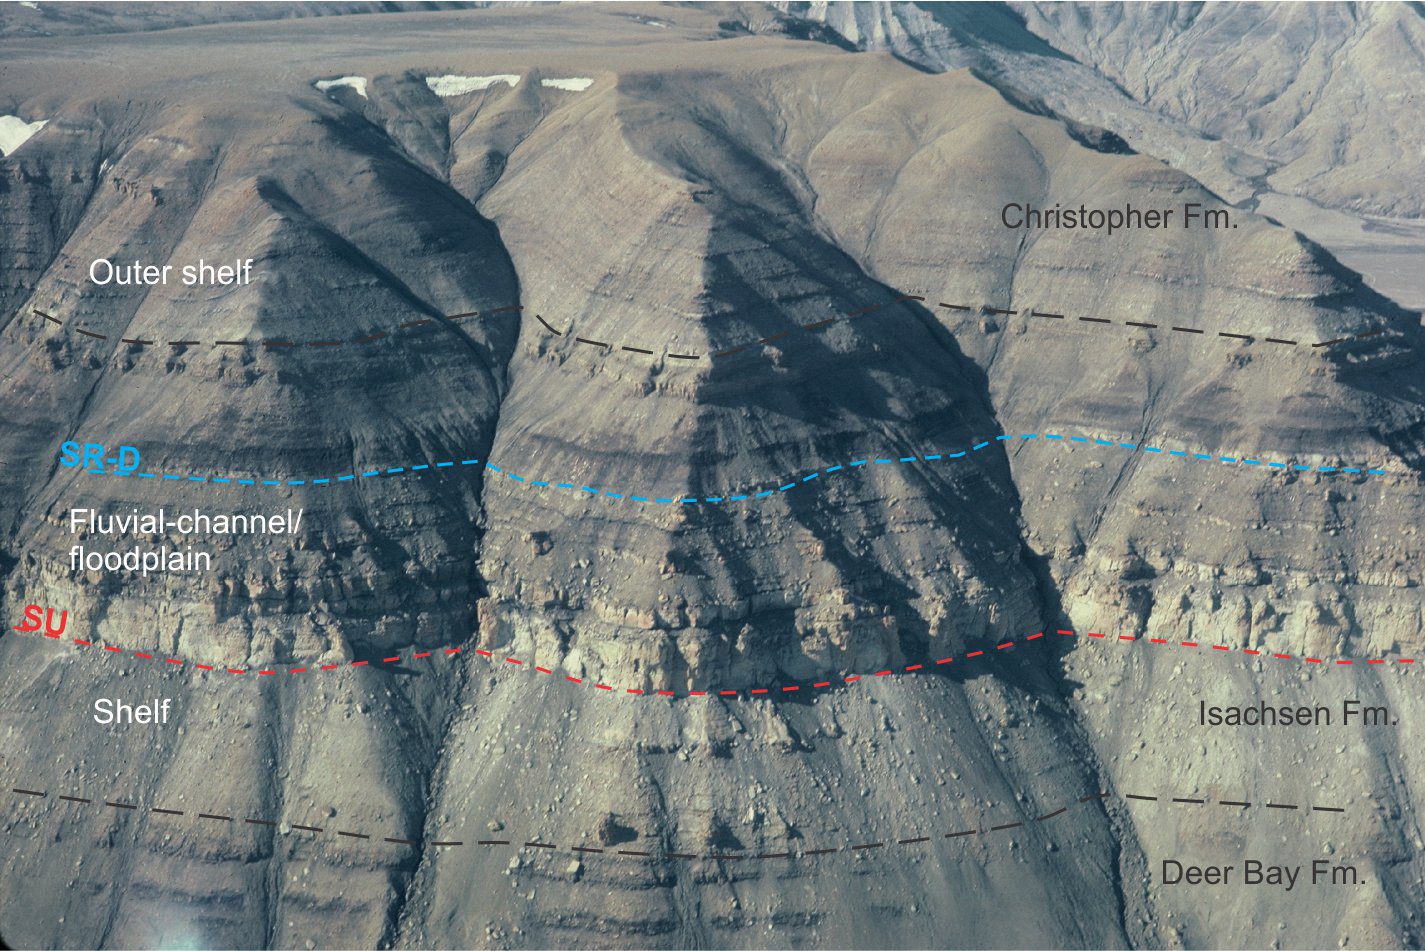
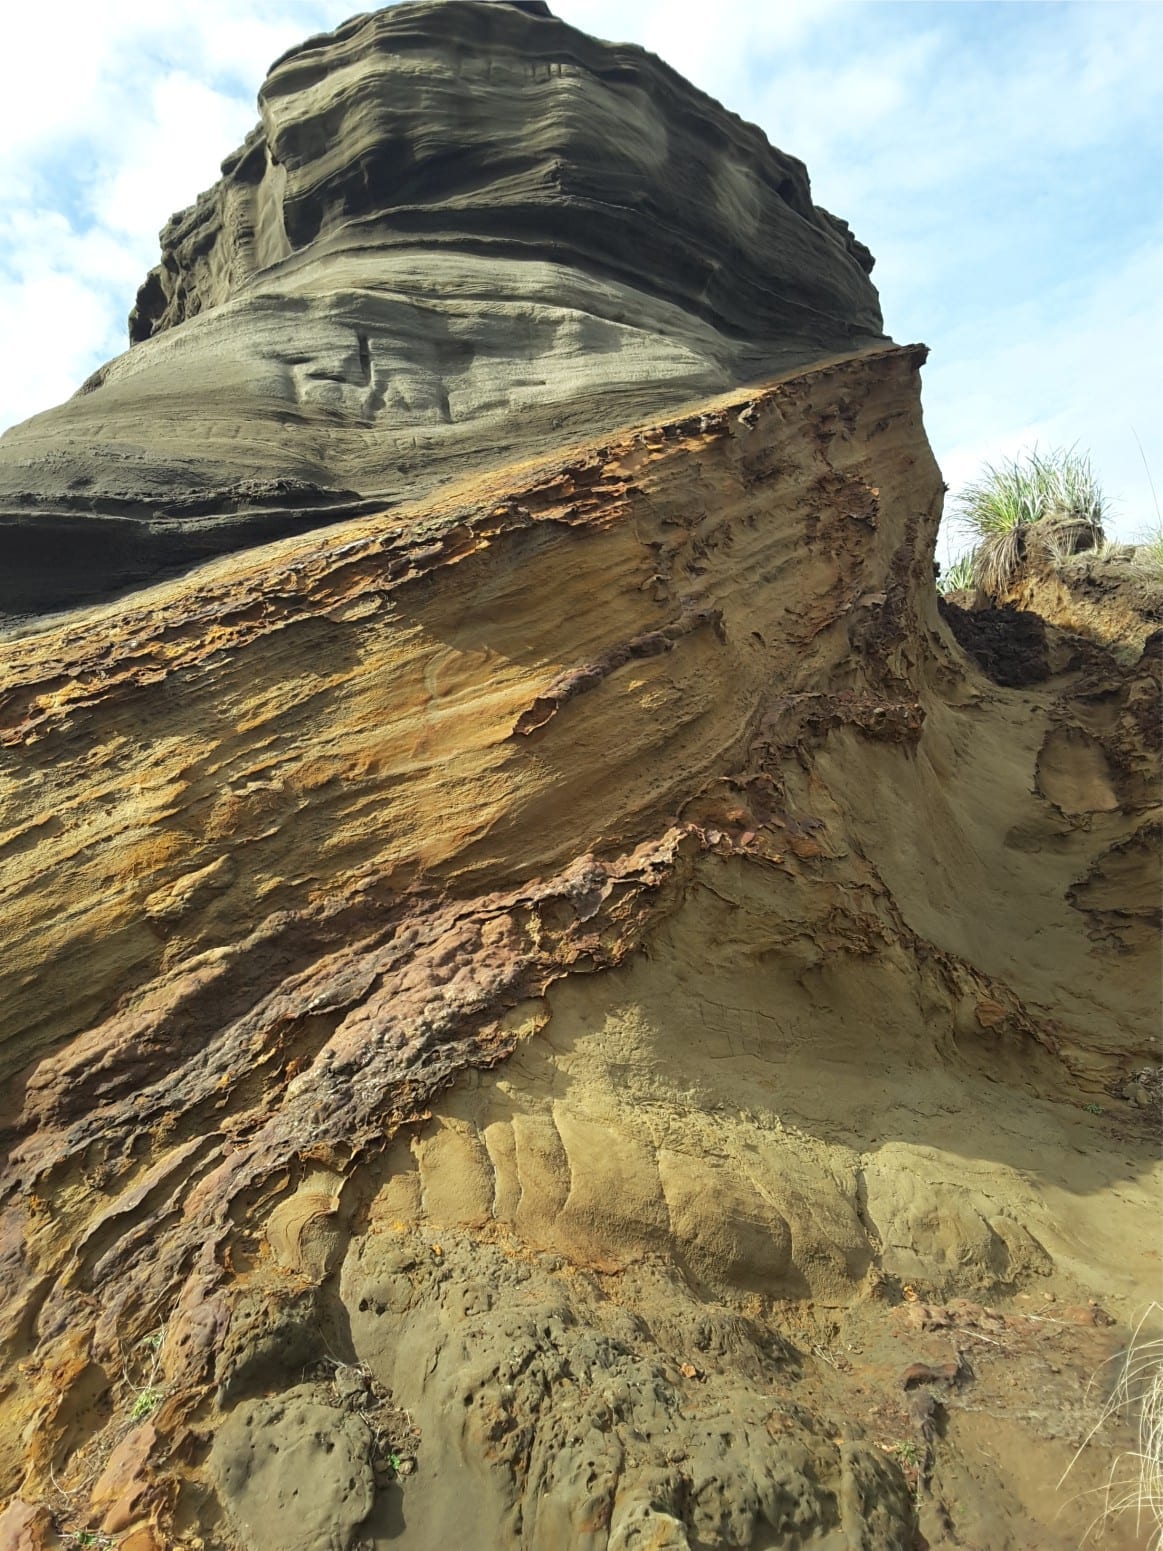
A Lower Cretaceous succession in Sverdrup Basin showing the transition from subaerial exposure (SU – within the Isachsen Fm.) to transgression where excavation by shoreface ravinement (SR-D) was minimal. The intervening non-marine fluvial channel and carbonaceous floodplain deposits preserve the subaerial unconformity. The diastemic SR surface is placed at the dramatic facies change from non-marine sandstone, mudstone, and coal beds to outer shelf, marine shale. Buchanan Lake, Ellesmere Island. Image courtesy of Ashton Embry.
Maximum Flooding Surfaces
Sverdrup Basin, Arctic Canada
Panoramic view of maximum regressive and maximum flooding surfaces for three 3rd-order sequence in the Lower Triassic Blind Fiord Fm – the MRS surfaces are described under the maximum regressive surface banner.
The Smithian MFS (dashed line) is placed at the transition from fining- to coarsening-upward trends and indicates the end of transgression in this sequence. Shale below the MFS is organic-rich, reflecting low terrigenous sedimentation rates. In the overlying Spathian sequence, the MRS2 and MFS are separated by only 40 cm. In this case, the sequence boundary is located within a shale succession. Subtle, but important transitions like this require close examination of the outcrop or core to detect changes in stratigraphic trend. Smith Cliffs, Sverdrup Basin. Image courtesy of Ashton Embry.
Three coarsening upward pro-delta through delta plain cycles, each containing prominent maximum flooding surfaces in the Campanian portion of the Expedition Formation (Eureka Sound Group). Each cycle begins with an MRS that marks the top of normal regression (coarsening upward sandstone-shale – arrows) and the beginning of baselevel rise. The records of transgression in each cycle are thin, fining-upward packages about 50-80 cm thick, that culminate in an MFS at the transition to coarsening-upward trends of the succeeding regressive succession. Axel Heiberg Island, Arctic Canada.
Bowser Basin, northern British Columbia
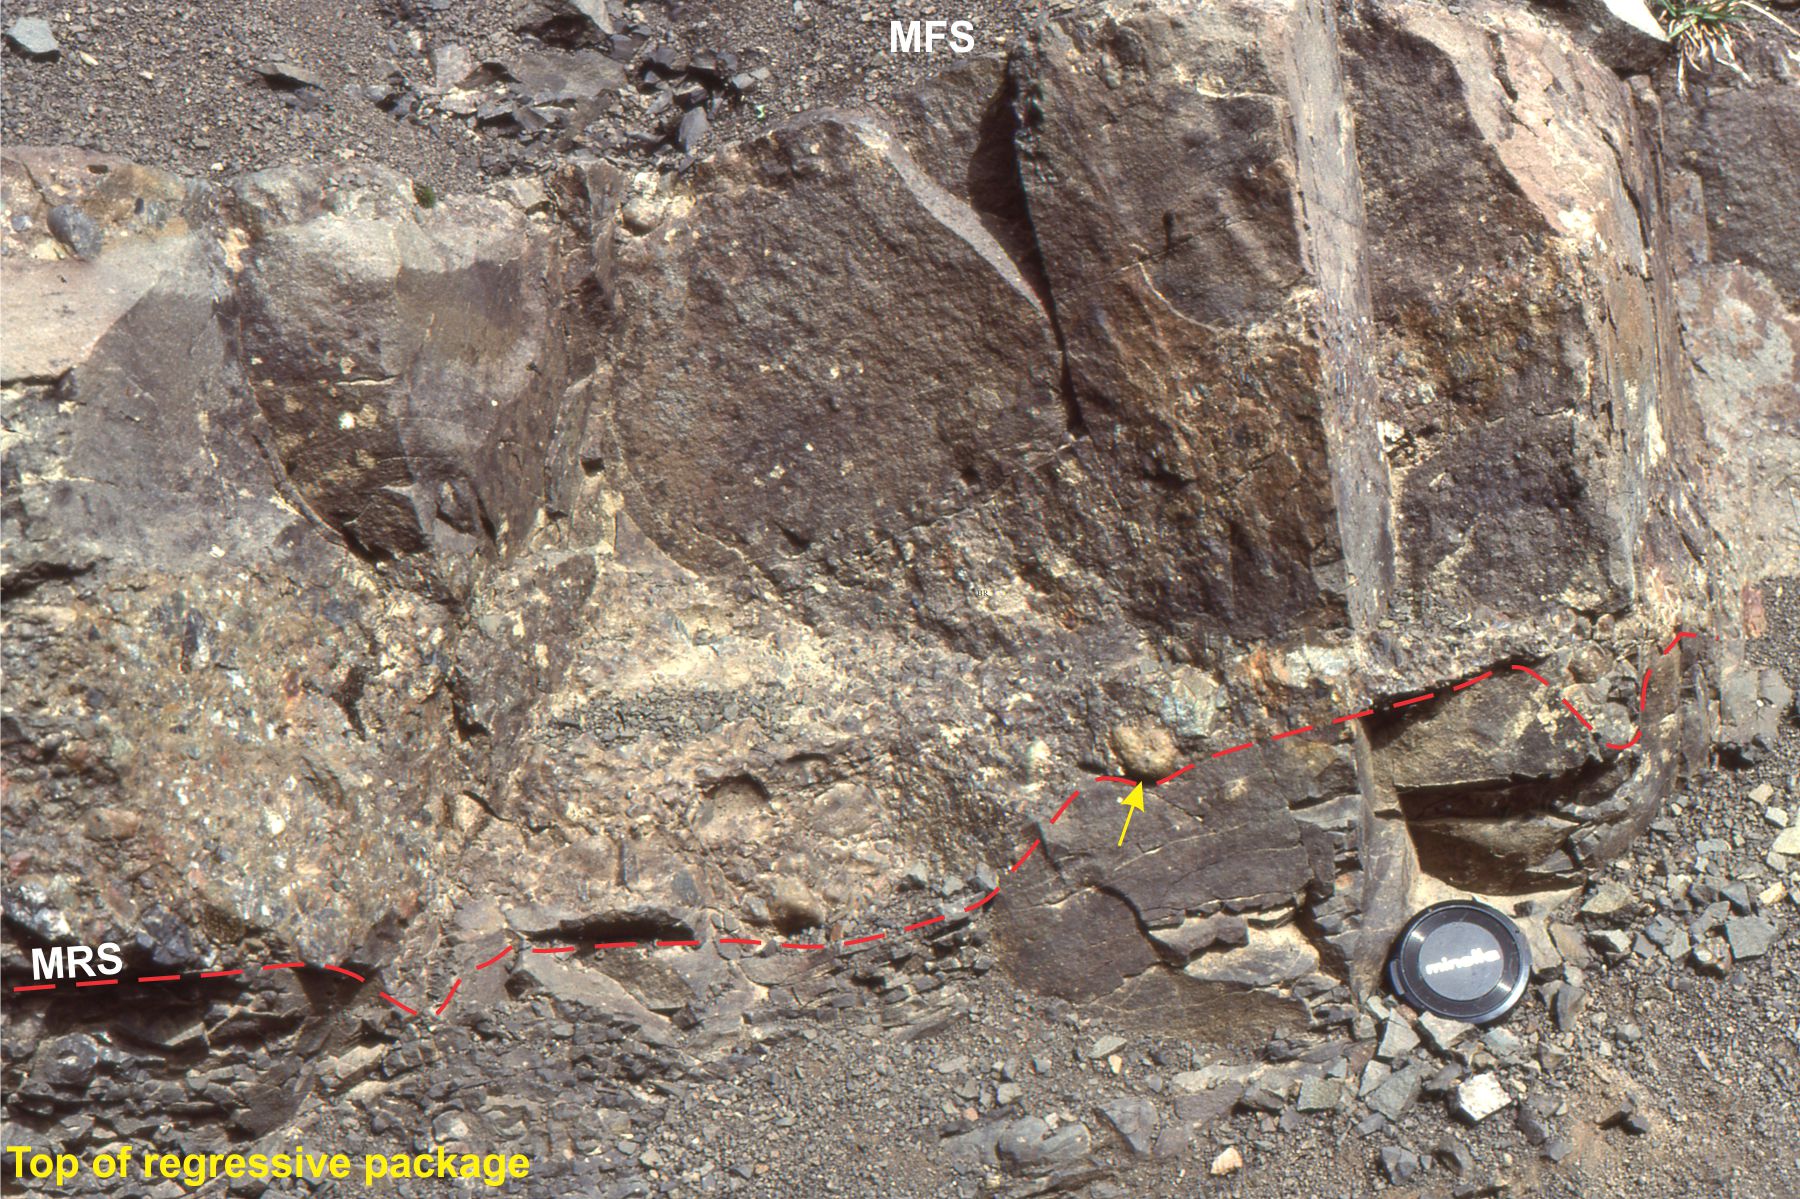
Detail of parasequence stratigraphy from the Jurassic Bowser Basin, northern British Columbia. The top of the regressive succession is identified as an MRS surface, outlined by the yellow dashed line. Above is a pebbly, fossiliferous muddy sandstone (small ammonite indicated by arrow), that grades upward to grey, muddy, micritic limestone (a few pebbles). The limestone is very hard and fractures conchoidally. The limestone is overlain by another coarsening-upward shale-sandstone package (the regressive component of the next parasequence); the limestone-shale contact is a maximum flooding surface (MFS).
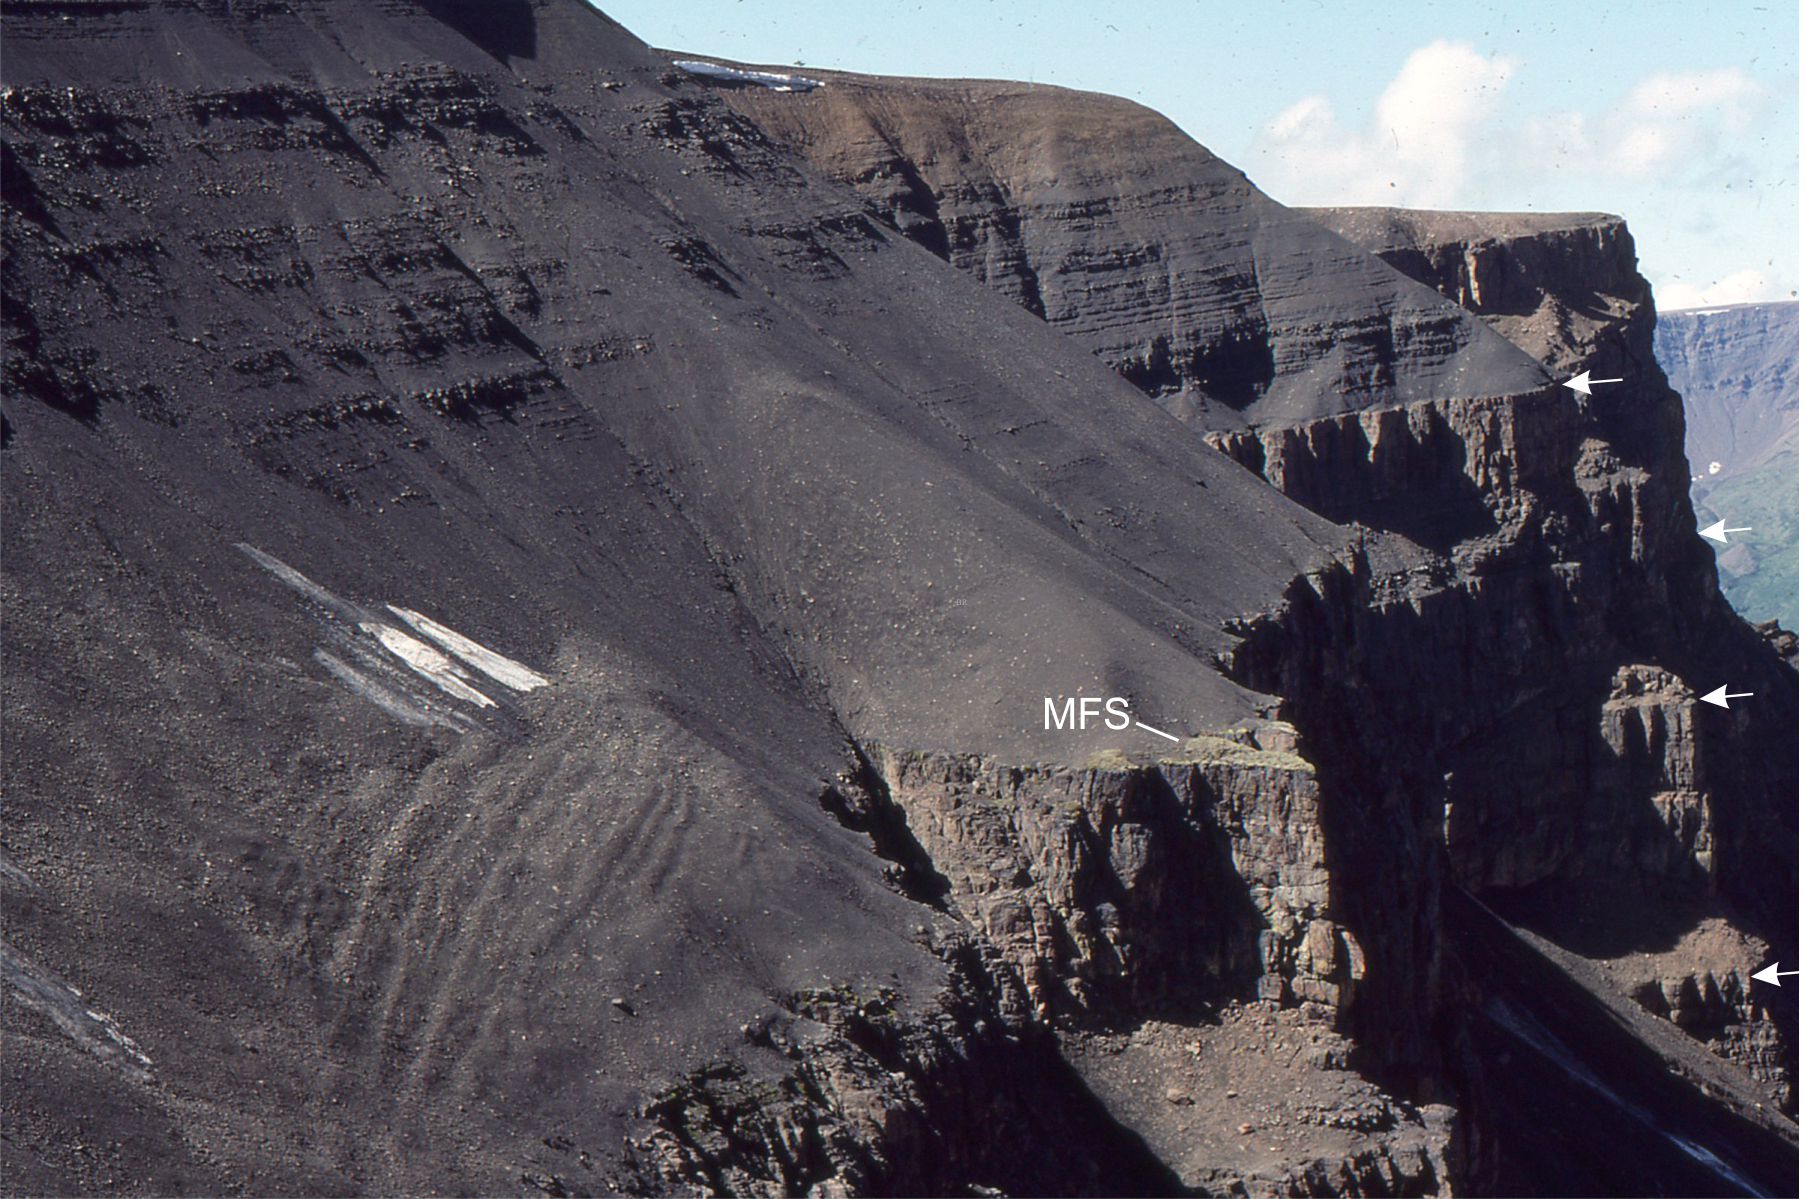
A classic topographic expression of resistant regressive sandstone cycles, each culminating in a maximum flooding surface in parasequences from the Jurassic Bowser Basin, northern British Columbia. The MFS in the foreground occurs just above the prominent bench where it is overlain by coarsening upward shale-sandstone of the succeeding regression. At least four such packages are present in this view (arrows indicate approximate MFS positions). Maximum regressive surfaces are also present below the MFS, as shown in the previous image. In each cycle, the transgressive package accounts for 10% or less of the total cycle thickness.
Some Sverdrup Basin sequence stratigraphy papers
Embry, A.F. 2011. Petroleum prospectivity of the Triassic–Jurassic succession of Sverdrup Basin, Canadian Arctic Archipelago. In Chapter 36, Spencer, A. M., Embry, A. F., Gautier, D. L., Stoupakova, A. V. & Sørensen, K. (eds) Arctic Petroleum Geology. Geological Society, London, Memoirs, 35, p. 545–558.
Embry, A.F., and Johannessen, E.P. 2017 Two Approaches to Sequence Stratigraphy. In; Chapter 27, Stratigraphy & Timescales, Volume 2, Elsevier. PDF available
Embry, A.F. 2018. Triassic history of the Tanquary High in NE Sverdrup Basin, Canadian Arctic Archipelago. In; Piepjohn, K., Strauss, J.V., Reinhardt, L., and McClelland, W.C., eds., Circum-Arctic Structural Events: Tectonic Evolution of the Arctic Margins and Trans-Arctic Links with Adjacent Orogens. The Geological Society of America Special Paper 541, p. 285–301.
Embry, A., and B. Beauchamp. 2019. Chapter 14. Sverdrup Basin. In; A.D. Miall, (Ed.), The Sedimentary Basins of the United States and Canada, Elsevier, p.559-592.
Ricketts, B.D. and Stephenson, R.A. 1994. The demise of Sverdrup Basin: Late Cretaceous – Paleogene sequence stratigraphy and forward modelling. Journal of Sedimentary Research (1994) 64 (4b): 516–530.
Other posts in this ‘outcrop’ series
Sedimentary structures: Shallow marine
Sedimentary structures: Turbidites
Sedimentary structures: Mass transport deposits
Sedimentary structures: Fine-grained fluvial
Sedimentary structures: coarse-grained fluvial
Sedimentary structures: Alluvial fans
Sedimentary structures: Stromatolites
Volcanics in outcrop: Lava flows
Volcanics in outcrop: Secondary volcaniclastics
Volcanics in outcrop: Pyroclastic fall deposits
Volcanics in outcrop: Pyroclastic density currents
Ignimbrites in outcrop and thin section
Accretionary aggregates and accretionary lapilli